Language Services Market Size and Share
Market Overview
| Study Period | 2020 - 2031 |
|---|---|
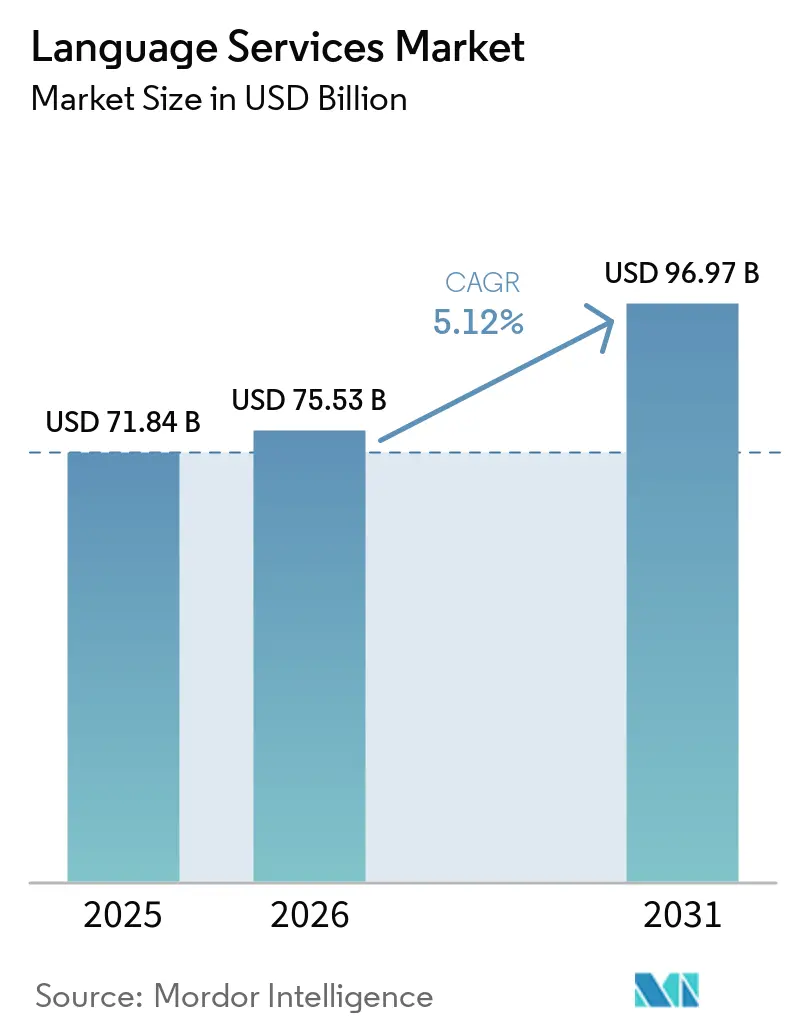
| Market Size (2026) | USD 75.53 Billion |
| Market Size (2031) | USD 96.97 Billion |
| Growth Rate (2026 - 2031) | 5.12% CAGR |
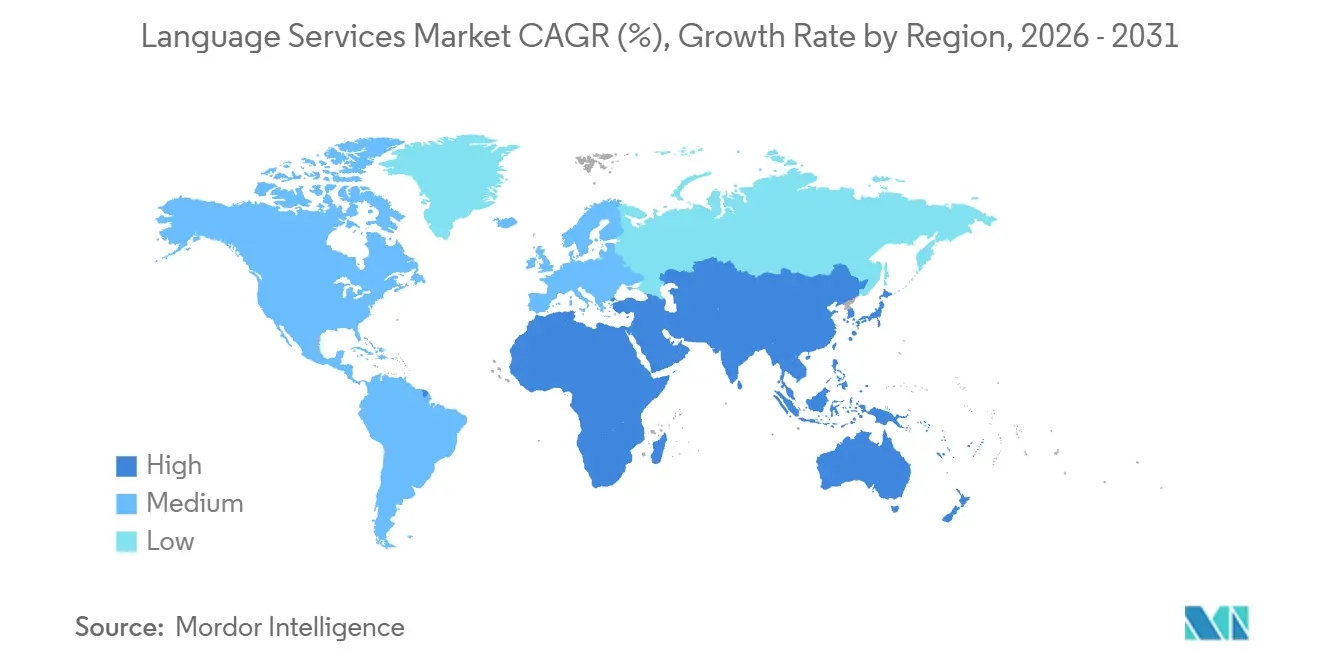
| Fastest Growing Market | Asia Pacific |
| Largest Market | North America |
| Market Concentration | Medium |
Major Players
*Disclaimer: Major Players sorted in no particular order Image © Mordor Intelligence. Reuse requires attribution under CC BY 4.0. |
|
Language Services Market Analysis by Mordor Intelligence
The Language Services Market size is projected to be USD 71.84 billion in 2025, USD 75.53 billion in 2026, and reach USD 96.97 billion by 2031, growing at a CAGR of 5.12% from 2026 to 2031. Rising globalization targets, stringent multilingual compliance rules, and rapid gains in large language model productivity are widening the addressable pool of regulated and customer-experience content. Vendors that combine proprietary neural engines with professional linguists now process higher word counts at a lower unit cost, a shift that underpins consistent mid-single-digit growth. Demand also benefits from cross-border e-commerce and voice-assistant rollouts that require always-on localization, thereby funneling incremental spend toward platforms offering real-time workflows. Competitive intensity is increasing because platform vendors combine technology, domain specialists, and managed services, compressing margins for pure translation agencies and rewarding integrated providers.
Key Report Takeaways
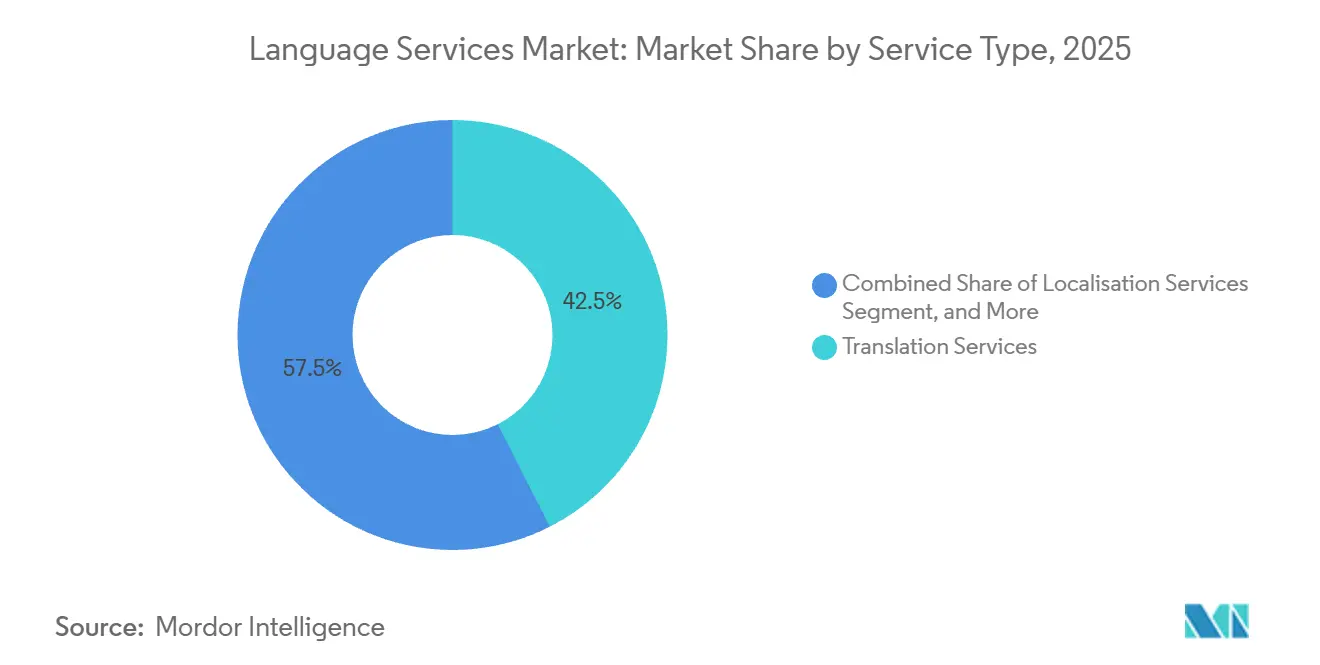
- By service type, translation services secured 42.52% of 2025 revenue, while AI-enabled localization is set to advance at a 6.16% CAGR through 2031.
- By end-user vertical, life sciences contributed 18.36% of 2025 spending, whereas E-commerce and retail is forecast to expand at a 7.32% CAGR to 2031.
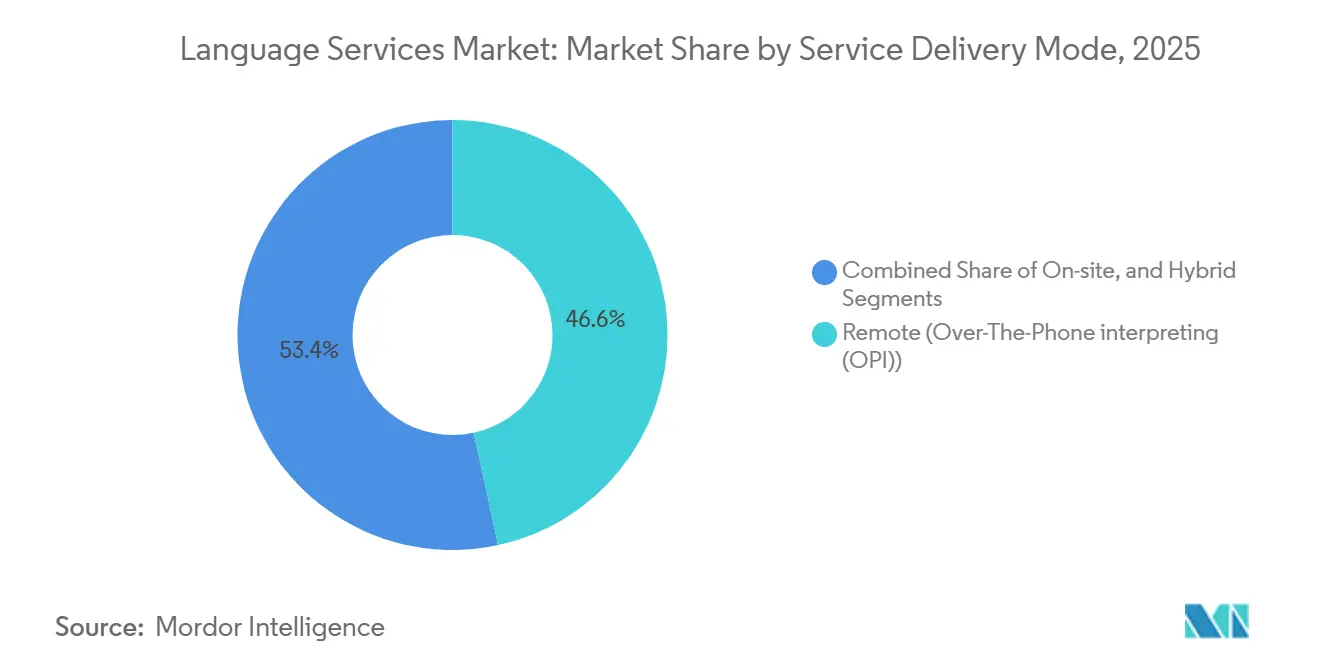
- By delivery mode, over-the-phone interpreting held 34.14% of 2025 revenue, and video-remote interpreting is growing at an 8.06% CAGR across the outlook.
- By technology, post-edited machine translation represented 38.87% of 2025 investment, while AI-enabled localization is rising at a 7.82% CAGR.
- By geography, North America generated 37.26% of 2025 sales, and the Asia Pacific is expected to record a 7.36% CAGR to 2031.
Note: Market size and forecast figures in this report are generated using Mordor Intelligence’s proprietary estimation framework, updated with the latest available data and insights as of January 2026.
Global Language Services Market Trends and Insights
Drivers Impact Analysis*
| Driver | (~) % Impact on CAGR Forecast | Geographic Relevance | Impact Timeline |
|---|---|---|---|
| Corporate globalisation wave intensifies demand | +1.2% | Global, with concentration in North America, Europe, and Asia Pacific | Medium term (2-4 years) |
| Explosive multilingual digital-content creation | +1.0% | Global, led by Asia Pacific and North America | Short term (≤ 2 years) |
| Stricter life-science compliance triggers premium regulated-content services | +0.9% | North America, Europe, with spillover to Asia Pacific | Long term (≥ 4 years) |
| Generative AI boosts throughput and margin expansion | +1.3% | Global, early adoption in North America and Europe | Short term (≤ 2 years) |
| Hyper-personalised multilingual CX mandates real-time micro-localisation | +0.7% | Global, strongest in North America, Europe, and Asia Pacific e-commerce hubs | Medium term (2-4 years) |
| Rise of voice assistants in emerging markets unlocks mass audio localisation | +0.6% | Asia Pacific core, spillover to Middle East and Africa | Medium term (2-4 years) |
| Source: Mordor Intelligence | |||
Corporate Globalization Wave Intensifies Demand
Enterprises pursuing cross-border revenue embed localization experts into design and product teams, reframing translation as a growth lever rather than a cost center. Native-language checkout flows, customer support portals, and compliance documentation reduce abandonment and expedite market entry, especially across the fragmented Southeast Asian e-commerce landscape. Success stories on TransPerfect’s GlobalLink platform show clients such as AIG cutting content turnaround by 20% and saving USD 250,000 annually through workflow automation. The outcome is a structural shift in premium localization demand that sustains the language services market's trajectory even as macroeconomic cycles fluctuate. Vendors with global linguist networks and ISO-aligned security protocols secure multi-year master agreements, which anchor predictable cash flow.
Explosive Multilingual Digital-Content Creation
Streaming giants, game publishers, and social-media platforms now launch titles and episodes in dozens of languages simultaneously, overwhelming purely human capacity. Hybrid workflows that blend AI dubbing and linguist post-production cut release times by up to 70% and costs by 50%, as demonstrated by Deepdub’s 80-language projects. Synthesia’s synthetic-voice platform spans 130+ languages and holds ISO 42001 certification, signaling enterprise-grade reliability. This velocity decouples output from head-count, expanding feasible coverage to long-tail language pairs and enlarging the overall language services market. However, generic volumes face margin pressure, so agencies differentiate through domain expertise, cultural transcreation, and proprietary AI engines.
Stricter Life-Science Compliance Triggers Premium Regulated-Content Services
EU Clinical Trials Regulation 536/2014 obliges sponsors to supply participant materials in every member-state language, while ICH E3/E5/E6 guidance enforces cross-language consistency. Acolad’s 2025 award to translate EU technical regulations into 23 languages highlights public-sector demand for certified audit-ready output. Life-science clients accept rates 30-50% higher per word to secure linguists versed in pharmacovigilance and device nomenclature, creating a resilient premium tier within the language services market. Providers offering validated terminology databases and secure workflow traceability capture this spend and hedge against pricing compression elsewhere.
Generative AI Boosts Throughput And Margin Expansion
Large language models deliver first-draft translations requiring fewer edits, lifting linguist productivity by 30-45% in customer operations, according to McKinsey. DeepL’s USD 300 million funding round and USD 2 billion valuation underscore investor belief that contextual neural engines will displace legacy statistical models. Translated’s Lara engine posted 40% higher human-evaluation scores and 76% quality gains on low-resource pairs in 2025. With cost per word falling and quality rising, vendors profitably address previously uneconomical languages, expanding the reachable language services market size while preserving margins.
Restraints Impact Analysis*
| Restraint | (~) % Impact on CAGR Forecast | Geographic Relevance | Impact Timeline |
|---|---|---|---|
| Open-source machine translation commoditises basic content | -0.8% | Global, strongest impact in North America and Europe | Short term (≤ 2 years) |
| Talent scarcity for niche domain linguists | -0.6% | Global, acute in North America and Europe for medical/legal/patent specialties | Long term (≥ 4 years) |
| Stringent data-sovereignty laws restrict cross-border linguistic datasets | -0.4% | Europe (GDPR), China (PIPL), India (DPDP Act), with spillover to Asia Pacific | Medium term (2-4 years) |
| Rising client-side integration costs create vendor-switching friction | -0.3% | Global, primarily affecting enterprise clients in North America and Europe | Medium term (2-4 years) |
| Source: Mordor Intelligence | |||
Open-Source Machine Translation Commoditizes Basic Content
Freely available neural models such as Meta’s NLLB-200 and Google Translate now reach near-human parity on common language pairs, enabling firms to translate manuals or reviews in-house.[1]Google, “Assistant Language Expansion in India,” google.com This erodes pricing power on commodity text and forces agencies to reposition as managed-service partners that fine-tune open engines, integrate MT into content stacks, and certify output quality. Although higher-value regulated and creative projects remain insulated, margin compression on basic content trims overall growth in the language services market.
Talent Scarcity For Niche Domain Linguists
Medical, legal, and patent translation requires years of domain training, yet the supply of qualified linguists lags demand. Wage inflation of 10-15% among specialized translators in North America and Europe squeezes agency profitability and can lead to project bottlenecks. Low-resource languages such as Arabic medical or Japanese patent translation face acute shortages, limiting vendor capacity to scale premium services. Agencies invest in AI-assisted mentoring, but quality assurance constraints keep ramp-up times lengthy, placing a structural drag on the expansion of the language services market.
*Our forecasts treat driver/restraint impacts as directional, not additive. The impact forecasts reflect baseline growth, mix effects, and variable interactions.
Segment Analysis
By Service Type: Translation Anchors Revenue, AI-Localization Accelerates
Translation Services contributed 42.52% of 2025 revenue, cementing its role as the foundational engine of the language services market. Clients rely on it for legal contracts, product documentation, and compliance filings, and providers have embedded automated QA, desktop publishing, and terminology management to preserve layout and brand tone. Yet growth momentum is shifting toward AI-Enabled Localization, which is advancing at a 6.16% CAGR by delivering adaptive output that updates alongside agile product releases.
Localization workflows now bundle cultural adaptation, UI testing, and multimedia engineering, making them indispensable for software, gaming, and e-commerce launches. Interpreting Services are splitting into on-demand remote channels and high-touch simultaneous sessions for conferences and courts, while subtitling and captioning volumes surge on the back of streaming and corporate training. Premium transcreation reimagines creative assets for target cultures, commanding higher fees and reinforcing provider differentiation. Integrated offerings that weave machine translation, human post-editing, and cultural consulting under unified governance continue to expand total language services market size.


By End-User Vertical: Life Sciences Leads Share, E-Commerce Drives Growth
Life Sciences captured 18.36% of 2025 spending, underpinned by multilingual labeling, pharmacovigilance reports, and clinical-trial materials required by the FDA and EMA.[2]FDA, “Regulatory Translation Requirements,” U.S. Food and Drug Administration, fda.gov The need for audit trails and terminological precision supports premium pricing and predictable demand, insulating revenue during economic downturns.
E-Commerce and Retail is forecast to grow at a 7.32% CAGR because cross-border marketplaces must localize product descriptions, payment flows, and customer-support scripts in near real time. As regional payment regulations proliferate, accurate translation becomes essential to checkout compliance and conversion uplift, enlarging the language services market share tied to retail. Media and Entertainment, Legal Finance and Patents, and IT and Telecom add diversified volume streams, while Government projects such as Acolad’s EU regulation contract illustrate scale opportunities in public-sector translation.
By Service Delivery Mode: OPI Dominates, VRI Surges on Visual Context
Over-the-Phone Interpreting maintained a 34.14% slice of 2025 revenue, anchoring the language services market because health-care triage lines, emergency response centers, and contact-center outsourcers rely on instant voice access. Growth, however, tilts toward Video Remote Interpreting, advancing at an 8.06% CAGR as hospitals and courts pivot to video-first workflows that deliver facial-expression cues, on-screen document sharing, and HIPAA-compliant recording.
Providers investing in low-latency streaming, interpreter-scheduling AI, and quality-monitor dashboards capture disproportionate language services market share. On-site sessions remain vital for diplomatic summits and high-stakes legal depositions, yet hybrid models that blend in-person for plenaries with remote overflow capacity now dominate large events, broadening the addressable language services market size for infrastructure-ready vendors.
By Technology: PEMT Leads Adoption, AI-Localization Gains Momentum
Post-Edited Machine Translation held 38.87% of 2025 spending, reflecting enterprise comfort with human-refined neural output for mid-risk content. The workflow balances speed and brand tone, ensuring the language services market retains a sizable human component even as automation rises.
AI-Enabled Localization, expanding at a 7.82% CAGR, embeds contextual memory and prompt-based controls so every translation cycle learns client terminology, shrinking edit loops and lifting margin. Pure Machine Translation solves gist or user-generated scenarios, whereas human-only pathways persist in legal contracts and informed-consent forms. The layered stack creates a continuum where vendors tune cost, risk, and turnaround, sustaining steady growth in the language services market.
Geography Analysis
North America generated 37.26% of 2025 revenue, powered by pharmaceutical filings, cross-border e-discovery, and software globalization. United States buyers pay premium rates for certified linguists, lifting average invoice values inside the language services market. Canada’s federal bilingualism drives English-French demand, while Mexico’s near-shoring boom boosts English-Spanish technical documentation.
Asia Pacific posts the fastest expansion at a 7.36% CAGR. Voice-assistant rollouts covering 30+ Indian languages, plus Japanese and Korean state subsidies for cultural exports, add high-volume audio and subtitle work.[3]Google, "Google Translate: 133 Language Coverage." Google, 2024, google.com China’s e-commerce giants localize catalog listings and chat-bots into Southeast Asian vernaculars, lifting regional language services market size. Australia and New Zealand act as quality-assurance hubs that support 24-hour global delivery.
Europe remains a stalwart demand center because EU regulations mandate multilingual packaging, clinical-trial dossiers, and public-sector communications across 24 official languages. Germany, France, and the United Kingdom concentrate specialist linguists in automotive, chemical, and luxury fields, preserving the continent’s high-value share of the language services market. The Middle East and Africa and South America contribute incremental upside as Saudi Vision 2030, Brazilian retail liberalization, and South African public-health initiatives unlock Arabic, Portuguese, and African-language projects.

Competitive Landscape
The top five vendors control roughly one-third of global revenue, yet niche disruptors still flourish. TransPerfect recorded USD 1.23 billion in revenue for 2024 and executed multiple acquisitions in 2025 to deepen its media-localization breadth. RWS announced translating 1 trillion words in the prior year, proving economies of scale unattainable for boutique agencies. Private-equity appetite surfaced when EQT bought Keywords Studios for GBP 2.1 billion (USD 2.6 billion), validating the cash-generative potential of gaming localization.
Technology remains the defining battleground. Providers with proprietary neural engines, deep integration into content-management ecosystems, and ISO 42001 AI governance certifications sustain pricing power. Start-ups such as Wordly attack live-event interpretation with sub-second automated captions, compelling incumbents to invest in speech-to-speech AI.
White-space opportunities span AI-accelerated linguist training, low-resource voice corpus annotation, and compliance automation areas where smaller specialists can secure a durable market share in the language services sector.
Language Services Industry Leaders
-
TransPerfect Global Inc.
-
RWS Holdings plc
-
Lionbridge Technologies Inc.
-
LanguageLine Solutions
-
Welocalize Inc.
- *Disclaimer: Major Players sorted in no particular order


Recent Industry Developments
- November 2025: Translated expanded its Lara AI engine to 200 languages, reporting 40% higher human-evaluation scores and up to 76% quality gains on low-resource pairs.
- November 2025: Wordly surpassed 4 000 customers and 5 million users worldwide, doubling headcount over the prior year.
- November 2025: TransPerfect launched its first Saudi Arabia office in Riyadh to serve Middle East clients aligned with Vision 2030.
- October 2025: RWS disclosed processing 1 trillion translated words during the previous 12 months.


Research Methodology Framework and Report Scope
Market Definitions and Key Coverage
Our study defines the language services market as every paid activity that converts written or spoken content from one language to another, including translation, interpreting, localization, subtitling, captioning, desktop publishing, transcreation, and allied multimedia adaptations. Revenues from stand-alone language-learning apps, raw machine-translation APIs sold without human oversight, and generic natural-language-processing software are not counted in this total.
Pure-play NLP software licenses, foreign-language tutoring, and advertising copywriting that is created from scratch are outside this report's scope.
Segmentation Overview
-
By Service Type
- Translation services
- Localisation services
- Interpreting services
- Subtitling and captioning
- Desktop publishing (DTP)
- Transcreation
- Other Service Types
-
By End-User Vertical
- Life sciences
- Media and entertainment
- Legal, finance and patents
- E-commerce and retail
- IT and telecom
- Government and public sector
- Manufacturing and industrial
- Other End-User Verticals
-
By Service Delivery Mode
- On-site
-
Remote
- Over-the-Phone Interpreting (OPI)
- Video Remote Interpreting (VRI)
- Hybrid
-
By Technology
- Human-only
- Pure machine translation
- Post-edited machine translation (PEMT)
- AI-enabled localisation
- Other Technologies
-
By Geography
-
North America
- United States
- Canada
- Mexico
-
South America
- Brazil
- Argentina
- Rest of South America
-
Europe
- Germany
- United Kingdom
- France
- Italy
- Spain
- Russia
- Rest of Europe
-
Asia Pacific
- China
- Japan
- South Korea
- India
- Australia
- New Zealand
- Rest of Asia Pacific
-
Middle East
- United Arab Emirates
- Saudi Arabia
- Turkey
- Rest of Middle East
-
Africa
- South Africa
- Nigeria
- Kenya
- Rest of Africa
-
North America
Detailed Research Methodology and Data Validation
Primary Research
Mordor analysts interviewed procurement heads at healthcare systems, localization managers at gaming studios, and regional LSP owners across North America, Europe, Asia Pacific, and the Middle East. These conversations verified utilization rates of video-remote interpreting, clarified AI post-editing discount curves, and stress-tested the preliminary demand pool we built from desk research.
Desk Research
We began by mapping global demand and supply signals through publicly available tier-one sources such as UN Comtrade shipment codes for printed material, Eurostat's cultural industries data set, the US Bureau of Labor Statistics' interpreter employment tables, and annual LSP rankings released by Nimdzi Insights and CSA Research. Complementary context came from industry associations including the American Translators Association and Translators Without Borders, as well as judicial procurement portals that publish contract values for court interpreting.
Company 10-Ks, IPO filings, and investor decks provided average selling price (ASP) clues, while press releases on large multilingual media launches helped us benchmark project volumes. We enriched these open sources with paid feeds from D&B Hoovers (financials of mid-size LSPs) and Dow Jones Factiva (deal flow and expansion news). This list is illustrative, not exhaustive; many additional sources informed data validation.
Market-Sizing & Forecasting
We reconstructed the baseline through a top-down model that aligns global GDP-weighted content output with observed language-dependency ratios, which are then adjusted by trade-weighted immigration flows. Select bottom-up checks, supplier roll-ups of the top LSPs and sampled ASP × word-count audits, anchored intermediary totals. Key variables include average per-minute interpreting tariffs, digital video hours uploaded per region, cross-border e-commerce order volumes, growth in international patient admissions, and AI post-editing penetration rates. Forecasts employ a multivariate regression that links these drivers to macro indicators, supplemented by scenario analysis for rapid AI adoption. Gaps in granular vendor data were bridged with conservative midpoint estimates vetted in expert calls.
Data Validation & Update Cycle
Outputs pass three layers of review: automated anomaly scans, senior analyst variance checks against independent KPIs, and a sign-off meeting. Reports refresh annually, with interim updates triggered by acquisitions over USD 500 million, major regulatory changes, or sudden shifts in AI pricing.
Why Mordor's Language Services Baseline Deserves Confidence
Published market figures frequently diverge because each firm selects its own service mix, geographic roll-ups, and AI revenue treatment. Our disciplined scope, yearly refresh, and dual-track modeling narrow that spread for clients who need a dependable planning anchor.
Key gap drivers include competitors counting language-learning apps, excluding on-site interpreting, or applying aggressive AI-driven ASP erosion well before verified adoption. Currency conversion years and refresh cadences further stretch differences.
Benchmark comparison
| Market Size | Anonymized source | Primary gap driver |
|---|---|---|
| USD 71.82 B (2025) | Mordor Intelligence | - |
| USD 71.53 B (2024) | Regional Consultancy A | Mix omits desktop publishing and subtitling |
| USD 71.77 B (2022) | Global Consultancy B | Back-year baseline, no inflation rebasing |
| USD 75.5 B (2024) | Industry Association C | Includes language-learning software revenues |
In summary, Mordor's balanced mix of audited public data, targeted expert validation, and transparent variable selection produces a baseline that remains traceable, replicable, and to our clients, plainly trustworthy.


Key Questions Answered in the Report
What growth rate is expected for the language services market through 2031?
The industry is projected to post a 5.12% CAGR, moving from USD 75.53 billion in 2026 to USD 96.97 billion by 2031.
Which delivery mode is expanding the fastest?
Video Remote Interpreting is advancing at an 8.06% CAGR as health-care and legal settings prioritize visual context.
Why does Life Sciences represent the largest vertical share?
Regulatory mandates from bodies such as the FDA and EMA require certified multilingual documentation, driving 18.36% of 2025 spending.
How does generative AI influence market economics?
Large language models lift linguist productivity by up to 45%, allowing vendors to address more volume while protecting margins.
Which region offers the highest future growth potential?
Asia Pacific leads with a 7.36% CAGR, fueled by localized voice-assistant expansion and state-funded content-export programs.
Is the market highly consolidated?
No, a moderate concentration prevails; the top five players hold roughly one-third of revenue, leaving room for specialist entrants.
Page last updated on:


