Satellite Payload Market Size and Share
Market Overview
| Study Period | 2020 - 2031 |
|---|---|
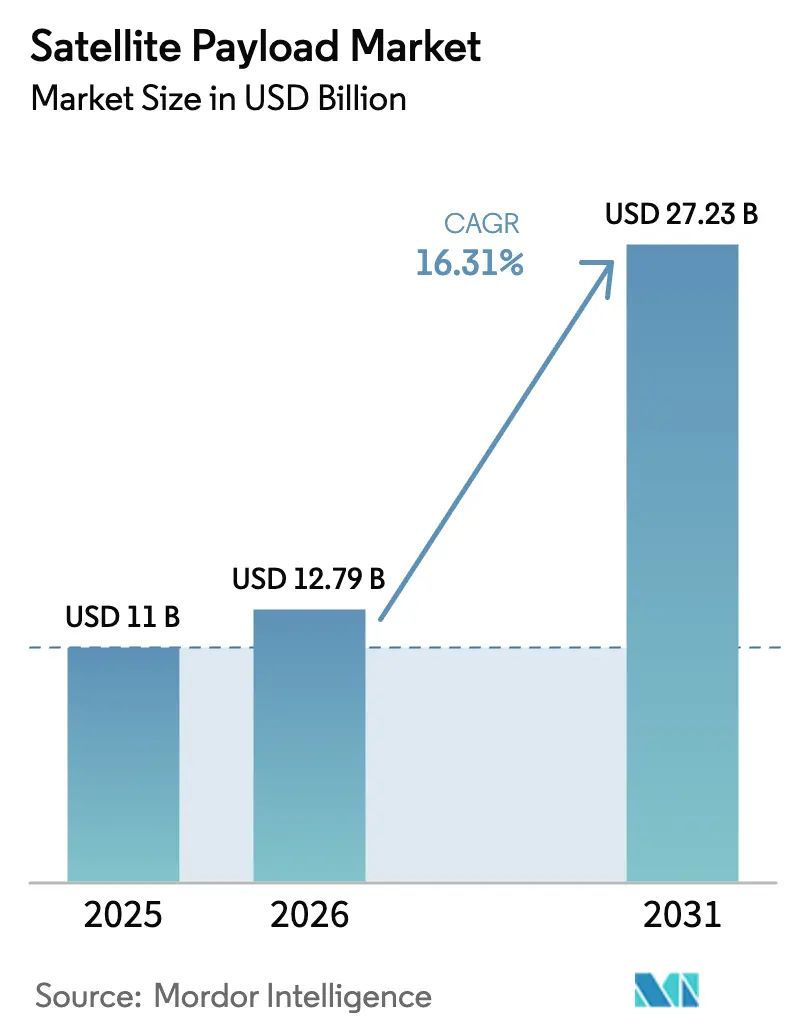
| Market Size (2026) | USD 12.79 Billion |
| Market Size (2031) | USD 27.23 Billion |
| Growth Rate (2026 - 2031) | 16.31% CAGR |
| Fastest Growing Market | Asia Pacific |
| Largest Market | North America |
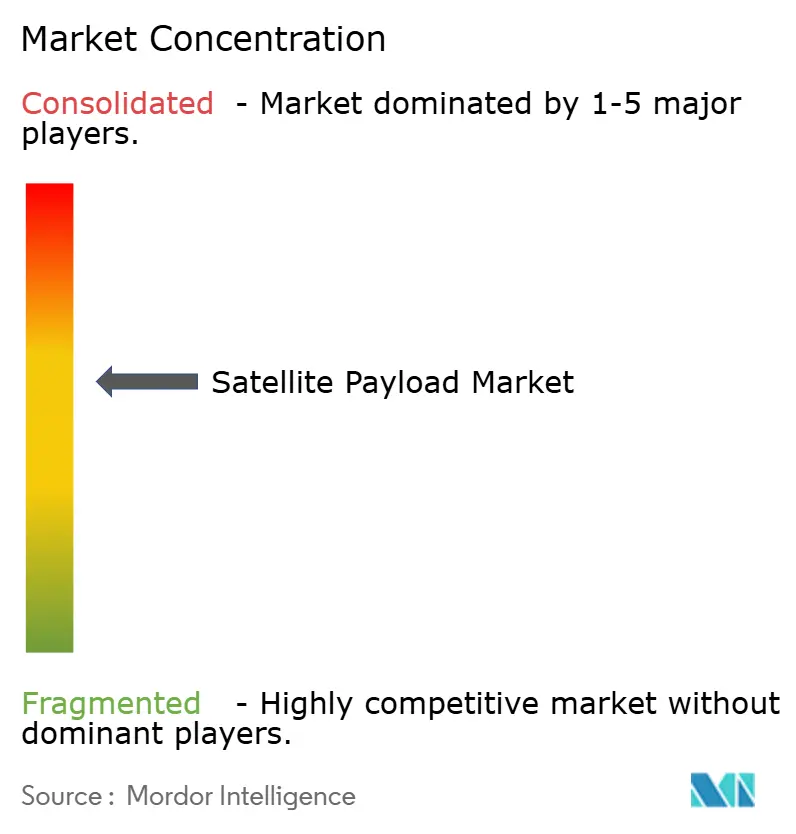
| Market Concentration | Medium |
Major Players *Disclaimer: Major Players sorted in no particular order Image © Mordor Intelligence. Reuse requires attribution under CC BY 4.0. | |
Satellite Payload Market Analysis by Mordor Intelligence
Satellite payload market size in 2026 is estimated at USD 12.79 billion, growing from 2025 value of USD 11.00 billion with 2031 projections showing USD 27.23 billion, growing at 16.31% CAGR over 2026-2031. Rapid funding growth from national space programs, aggressive low-Earth-orbit (LEO) constellation rollouts, and the shift toward software-defined architectures underpin this expansion. LEO deployments already account for more than three-fifths of operational payloads. At the same time, bandwidth-hungry broadband, Earth-observation data monetization, and dual-use (military-commercial) requirements keep demand buoyant across both civil and defense domains. Incumbent manufacturers answer SpaceX’s cost disruption with vertical integration moves—such as SES absorbing Intelsat and MDA Space buying SatixFy—while start-ups scale production through volume contracts for hundreds of standardized spacecraft. North America remains the revenue anchor, yet Asia-Pacific delivers the quickest incremental growth as China and India widen launch manifests and invest in domestic payload platforms.
Key Report Takeaways
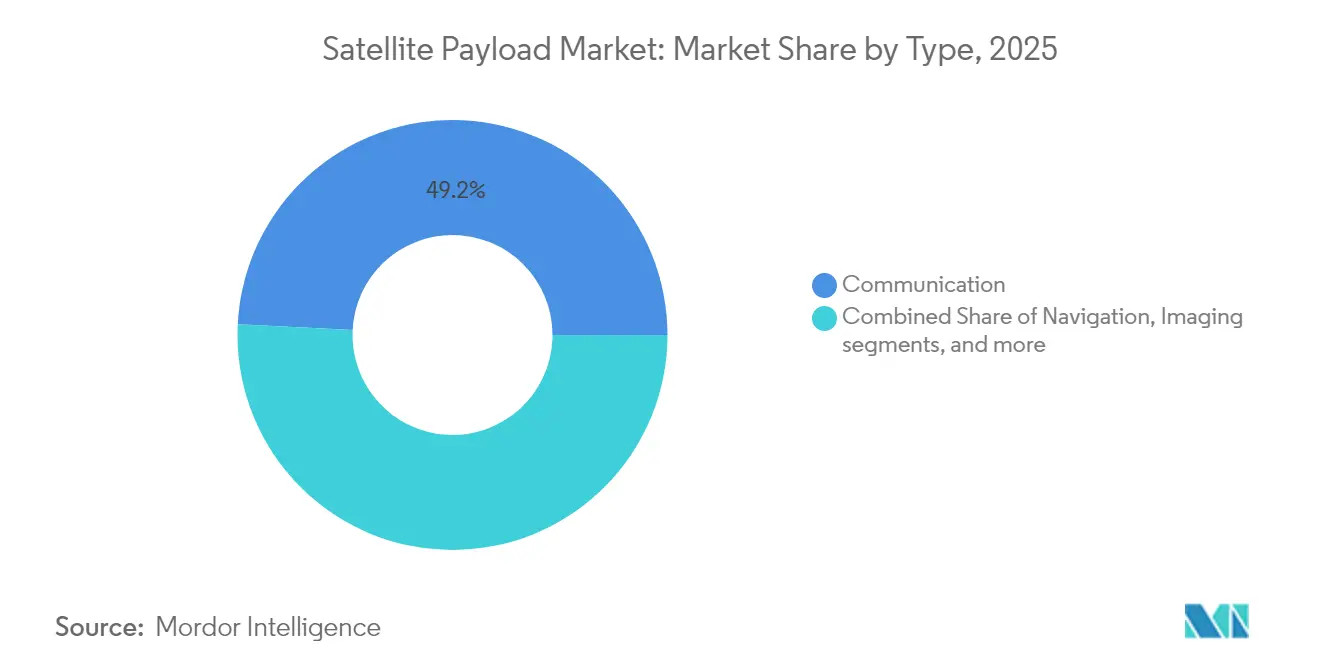
- By payload type, communication payloads led with 49.20% of the satellite payload market share in 2025, whereas software-defined payloads are forecast to post the fastest 21.92% CAGR to 2031.
- By orbit, low-Earth-orbit (LEO) systems held 62.10% share of the satellite payload market in 2025 and are projected to expand at an 18.70% CAGR through 2031.
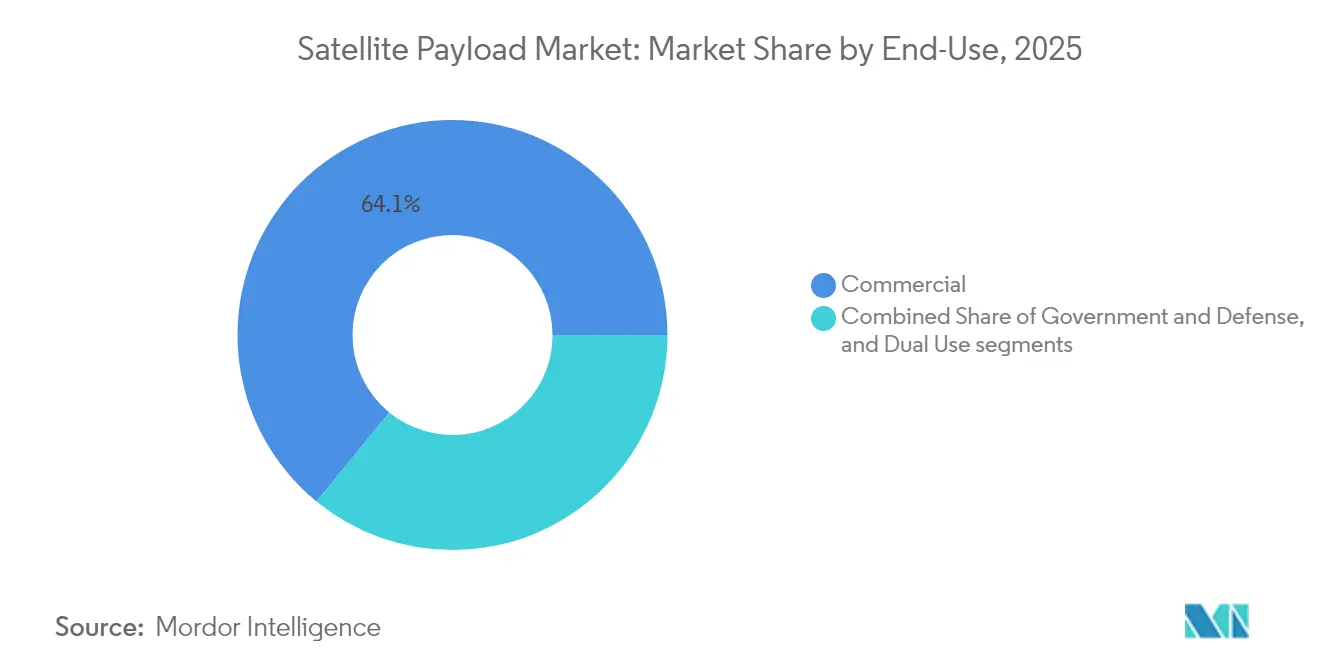
- By end-use, commercial operators accounted for 64.10% of revenue in 2025; dual-use missions represent the fastest-growing slice, with a 21.20% CAGR.
- By application, communication services commanded 46.90% of the satellite payload market size in 2025, while scientific research payloads will climb at an 18.18% CAGR over the forecast.
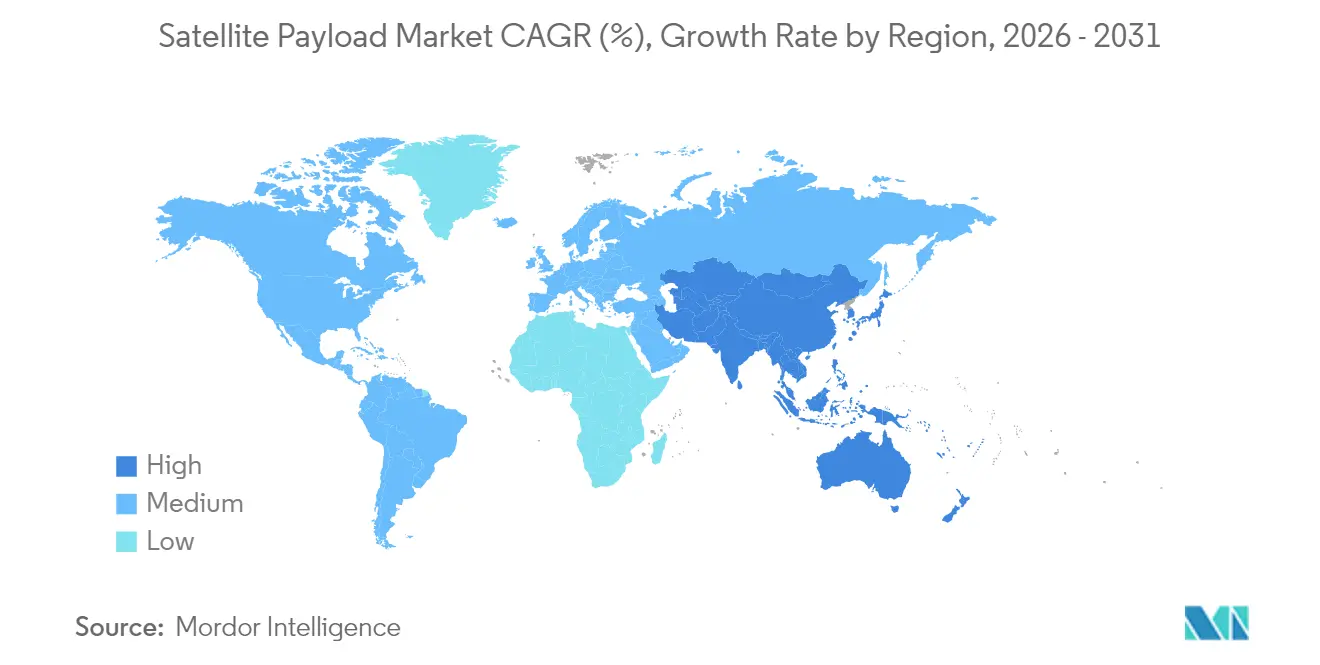
- By geography, North America captured a 42.20% share in 2025, yet Asia-Pacific is positioned for a 19.45% CAGR to 2031.
Note: Market size and forecast figures in this report are generated using Mordor Intelligence’s proprietary estimation framework, updated with the latest available data and insights as of 2026.
Global Satellite Payload Market Trends and Insights
Drivers Impact Analysis*
| Driver | (~) % Impact on CAGR Forecast | Geographic Relevance | Impact Timeline |
|---|---|---|---|
| Rising government and multilateral space-program budgets | +4.2% | North America, Asia-Pacific | Medium term (2-4 years) |
| Surging demand for high-throughput broadband constellations | +3.8% | Global | Short term (≤2 years) |
| Earth-observation data monetization across industries | +2.9% | North America, Europe | Medium term (2-4 years) |
| LEO constellation proliferation lowering unit economics | +3.1% | Developed markets | Short term (≤2 years) |
| Adoption of software-defined reconfigurable payloads | +2.7% | Europe, North America | Long term (≥4 years) |
| Low-cost rideshare and micro-launchers expanding access | +2.1% | Emerging markets | Medium term (2-4 years) |
| Source: Mordor Intelligence | |||
Rising Government and Multilateral Space-Program Budgets
Defense allocations continue to swell, lifting overall satellite payload demand as governments prioritize resilient, distributed architectures.[1]Source: Aerospace Corporation, “FY 2025 defense space budget,” csps.aerospace.org NASA has earmarked USD 1.3 billion in FY 2025 for commercial LEO development, injecting direct capital into next-generation payload R&D. India’s 2024 space budget pushes indigenous payload manufacturing for communications and radar missions. Meanwhile, the US Department of Defense (DoD) taps commercial satellite networks such as Starshield to augment military connectivity, accelerating dual-use uptake. As public agencies spread risk across multiple orbits, suppliers capable of rapid reconfiguration and mass production gain a measurable advantage. The net result is a sustained uplift in contracted payload volumes through mid-decade.
Surging Demand for High-Throughput Broadband Constellations
Starlink’s third-generation satellites lift per-spacecraft throughput to roughly one terabit per second, multiplying capacity tenfold versus earlier units. China’s GuoWang program counters with a 13,000-satellite roadmap that scales launches at 300 units annually. Downstream, mid-tier manufacturers such as NanoAvionics have secured nine-digit contracts to supply hundreds of platforms, reinforcing a high-volume, low-unit-cost model. Broadband constellations remain the largest demand driver for communication payload assemblies through at least 2028.
Earth-Observation Data Monetization Across Industries
Economic value from Earth-observation analytics is forecast to exceed USD 3.8 trillion during 2023-2030 as downstream sectors monetize insights in agriculture, finance, and climate resilience. European demand alone will almost double to USD 8 billion by 2032, underpinned by hyperspectral and synthetic-aperture-radar payloads that deliver finer temporal resolution.[2]Source: European Space Agency, “Six trends to watch in commercial Earth observation,” esa.int Missions such as ESA’s Φsat-2 embed artificial intelligence for cloud screening and vessel identification, ensuring that only actionable pixels traverse the downlink. This onboard processing lowers data-transport costs, raising margins for operators. Consolidation among imagery analytics firms suggests continued value creation from payload-centric services rather than hardware alone.
LEO Constellation Proliferation Lowering Unit Economics
SpaceX operates 6,215 active satellites, representing 60% of all on-orbit assets and proving how scale compresses per-unit payload cost. Standardized buses and modular components reduce cycle times to months, while software-defined radios swap functions over the air, limiting hardware refreshes. Super-heavy launchers like Starship promise order-of-magnitude cost reductions per kilogram, further lowering thresholds for experimental or niche payload missions.
Restraints Impact Analysis*
| Restraint | (~) % Impact on CAGR Forecast | Geographic Relevance | Impact Timeline |
|---|---|---|---|
| Spectrum congestion and regulatory bottlenecks | –2.1% | Developed markets | Short term (≤2 years) |
| Escalating R&D cost of next-gen payload technologies | –1.8% | High-tech regions | Medium term (2-4 years) |
| Stricter space-debris mitigation standards | –1.4% | EU, US | Long term (≥4 years) |
| Uncertainty in on-orbit servicing revenue models | –0.9% | Commercial markets | Medium term (2-4 years) |
| Source: Mordor Intelligence | |||
Spectrum Congestion and Regulatory Bottlenecks
With LEO and GEO operators fighting over power-flux-density limits, licensing lead times now stretch to nine months in the United States, stalling some constellation deployments. International Telecommunication Union cycles cannot keep pace with innovative waveforms, forcing informal coordination that favors incumbents. The forthcoming EU Space Act is set to impose additional compliance layers on non-European firms, creating parallel regulatory tracks that complicate global rollouts. As spectrum demand surges, payload suppliers must design agile radios and file applications earlier, increasing program risk and cost.
Stricter Space-Debris Mitigation Standards
The FCC’s five-year de-orbit rule replaces the former 25-year guideline, forcing mission planners to add propulsion, autonomous navigation, or drag-sail systems that consume up to 10% of total spacecraft budgets.[3]Source: Federal Communications Commission, “Mitigation of orbital debris,” federalregister.gov ESA’s Zero Debris initiative mandates compliant platforms by 2030, and early studies peg protective measures at 5-10% of geostationary mission outlays. Insurance capacity remains thin: fewer than half of new satellites carry full coverage, exposing operators to loss-of-asset risk. Higher technical and financial hurdles slow new-entrant participation and may temper the overall satellite payload market’s expansion rate.
*Our forecasts treat driver/restraint impacts as directional, not additive. The impact forecasts reflect baseline growth, mix effects, and variable interactions.
Segment Analysis
By Payload Type – Flexibility Becomes the Decisive Metric
Communication hardware generated 49.20% of industry revenue in 2025 as broadband and trunking services dominated operator procurement. Software-defined payloads, though still a smaller slice, are advancing at a 21.92% CAGR because their on-orbit reconfiguration cuts lifetime upgrade costs and lets operators shift beams or frequencies to match traffic peaks. Imaging and radar payloads are also on a solid upswing, helped by commercial SAR constellations that sell change-detection data to insurers, energy firms, and governments. Niche scientific instruments—such as quantum-key-distribution terminals and space-weather monitors—round out demand by serving high-margin research missions.
Investor appetite for adaptive architectures means the total satellite payload market value of software-defined platforms could triple between 2026 and 2031 as more LEO and GEO programs switch from analog repeaters to fully digital processors. Miniaturized communication modules now cram multi-gigabit throughput into sub-200 kg buses, encouraging multi-manifest launches and faster replacement cycles. Component vendors follow suit by rolling out radiation-tolerant FPGAs and chipsets that support in-field upgrades, a trend that further cements flexibility as the prime buying criterion. These shifts are tilting procurement scorecards toward payload suppliers that pair reconfigurable hardware with secure, cloud-based mission-planning software.


By Orbit – LEO Commands the Manufacturing Queue
Low-Earth-orbit (LEO) platforms account for 62.10% of shipped units and are projected to grow at an 18.70% CAGR through 2031, driven by latency-sensitive services that need 30-70 ms round-trip links to smartphones and enterprise terminals. The satellite payload market benefits because standardized LEO buses allow line-production methods similar to automotive plants, significantly compressing build times and unit pricing. Medium-Earth-orbit fleets remain indispensable for navigation networks; Galileo’s second-generation craft layer features fully digital payloads and laser cross-links onto electric-propulsion buses to deliver global centimeter-level accuracy.
Geostationary systems face cost pressure yet provide irreplaceable, continent-wide footprints for maritime, aero, and governmental broadcast customers. New small-GEO products such as HummingSat let operators field 2-3 kW payloads at a fraction of legacy launch budgets, widening GEO’s addressable market. Forecasts point to just 3-4% annual revenue growth for GEO payloads, but hybrid network designs—where LEO handles high-speed backhaul and GEO provides always-on coverage—should keep demand steady. Procurement templates will likely specify multi-orbit interoperability as a baseline by decade-end, forcing payload designers to prioritize cross-network handshake protocols and agile antennas.
By End-Use – Commercial Still Dominates, Dual-Use Surges
Commercial operators captured 64.10% of 2025 sales as broadband constellations and data analytics platforms drew sustained venture and private-equity funding. Dual-use missions—where militaries lease capacity or buy data outright—are expanding fastest at a 21.20% CAGR, buoyed by defense agencies’ need for resilient communications that mesh seamlessly with commercial networks. The US Air Force’s blended-satcom pilot underscores official support for this approach and signals long-term budget alignment favoring mixed civil-military fleets.
Commercial imagery providers now deliver near-real-time SAR feeds for governmental target tracking and disaster response. This service model further dissolves the line between public and private space assets. Pure government programs still move forward—especially for secure links, meteorology, and signals intelligence—but budget growth lags the quicker commercial cycle. Taken together, procurement teams increasingly favor payload vendors that can certify hardware to civilian and defense standards, offer cleared manufacturing lines, and bundle analytics to shorten decision loops for end users.
By Application – Science Moves From Niche to Growth Engine
Communications remains the volume driver with 46.90% share. Yet, scientific research payloads post the steepest 18.18% CAGR as quantum-encryption demos, climate missions, and lunar infrastructure projects leave the proposal stage and secure funding. Earth-observation and weather craft now host AI chips that filter out cloud-covered imagery in orbit, cutting downlink bandwidth and enabling hourly revisits for agriculture, insurance, and carbon-tracking customers.
Mapping and navigation payloads benefit from GNSS modernization as operators introduce authenticated signals and regional augmentation services for autonomous vehicles. Intelligence, surveillance, and reconnaissance fleets grow through low-cost optical constellations delivering sub-meter resolution, enhancing maritime domain awareness, and border security. Scientific missions add another layer of momentum as space-weather monitors and particle-physics instruments piggyback on rideshare campaigns, doubling the satellite payload market value tied to research tasks by 2031. Direct-to-device project combines cellular and satellite waveforms in a single modem, rounding out demand by opening fresh consumer markets for rugged phones, wearables, and IoT trackers.
Geography Analysis
North American operators invested heavily in proliferated LEO architectures during 2024 and 2025, channeling record defense allocations toward communication, ISR, and early-warning missions. Robust private capital supplements public outlays, allowing rapid constellation refresh cycles and stimulating regional demand for software-defined payloads with advanced digital processors. The satellite payload market size attributable to North America is anticipated to reach USD 11.24 billion by 2031, retaining leadership through continuous technology insertion and strong supply-chain depth.
Asia-Pacific’s acceleration stems from national champions and a growing venture ecosystem willing to fund broadband, imaging, and lunar-pathfinder projects. China’s GuoWang and GalaxySpace programs target direct-to-device services, while India’s commercial-friendly reforms open launch pads and clean-room capacity to private firms. Government-backed insurance pools partly offset debris-related risk, hastening new-entrant participation. The region’s share of the satellite payload market could climb from 21.18% in 2025 to nearly 27.34% by 2031 if launch cadence holds.
Europe benefits from ESA-funded programs such as the small-GEO initiative and next-generation Galileo satellites incorporating all-digital payload chains. Regulatory leadership on sustainability and orbital-debris mitigation shapes operator behavior, encouraging designs with autonomous collision-avoidance and rapid de-orbit devices. Although manufacturing costs remain structurally higher, the continent differentiates in terms of technical sophistication and sovereign-secure solutions demanded by defense ministries.

Competitive Landscape
The satellite payload market shows moderate concentration. Incumbent prime contractors still dominate deep-space and high-power geostationary missions, yet new entrants capture share in mass-produced LEO constellations. SES’s USD 3.1 billion takeover of Intelsat creates scale efficiencies in fixed-satellite-service capacity allocation. At the same time, MDA Space’s USD 193 million acquisition of SatixFy secures in-house chipsets and digital-beam-forming IP. Lockheed Martin’s purchase of Terran Orbital complements small-sat bus manufacturing, reflecting strategic moves to balance heritage GEO portfolios with volume LEO production.
Technology rivalry centers on software-defined payloads that enable on-orbit upgrades through firmware alone. Airbus, Thales, and OHB each have digital-payload product lines capable of real-time beam shaping and frequency retuning. Edge-AI partnerships, such as Beyond Gravity’s collaboration with Stream Analyze, promise autonomous anomaly detection and data triage inside the spacecraft. Meanwhile, Astroscale positions for USD 450 million in debris-removal and life-extension service revenue by 2030, adding an after-market services tier that diversifies away from pure hardware margins.
Competitive intensity will likely escalate as scalable LEO manufacturers refine automated production lines, compressing lead times and squeezing mid-tier suppliers. Firms combining vertical integration, reconfigurable payload know-how, and sovereign security clearances are poised to secure long-term framework deals with commercial operators and defense agencies.
Satellite Payload Industry Leaders
Airbus SE
Lockheed Martin Corporation
Thales Group
Northrop Grumman Corporation
The Boeing Company
- *Disclaimer: Major Players sorted in no particular order

Recent Industry Developments
- May 2025: Space Force awarded 12 companies a 10-year, USD 232 million contract under the Space Test Experiments Platform 2.0 initiative to develop satellites and spacecraft. Companies will compete for orders to build platforms, integrate emerging technologies, and provide services like payload integration, launch, on-orbit support, and anomaly detection, fostering technological advancements.
- March 2025: SatixFy won UK government funding to accelerate on-orbit payload reconfiguration technology.


Global Satellite Payload Market Report Scope
A payload is a scientific or technological instrument carried on board a satellite for specific applications. Payloads vary as per the size, purpose, capabilities, composition, etc. The satellite includes the payload and the bus. A satellite bus is used to carry payloads and subsystems. The satellite payloads are developed to perform specific functions such as imaging, communications, and navigation in orbit. It includes various equipment such as repeaters, transponders, antennas, cameras, spectrometers, and among others.
The satellite payload market is segmented by payload type, orbit, end-use, application, and geography. By payload type, the market is segmented into communication, navigation, imaging, and others. By orbit, the market is classified into GEO, MEO, and LEO. By end-use, the market is divided into commercial and military. By application, the market is segmented into weather monitoring, telecommunication, surveillance, scientific research, and others. By geography, the market is segmented into North America, Europe, Asia Pacific, Latin America, and Middle East and Africa.
The market sizing and forecasts have been provided in value (USD).
| Communication |
| Navigation |
| Imaging |
| Scientific and Research |
| Software-defined Payload |
| Radar |
| Low Earth Orbit (LEO) |
| Medium Earth Orbit (MEO) |
| Geostationary Orbit (GEO) |
| Commercial |
| Government and Defense |
| Dual Use |
| Communication |
| Earth Observation/Weather Monitoring |
| Mapping and Navigation |
| Intelligence, Surveillance, and Reconnaissance (ISR) |
| Scientific Research and Exploration |
| Others (IoT, Asset Tracking, etc.) |
| North America | United States | |
| Canada | ||
| Mexico | ||
| Europe | Germany | |
| United Kingdom | ||
| France | ||
| Russia | ||
| Rest of Europe | ||
| Asia-Pacific | China | |
| Japan | ||
| India | ||
| Australia | ||
| Rest of Asia-Pacific | ||
| South America | Brazil | |
| Rest of South America | ||
| Middle East and Africa | Middle East | United Arab Emirates |
| Saudi Arabia | ||
| Rest of Middle East | ||
| Africa | South Africa | |
| Rest of Africa | ||
| By Payload Type | Communication | ||
| Navigation | |||
| Imaging | |||
| Scientific and Research | |||
| Software-defined Payload | |||
| Radar | |||
| By Orbit | Low Earth Orbit (LEO) | ||
| Medium Earth Orbit (MEO) | |||
| Geostationary Orbit (GEO) | |||
| By End-Use | Commercial | ||
| Government and Defense | |||
| Dual Use | |||
| By Application | Communication | ||
| Earth Observation/Weather Monitoring | |||
| Mapping and Navigation | |||
| Intelligence, Surveillance, and Reconnaissance (ISR) | |||
| Scientific Research and Exploration | |||
| Others (IoT, Asset Tracking, etc.) | |||
| By Geography | North America | United States | |
| Canada | |||
| Mexico | |||
| Europe | Germany | ||
| United Kingdom | |||
| France | |||
| Russia | |||
| Rest of Europe | |||
| Asia-Pacific | China | ||
| Japan | |||
| India | |||
| Australia | |||
| Rest of Asia-Pacific | |||
| South America | Brazil | ||
| Rest of South America | |||
| Middle East and Africa | Middle East | United Arab Emirates | |
| Saudi Arabia | |||
| Rest of Middle East | |||
| Africa | South Africa | ||
| Rest of Africa | |||


Key Questions Answered in the Report
What is the satellite payload market’s growth trajectory through 2031?
The market stands at USD 12.79 billion in 2026 and is forecasted to climb to USD 27.23 billion by 2031, reflecting a 16.31% CAGR.
Which payload type is expanding the fastest?
Software-defined payloads post the highest 21.92% CAGR because on-orbit reconfiguration reduces lifetime upgrade costs and supports dynamic beam-forming.
Why are Low-Earth-orbit (LEO) constellations overtaking other orbits?
LEO systems already carry 62.10% of shipped payloads and grow at an 18.70% CAGR thanks to 30-70 ms latency, mass-production economics, and direct-to-device connectivity.
How do defense budgets influence payload demand?
Rising military space allocations, led by the US Space Force and allied programs, drive dual-use procurements and fund resilient, distributed architectures that require more payloads.
What regulatory or technical hurdles could slow market growth
Spectrum congestion, stricter five-year de-orbit mandates, and escalating R&D costs for advanced digital processors add schedule risk and boost program expenses.
Which regions will add the most incremental revenue by 2031?
Asia-Pacific delivers the fastest 19.45% CAGR on the back of Chinese and Indian launch activity, while North America retains the largest absolute share through sustained defense spending.
Page last updated on:


