Satellite Manufacturing Market Size and Share
Market Overview
| Study Period | 2017 - 2030 |
|---|---|
| Forecast Data Period | 2025 - 2030 |
| Historical Data Period | 2017 - 2023 |
| Market Size (2025) | USD 272.6 Billion |
| Market Size (2030) | USD 417.7 Billion |
| Growth Rate (2025 - 2030) | 8.91% CAGR |
| Market Concentration | High |
Major Players*Disclaimer: Major Players sorted in no particular order Image © Mordor Intelligence. Reuse requires attribution under CC BY 4.0. | |

Satellite Manufacturing Market Analysis by Mordor Intelligence
The Satellite Manufacturing Market size is estimated at 272.6 billion USD in 2025, and is expected to reach 417.7 billion USD by 2030, growing at a CAGR of 8.91% during the forecast period (2025-2030).
The satellite manufacturing industry is experiencing a transformative shift driven by technological advancements and increasing commercial space activities. Major manufacturers are adopting advanced satellite manufacturing processes, incorporating sophisticated electronics, and implementing innovative satellite technology solutions to enhance satellite capabilities and reliability. The industry's evolution is particularly evident in satellite production capabilities, with leading companies like SpaceX demonstrating remarkable efficiency by manufacturing approximately 120 satellites per month as of 2022. This rapid production capability has fundamentally altered the industry's dynamics, enabling faster constellation deployment and more accessible space services.
The industry is witnessing a significant trend toward orbit diversification and specialized applications. Recent data indicates that satellites are being strategically positioned across different orbital planes, with over 4,025 satellites operating in Low Earth Orbit (LEO), while 133 satellites operate in Geostationary Orbit (GEO), primarily serving communication and earth observation purposes. This distribution reflects the industry's response to varying market demands and technological requirements, with each orbital plane offering unique advantages for specific applications such as global communications, earth observation, and navigation services.
Commercial space activities have become increasingly prominent, marked by substantial investments and innovative business models. The satellite industry has seen a surge in private sector participation, with companies focusing on developing specialized satellite manufacturing capabilities and advanced satellite technology. This trend is exemplified by recent developments such as the March 2023 launch of 40 OneWeb satellites by SpaceX and ISRO's deployment of 36 satellites, demonstrating the growing collaboration between established space agencies and commercial entities. These partnerships are reshaping the industry's competitive landscape and accelerating technological innovation.
The market is characterized by strategic alliances and technological partnerships aimed at enhancing manufacturing capabilities and expanding service offerings. Companies are investing in advanced production facilities and developing new satellite platforms to address evolving market requirements. For instance, in April 2023, the successful launch of DEWA SAT-2, an experimental Earth observation satellite, showcases the industry's focus on developing specialized satellites for specific applications. This trend toward application-specific satellite development is driving innovation in spacecraft manufacturing processes and creating new market opportunities across various sectors, from telecommunications to earth observation.
Global Satellite Manufacturing Market Trends and Insights
Cost-effectiveness and increased viability of small satellites leading to rise of satellite miniaturization
- The ability of a small satellite to perform nearly all of the functions of a traditional satellite at a fraction of the cost of a traditional satellite has increased the viability of building, launching, and operating small satellite constellations. The demand in North America is primarily driven by the United States, which manufactures the largest number of small satellites annually. In North America, during 2017-2022, 580 nanosatellites were placed into orbit by various players in the region. Currently, NASA is involved in several projects aimed at developing these satellites.
- The demand in Europe is primarily driven by Germany, France, Russia, and the United Kingdom, which manufacture the largest number of small satellites annually. During 2017-2022, more than 50 nano and microsatellites were placed into orbit by various players in the region. The miniaturization and commercialization of electronic components and systems have driven market participation, resulting in the emergence of new market players who aim to capitalize on and enhance the current market scenario. For instance, Open Cosmos, a UK-based startup, partnered with ESA to provide commercial nanosatellite launch services to end users while ensuring competitive cost-savings of around 90%.
- The demand in Asia-Pacific is primarily driven by China, Japan, and India, which manufacture the largest number of small satellites annually. During 2017-2022, more than 190 nano and microsatellites were placed into orbit by various players in the region. China is investing significant resources toward augmenting its space-based capabilities. The country has launched the most significant number of nano and microsatellites in Asia-Pacific to date.
,-Number-of-Launches,-Global,-2017---2022.svg)


Increased spending and rising investment opportunities are the major factors aiding the growth of satellite manufacturing
- In North America, global government expenditure for space programs hit a record of approximately USD 103 billion in 2021. The region is the epicenter of space innovation and research, with the presence of the world’s biggest space agency, NASA. In 2022, the US government spent nearly USD 62 billion on its space programs, making it the highest spender on space in the world. In the United States, federal agencies receive annual funding from Congress worth USD 32.33 billion for their subsidiaries.
- Additionally, European countries are recognizing the importance of various investments in the space domain and are increasing their spending on space activities and innovation to stay competitive and innovative in the global space industry. For instance, in November 2022, ESA announced that it had proposed a 25% boost in space funding over the next three years designed to maintain Europe’s lead in Earth observation, expand navigation services, and remain a partner in exploration with the United States. The European Space Agency (ESA) asked its 22 nations to back a budget of around EUR 18.5 billion for 2023-2025. Germany, France, and Italy are the major contributors.
- Considering the increase in space-related activities in the Asia-Pacific region, in 2022, according to the draft budget of Japan, the space budget of the country was over USD 1.4 billion, which included the development of the H3 rocket, Engineering Test Satellite-9, and the nation’s Information Gathering Satellite (IGS) program. Similarly, the proposed budget for India’s space programs for FY 2022 was USD 1.83 billion. In 2022, South Korea’s Ministry of Science and ICT announced a space budget of USD 619 million for manufacturing satellites, rockets, and other key space equipment.

OTHER KEY INDUSTRY TRENDS COVERED IN THE REPORT
- Nano and minisatellites are poised to create the demand in the market
Segment Analysis: Application
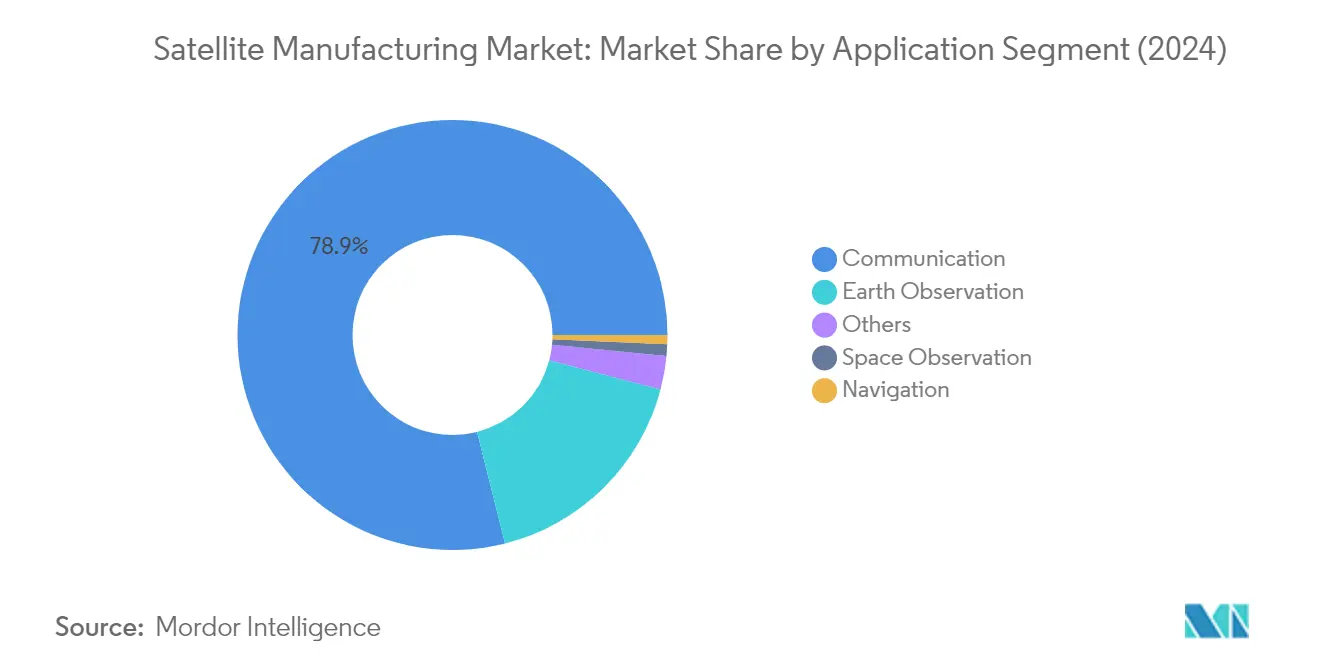
Communication Segment in Satellite Manufacturing Market
The communication segment dominates the global satellite manufacturing market, commanding approximately 79% of the market share in 2024. This significant market position is driven by the increasing demand for uninterrupted connectivity across various regions worldwide. Communication satellites serve multiple critical applications, including weather forecasting, media, entertainment, aviation, television, internet, space, and telecommunications. The segment's dominance is particularly notable in military operations, where secure bandwidth capacity is essential for operations conducted with inadequate and unreliable communication infrastructure. The growing demand for motion communication solutions across military vehicles, utility vehicles, ships, and trains further strengthens this segment's market leadership. Major government organizations have been actively investing in satellite communication capabilities, as evidenced by the US Air Force's recent contract with L3Harris Technologies worth USD 81 million for new multi-orbit, multi-waveform satellite communications capability.

Space Observation Segment in Satellite Manufacturing Market
The space observation segment is emerging as the fastest-growing segment in the satellite manufacturing market, with a projected CAGR of approximately 19% during 2024-2029. This remarkable growth is driven by the increasing need for studying planets, asteroids, comets, and other celestial bodies in the solar system. Space observation satellites are becoming increasingly crucial for collecting data for research and exploration, including monitoring climate change, observing galaxies and stars, and mapping the surface of other planets. The segment's growth is further accelerated by various space exploration missions and international collaborations. The European Space Agency's recent initiatives, including the Juice mission for detailed observations of Jupiter and its moons, demonstrate the growing investment in space observation capabilities. Additionally, countries in the Asia-Pacific region, particularly China and India, are actively exploring various possibilities to enhance their space observation capabilities through satellite launches.
Remaining Segments in Application Segmentation
The earth observation, navigation, and other segments complete the satellite manufacturing market's application landscape. Earth observation satellites play a crucial role in monitoring environmental changes, urban development, and disaster management. The navigation segment, while smaller in market share, remains vital for global positioning systems and military applications, providing essential services for both civilian and defense purposes. The remaining applications, including education, mission extension, and technology demonstration, contribute to the market's diversity by serving specialized needs across different sectors. These segments collectively enhance the market's capability to serve a wide range of end-users, from commercial enterprises to government agencies, supporting various scientific and technological advancements in space exploration and Earth monitoring capabilities.
Segment Analysis: Satellite Mass
100-500kg Segment in Satellite Manufacturing Market
The 100-500kg segment, classified as minisatellites, dominates the global satellite manufacturing market with approximately 65% market share in 2024. These satellites compete effectively with larger satellites across multiple applications while incorporating miniaturized but redundant electronics. The segment's prominence is driven by its versatility in collecting data for agriculture, mineral exploration, urban development, border and maritime security, forestry, ocean resources, and disaster management applications. Most minisatellites carry propulsion systems for orbit correction, which extends their service life and enhances their operational capabilities. The strong adoption by both commercial and military sectors has established this segment as the cornerstone of the satellite manufacturing industry.
Below 10kg Segment in Satellite Manufacturing Market
The Below 10kg segment, commonly referred to as nanosatellites, is projected to experience the fastest growth rate of approximately 13% during 2024-2029. This remarkable growth is primarily driven by advancements in miniaturization and reduced manufacturing costs. The segment's expansion is further fueled by the increasing adoption of nanosatellites in Earth observation, communication, and remote sensing markets. These satellites are particularly attractive for constellation deployments, offering greater coverage and faster deployment capabilities. The rapid growth of the Internet of Things (IoT) is expected to accelerate the adoption of nanosatellites, as they provide cost-effective solutions for global connectivity and data collection applications.
Remaining Segments in Satellite Mass
The other segments in the satellite manufacturing market include the 10-100kg (microsatellites), 500-1000kg (medium satellites), and above 1000kg (large satellites) categories. The microsatellite segment offers flexibility and cost-effectiveness for medium-duration missions, while the 500-1000kg segment serves specialized communication and surveillance applications. Large satellites above 1000kg continue to play a crucial role in complex military and commercial missions requiring extensive payload capacity and longer operational lifespans. Each segment addresses specific market needs, from specialized military applications to commercial broadcasting and deep space exploration, contributing to the overall diversity and robustness of the satellite manufacturing ecosystem.
Segment Analysis: Orbit Class
LEO Segment in Satellite Manufacturing Market
Low Earth Orbit (LEO) dominates the satellite manufacturing market, accounting for approximately 73% of the total market value in 2024. This significant market share is driven by the increasing adoption of LEO satellites for modern communication technologies and Earth observation applications. LEO satellites are particularly favored due to their proximity to Earth, which enables better signal quality and lower latency for communications. During 2023-2024, major satellite operators have focused on deploying large constellations in LEO for various applications, including communications, military reconnaissance, espionage, and imaging applications. The segment's growth is further supported by the advantages of L-band radio frequencies in LEO platforms, which are less susceptible to interference from weather conditions and atmospheric effects, making them ideal for communication systems.
MEO Segment in Satellite Manufacturing Market
The Medium Earth Orbit (MEO) segment is experiencing the fastest growth in the satellite manufacturing market, with a projected growth rate of approximately 12% from 2024 to 2029. This remarkable growth is attributed to the increasing adoption of MEO satellites for global navigation systems and satellite-based communication systems. The segment's expansion is driven by its strategic advantages in providing enhanced signal strength, improved communications and data transfer capabilities, and greater coverage area compared to other orbits. The military sector's growing utilization of MEO satellites has been particularly notable, especially for applications requiring increased signal strength and enhanced communications capabilities. Recent developments in MEO satellite technology, including advancements in payload systems and orbital positioning, are expected to further accelerate the segment's growth during the forecast period.
Remaining Segments in Orbit Class
The Geostationary Earth Orbit (GEO) segment continues to play a crucial role in the satellite manufacturing market, particularly for applications requiring consistent coverage over specific geographical areas. GEO satellites are essential for weather monitoring, television broadcasting, and long-range communications due to their fixed position relative to Earth. These satellites are particularly valuable for applications requiring continuous coverage of specific regions, such as weather forecasting and direct-to-home television services. The GEO segment maintains its significance in the market despite slower growth compared to LEO and MEO segments, primarily due to its unique capabilities in providing constant coverage and stable communication links for specific geographical regions.
Segment Analysis: End User
Commercial Segment in Satellite Manufacturing Market
The commercial segment dominates the global satellite manufacturing market, holding approximately 68% market share in 2024. This significant market position is primarily driven by the increasing demand for satellite-based services across various industries. The surge in commercial satellite deployments is largely attributed to the growing need for global broadband connectivity, Earth observation services, and communication networks. Major commercial satellite operators and technology companies are actively expanding their satellite constellations to provide enhanced coverage and services. The segment's growth is further supported by advancements in satellite technology, reduced manufacturing costs, and increasing private sector investments in space infrastructure. Commercial satellites are increasingly being utilized for applications ranging from telecommunications and broadcasting to remote sensing and navigation services, making them indispensable for modern business operations.
Military & Government Segment in Satellite Manufacturing Market
The military and government segment is experiencing robust growth in the satellite manufacturing market, with a projected growth rate of approximately 11% during 2024-2029. This accelerated growth is driven by increasing defense budgets worldwide and the growing importance of space-based assets in modern military operations. The segment is witnessing substantial investments in advanced satellite technologies for surveillance, reconnaissance, and secure communications. Military organizations are particularly focusing on developing sophisticated satellite systems with enhanced capabilities in areas such as electronic warfare, space situational awareness, and tactical communications. The integration of satellite systems with modern military C4ISR capabilities and the increasing adoption of space-based architectures for defense operations are further propelling the segment's growth. Additionally, government agencies are investing in new satellite programs to support various civilian applications, including weather monitoring, disaster management, and scientific research.
Remaining Segments in End User Segmentation
The remaining segment in the satellite manufacturing market primarily consists of research institutions, educational organizations, and non-governmental entities. This segment plays a crucial role in advancing satellite technology through various research and development initiatives. Educational institutions are increasingly participating in satellite development programs, contributing to technological innovation and workforce development in the space sector. These organizations often focus on developing experimental satellites and conducting space-related research, which helps in testing new technologies and methodologies. The segment also includes various non-profit organizations that utilize satellites for environmental monitoring, humanitarian purposes, and scientific research, contributing to the overall advancement of satellite technology and its applications.
Segment Analysis: Satellite Subsystem
Propulsion Hardware and Propellant Segment in Satellite Manufacturing Market
The propulsion hardware and propellant segment dominates the satellite manufacturing market, commanding approximately 79% of the total market share in 2024. This significant market position is driven by the increasing demand for satellite propulsion systems across various applications. The segment's growth is primarily attributed to the surge in satellite constellation deployments and the need for sophisticated propulsion systems that enable precise orbital maneuvers and station-keeping capabilities. Major organizations across the world have been actively developing advanced propulsion technologies, with a particular focus on improving efficiency and reducing environmental impact. The integration of innovative propulsion solutions, including green propellants and electric propulsion systems, has further strengthened this segment's market position. Additionally, the rising investments in space exploration missions and the growing emphasis on extending satellite operational lifespans have contributed to the sustained demand for propulsion hardware and propellants.
Satellite Bus & Subsystems Segment in Satellite Manufacturing Market
The satellite bus and subsystems segment is experiencing remarkable growth, projected to expand at approximately 18% CAGR from 2024 to 2029. This exceptional growth trajectory is driven by several factors, including the increasing demand for miniaturized satellite platforms and the integration of advanced technologies in satellite bus designs. The segment is witnessing significant technological advancements, particularly in areas such as modular designs, standardized interfaces, and improved power management systems. The trend toward satellite miniaturization has led to the development of more efficient and cost-effective bus platforms, making satellite deployment more accessible to a broader range of customers. Furthermore, the increasing focus on creating space constellations has spurred innovation in satellite bus technologies, with manufacturers developing platforms that can support multiple payload configurations and mission requirements. The adoption of advanced processing capabilities and the integration of artificial intelligence in satellite bus systems have also contributed to the segment's robust growth outlook.
Remaining Segments in Satellite Subsystem Market
The solar array & power hardware and structures, harness & mechanisms segments play crucial roles in the overall satellite manufacturing ecosystem. The solar array & power hardware segment focuses on developing increasingly efficient power generation and storage solutions, incorporating advanced solar cell technologies and innovative deployment mechanisms. This segment is particularly vital for ensuring sustained satellite operations in space, with manufacturers continuously working on improving power density and reliability. Meanwhile, the structures, harness & mechanisms segment encompasses the physical framework and mechanical systems that ensure satellite integrity and functionality. This segment has seen significant advancements in materials technology, with a focus on developing lighter, stronger, and more durable components. Both segments are experiencing technological evolution driven by the industry's push toward more efficient, reliable, and cost-effective satellite solutions.
Segment Analysis: Propulsion Tech
Liquid Fuel Segment in Satellite Manufacturing Market
Liquid fuel-based propulsion technology dominates the satellite manufacturing market, accounting for approximately 73% of the total market share in 2024. This dominance is primarily attributed to its high efficiency, controllability, reliability, and long lifespan, making it an ideal choice for various space missions. The technology can be effectively utilized across different orbit classes for satellites, including geostationary orbit, low Earth orbit, polar orbit, and sun-synchronous orbit. Major space agencies and private companies continue to prefer liquid fuel propulsion systems for their satellite missions due to their proven track record and superior performance characteristics. The technology's ability to provide precise thrust control and multiple restart capabilities makes it particularly valuable for complex orbital maneuvers and station-keeping operations. Additionally, ongoing advancements in liquid propulsion systems, including the development of more efficient and environmentally friendly propellants, continue to strengthen its market position.
Electric Propulsion Segment in Satellite Manufacturing Market
Electric propulsion technology is emerging as the fastest-growing major segment in the satellite manufacturing market, with a projected growth rate of approximately 12% from 2024 to 2029. This growth is driven by increasing demand for more efficient and sustainable propulsion solutions in the space industry. Electric propulsion systems offer significant advantages in terms of fuel efficiency and operational flexibility, particularly for long-duration missions and complex orbital maneuvers. The technology's ability to provide continuous low-thrust operations makes it ideal for maintaining precise satellite positions and executing complex trajectory changes. The surge in adoption of miniaturized electronics and smart manufacturing materials has led to the development of small satellites with shorter development cycles, further driving the demand for compatible electric propulsion systems. Major organizations across the world are increasingly investing in research and development of advanced electric propulsion technologies, focusing on improving thrust efficiency and reducing system complexity.
Remaining Segments in Propulsion Tech
Gas-based propulsion technology represents another important segment in the satellite manufacturing market, offering unique advantages for specific mission profiles. This technology is particularly valuable for small satellites and CubeSats, where traditional liquid fuel systems might be impractical. Cold gas thrusters, a key component of gas-based propulsion systems, are becoming increasingly popular in nanosatellites and CubeSats due to their simplicity, reliability, and ability to operate without complex heat management systems. The technology's straightforward design and operation make it an attractive option for satellite manufacturers looking to minimize complexity while maintaining adequate propulsion capabilities. The segment continues to evolve with new innovations in gas storage, distribution systems, and thrust control mechanisms, contributing to the overall diversity and flexibility of satellite propulsion solutions.
Satellite Manufacturing Market Geography Segment Analysis
Satellite Manufacturing Market in Asia-Pacific
The Asia-Pacific satellite manufacturing market has emerged as a significant player in the global space industry, with countries like China, India, Japan, and South Korea leading technological advancements. The region has demonstrated strong capabilities in developing and launching satellites for various applications, including Earth observation, communication, and scientific research. Countries in this region have been actively investing in space programs and satellite technology development, with a particular focus on miniaturization and cost-effective solutions. The presence of established space agencies like ISRO, JAXA, and the Chinese Space Agency has further strengthened the region's position in the global satellite manufacturing industry.
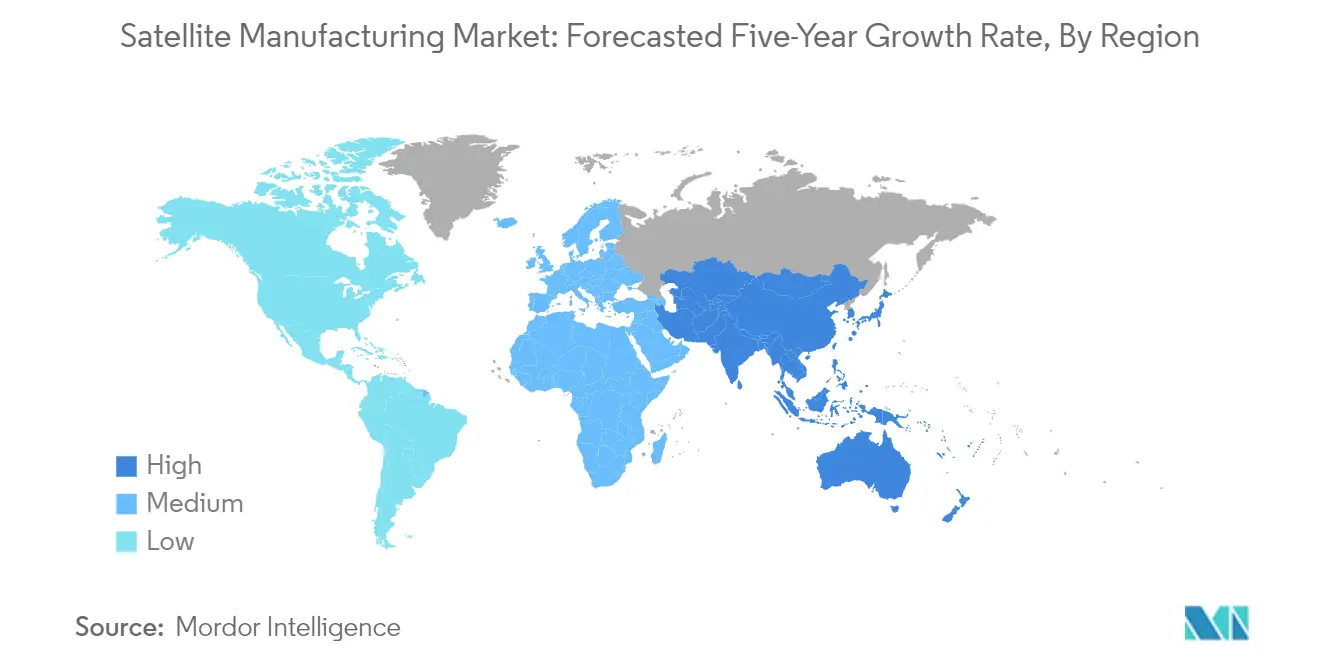
Satellite Manufacturing Market in China
China has established itself as the dominant force in the Asia-Pacific satellite manufacturing sector, holding approximately 23% market share in 2024. The Chinese government's substantial investments in satellite systems for communication, broadcasting, navigation, weather forecasting, and disaster monitoring have been instrumental in this growth. The China Aerospace Science and Technology Corporation (CASC) serves as the country's primary state-owned enterprise responsible for satellite research, development, and production. The country has demonstrated significant capabilities in manufacturing various types of satellites, from small CubeSats to large communication satellites, supported by a robust supply chain and advanced manufacturing facilities.
Satellite Manufacturing Market in India
India has emerged as the fastest-growing market in the Asia-Pacific region, with a projected growth rate of approximately 27% from 2024 to 2029. The country's satellite manufacturing capabilities have been significantly enhanced through the Indian Space Research Organisation (ISRO)'s continued efforts in indigenous satellite development. India has made remarkable progress in developing cost-effective satellite solutions, particularly in Earth observation and communication satellites. The country's focus on self-reliance in satellite technology, coupled with increasing private sector participation and supportive government policies, has created a favorable environment for satellite manufacturing growth.
Satellite Manufacturing Market in Europe
The European satellite manufacturing industry has maintained its position as a key player in the global space industry, characterized by strong technological capabilities and innovative satellite solutions. The region benefits from collaborative efforts between various space agencies, research institutions, and private companies across different countries. The European space industry has particularly excelled in developing advanced satellite technologies for Earth observation, telecommunications, and scientific missions, supported by strong research and development infrastructure.
Satellite Manufacturing Market in Russia
Russia maintains its position as the largest satellite manufacturing market in Europe, commanding approximately 24% of the regional market share in 2024. The country's extensive experience in space technology and satellite manufacturing has been built upon decades of space exploration and satellite development programs. Russia's military and civilian space programs continue to drive innovation in satellite technology, particularly in areas such as navigation, communication, and Earth observation satellites. The country maintains a comprehensive satellite production infrastructure, supported by established institutions and a skilled workforce.
Satellite Manufacturing Market in Russia
Russia also leads the European region in terms of growth potential, with a projected growth rate of approximately 12% from 2024 to 2029. The country's focus on expanding its anti-access/area-denial capabilities in outer space, particularly in electronic warfare and communication systems, has been a key driver of this growth. Russian manufacturers have been particularly successful in developing specialized satellites for military and civilian applications, supported by continued investment in research and development. The country's emphasis on indigenous satellite manufacturing capabilities and technological sovereignty has created a strong foundation for sustained growth.
Satellite Manufacturing Market in North America
The North American satellite manufacturing market stands at the forefront of global space technology innovation, driven primarily by the United States and Canada. The region's market is characterized by the presence of major private companies and government organizations that continuously push the boundaries of satellite technology. The strong ecosystem of space technology companies, coupled with substantial government support and advanced research facilities, has enabled the region to maintain its leadership in satellite manufacturing innovation.
Satellite Manufacturing Market in United States
The United States dominates the North American satellite manufacturing landscape, accounting for approximately 68% of the regional market share in 2024. The country's satellite manufacturing capabilities are supported by a robust ecosystem of private companies, government agencies, and research institutions. The presence of major players like SpaceX, Boeing, and Lockheed Martin, combined with NASA's continued support for space technology development, has created a highly dynamic and innovative market environment. The US maintains its leadership through continuous investment in advanced manufacturing technologies and innovative satellite designs.
Satellite Manufacturing Market in Canada
Canada represents the fastest-growing market in North America, with a projected growth rate of approximately 6% from 2024 to 2029. The country has carved out a niche in specialized satellite components technologies, particularly in Earth observation and communications systems. Canadian manufacturers have demonstrated particular expertise in developing advanced satellite components and subsystems, supported by strong government backing and collaboration with international partners. The country's focus on developing innovative satellite solutions for Arctic communications and surveillance has created unique opportunities for growth in the satellite manufacturing sector.
Satellite Manufacturing Market in Rest of World
The Rest of World region, encompassing countries like Brazil, Iran, Saudi Arabia, and the United Arab Emirates, has shown increasing commitment to developing indigenous satellite manufacturing capabilities. These countries have been making significant investments in space infrastructure and technology development, aiming to reduce dependence on foreign satellite manufacturers. Iran leads the region in terms of growth potential, while Brazil has emerged as a significant player with its established space program and satellite manufacturing capabilities. The region has witnessed increased collaboration between countries and international partners, focusing on knowledge transfer and technological capacity building in satellite manufacturing.

Competitive Landscape
Top Companies in Satellite Manufacturing Market
The satellite manufacturing companies market is characterized by continuous product innovation and technological advancement across major players. Companies are heavily investing in developing next-generation satellite platforms, incorporating features like advanced digital payloads, all-electric propulsion systems, and 3D manufacturing capabilities. Operational agility is demonstrated through rapid satellite production capabilities and flexible manufacturing facilities that can accommodate various satellite sizes and configurations. Strategic moves in the industry primarily revolve around partnerships with government agencies, defense contractors, and commercial entities to secure long-term contracts and expand market presence. Companies are also focusing on geographical expansion through new manufacturing facilities, research and development centers, and integration facilities to strengthen their global footprint and better serve regional markets. The emphasis on developing reusable components and standardized platforms indicates a shift towards more cost-effective and sustainable manufacturing practices.
Consolidated Market with Strong Global Players
The satellite manufacturing market exhibits a highly consolidated structure dominated by established global conglomerates with extensive aerospace and defense capabilities. These major players leverage their comprehensive technological expertise, established manufacturing infrastructure, and long-standing relationships with government and commercial customers to maintain their market positions. The market is characterized by high entry barriers due to significant capital requirements, complex technological requirements, and stringent regulatory compliance needs. The presence of state-owned enterprises and government-backed companies, particularly in regions like China and Europe, adds another layer of complexity to the competitive landscape.
Merger and acquisition activities in the satellite manufacturing sector are primarily driven by the need to acquire new technologies, expand manufacturing capabilities, and enter new geographic markets. Companies are increasingly pursuing strategic acquisitions of smaller, specialized firms that possess innovative technologies or unique capabilities in areas such as small satellite manufacturing, propulsion systems, or satellite components. Vertical integration strategies are also evident as manufacturers seek to control key aspects of the supply chain and enhance their service offerings through acquisitions in related segments like ground systems and satellite operations.
Innovation and Adaptability Drive Future Success
Success in the satellite industry increasingly depends on companies' ability to adapt to evolving customer requirements and technological advancements. Incumbent manufacturers must focus on developing flexible manufacturing capabilities that can accommodate both traditional large satellites and newer small satellite configurations. Companies need to invest in research and development to maintain technological leadership, particularly in areas such as artificial intelligence, autonomous systems, and advanced materials. Building strong relationships with both government and commercial customers through reliable delivery, competitive pricing, and comprehensive after-sales support remains crucial for maintaining market share.
For new entrants and smaller players, success lies in identifying and exploiting specific market niches where they can offer unique value propositions. This includes developing specialized capabilities in areas such as small satellite manufacturing, specific subsystems, or particular applications like Earth observation or communications. Companies must also navigate complex regulatory environments across different regions while maintaining compliance with international space laws and export control regulations. The ability to form strategic partnerships with established players, government agencies, and research institutions can provide crucial access to markets, technologies, and funding sources. Additionally, developing cost-effective manufacturing processes and standardized platforms can help companies compete more effectively in an increasingly price-sensitive market.
Satellite Manufacturing Industry Leaders
Airbus SE
China Aerospace Science and Technology Corporation (CASC)
Lockheed Martin Corporation
Maxar Technologies Inc.
Space Exploration Technologies Corp.
- *Disclaimer: Major Players sorted in no particular order


Recent Industry Developments
- November 2023: Thales Alenia Space signed a contract with Inmarsat for the construction of Inmarsat-5 satellite. The satellite was launched aboard Ariane-5ECA
- June 2023: Thales Alenia Space built Inmarsat S-band / Hellas Sat 3 telecommunication satellite, has been launched from French Guyana and launched by Ariane 5 rocket. This condominium satellite for Inmarsat and Hellas Sat will provide Mobile Satellite Services (MSS), Fixed Satellite Services (FSS) and Broadcast Satellite Services (BSS).
- March 2023: AAC Clyde Space has won a USD2.3 million satellite subsystem order from a US development company for spacecraft and multi-mission systems.


Global Satellite Manufacturing Market Report Scope
Communication, Earth Observation, Navigation, Space Observation, Others are covered as segments by Application. 10-100kg, 100-500kg, 500-1000kg, Below 10 Kg, above 1000kg are covered as segments by Satellite Mass. GEO, LEO, MEO are covered as segments by Orbit Class. Commercial, Military & Government are covered as segments by End User. Propulsion Hardware and Propellant, Satellite Bus & Subsystems, Solar Array & Power Hardware, Structures, Harness & Mechanisms are covered as segments by Satellite Subsystem. Electric, Gas based, Liquid Fuel are covered as segments by Propulsion Tech. Asia-Pacific, Europe, North America are covered as segments by Region.| Communication |
| Earth Observation |
| Navigation |
| Space Observation |
| Others |
| 10-100kg |
| 100-500kg |
| 500-1000kg |
| Below 10 Kg |
| above 1000kg |
| GEO |
| LEO |
| MEO |
| Commercial |
| Military & Government |
| Other |
| Propulsion Hardware and Propellant |
| Satellite Bus & Subsystems |
| Solar Array & Power Hardware |
| Structures, Harness & Mechanisms |
| Electric |
| Gas based |
| Liquid Fuel |
| Asia-Pacific | By Country | Australia |
| China | ||
| India | ||
| Japan | ||
| New Zealand | ||
| Singapore | ||
| South Korea | ||
| Europe | By Country | France |
| Germany | ||
| Russia | ||
| United Kingdom | ||
| North America | By Country | Canada |
| United States | ||
| Rest of World | By Country | Brazil |
| Iran | ||
| Saudi Arabia | ||
| United Arab Emirates | ||
| Rest of World |
| Application | Communication | ||
| Earth Observation | |||
| Navigation | |||
| Space Observation | |||
| Others | |||
| Satellite Mass | 10-100kg | ||
| 100-500kg | |||
| 500-1000kg | |||
| Below 10 Kg | |||
| above 1000kg | |||
| Orbit Class | GEO | ||
| LEO | |||
| MEO | |||
| End User | Commercial | ||
| Military & Government | |||
| Other | |||
| Satellite Subsystem | Propulsion Hardware and Propellant | ||
| Satellite Bus & Subsystems | |||
| Solar Array & Power Hardware | |||
| Structures, Harness & Mechanisms | |||
| Propulsion Tech | Electric | ||
| Gas based | |||
| Liquid Fuel | |||
| Region | Asia-Pacific | By Country | Australia |
| China | |||
| India | |||
| Japan | |||
| New Zealand | |||
| Singapore | |||
| South Korea | |||
| Europe | By Country | France | |
| Germany | |||
| Russia | |||
| United Kingdom | |||
| North America | By Country | Canada | |
| United States | |||
| Rest of World | By Country | Brazil | |
| Iran | |||
| Saudi Arabia | |||
| United Arab Emirates | |||
| Rest of World | |||


Market Definition
- Application - Various applications or purposes of the satellites are classified into communication, earth observation, space observation, navigation, and others. The purposes listed are those self-reported by the satellite’s operator.
- End User - The primary users or end users of the satellite is described as civil (academic, amateur), commercial, government (meteorological, scientific, etc.), military. Satellites can be multi-use, for both commercial and military applications.
- Launch Vehicle MTOW - The launch vehicle MTOW (maximum take-off weight) means the maximum weight of the launch vehicle during take-off, including the weight of payload, equipment and fuel.
- Orbit Class - The satellite orbits are divided into three broad classes namely GEO, LEO, and MEO. Satellites in elliptical orbits have apogees and perigees that differ significantly from each other and categorized satellite orbits with eccentricity 0.14 and higher as elliptical.
- Propulsion tech - Under this segment, different types of satellite propulsion systems have been classified as electric, liquid-fuel and gas-based propulsion systems.
- Satellite Mass - Under this segment, different types of satellite propulsion systems have been classified as electric, liquid-fuel and gas-based propulsion systems.
- Satellite Subsystem - All the components and subsystems which includes propellants, buses, solar panels, other hardware of satellites are included under this segment.
| Keyword | Definition |
|---|---|
| Attitude Control | The orientation of the satellite relative to the Earth and the sun. |
| INTELSAT | The International Telecommunications Satellite Organization operates a network of satellites for international transmission. |
| Geostationary Earth Orbit (GEO) | Geostationary satellites in Earth orbit 35,786 km (22,282 mi) above the equator in the same direction and at the same speed as the earth rotates on its axis, making them appear fixed in the sky. |
| Low Earth Orbit (LEO) | Low Earth Orbit satellites orbit from 160-2000km above the earth, take approximately 1.5 hours for a full orbit and only cover a portion of the earth’s surface. |
| Medium Earth Orbit (MEO) | MEO satellites are located above LEO and below GEO satellites and typically travel in an elliptical orbit over the North and South Pole or in an equatorial orbit. |
| Very Small Aperture Terminal (VSAT) | Very Small Aperture Terminal is an antenna that is typically less than 3 meters in diameter |
| CubeSat | CubeSat is a class of miniature satellites based on a form factor consisting of 10 cm cubes. CubeSats weigh no more than 2 kg per unit and typically use commercially available components for their construction and electronics. |
| Small Satellite Launch Vehicles (SSLVs) | Small Satellite Launch Vehicle (SSLV) is a three-stage Launch Vehicle configured with three Solid Propulsion Stages and a liquid propulsion-based Velocity Trimming Module (VTM) as a terminal stage |
| Space Mining | Asteroid mining is the hypothesis of extracting material from asteroids and other asteroids, including near-Earth objects. |
| Nano Satellites | Nanosatellites are loosely defined as any satellite weighing less than 10 kilograms. |
| Automatic Identification System (AIS) | Automatic identification system (AIS) is an automatic tracking system used to identify and locate ships by exchanging electronic data with other nearby ships, AIS base stations, and satellites. Satellite AIS (S-AIS) is the term used to describe when a satellite is used to detect AIS signatures. |
| Reusable launch vehicles (RLVs) | Reusable launch vehicle (RLV) means a launch vehicle that is designed to return to Earth substantially intact and therefore may be launched more than one time or that contains vehicle stages that may be recovered by a launch operator for future use in the operation of a substantially similar launch vehicle. |
| Apogee | The point in an elliptical satellite orbit which is farthest from the surface of the earth. Geosynchronous satellites which maintain circular orbits around the earth are first launched into highly elliptical orbits with apogees of 22,237 miles. |


Research Methodology
Mordor Intelligence follows a four-step methodology in all our reports.
- Step-1: Identify Key Variables: In order to build a robust forecasting methodology, the variables and factors identified in Step-1 are tested against available historical market numbers. Through an iterative process, the variables required for market forecast are set and the model is built on the basis of these variables.
- Step-2: Build a Market Model: Market-size estimations for the historical and forecast years have been provided in revenue and volume terms. For sales conversion to volume, the average selling price (ASP) is kept constant throughout the forecast period for each country, and inflation is not a part of the pricing.
- Step-3: Validate and Finalize: In this important step, all market numbers, variables and analyst calls are validated through an extensive network of primary research experts from the market studied. The respondents are selected across levels and functions to generate a holistic picture of the market studied.
- Step-4: Research Outputs: Syndicated Reports, Custom Consulting Assignments, Databases & Subscription Platforms.


