Market Overview
| Study Period | 2019 - 2031 |
|---|---|
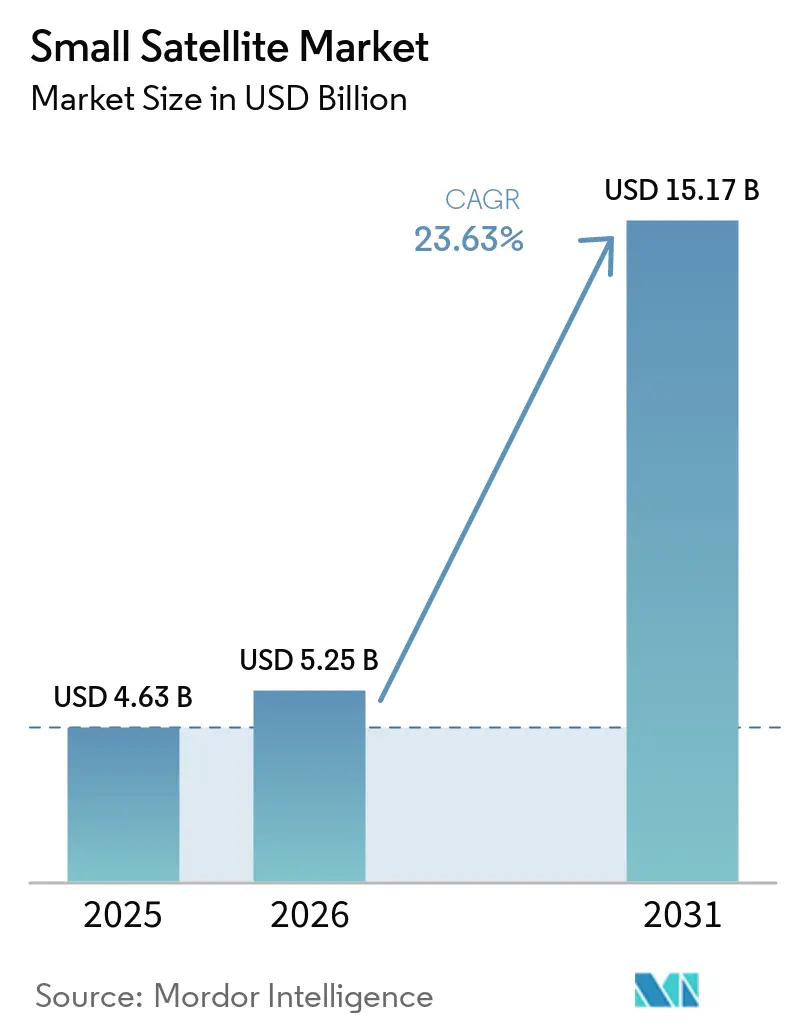
| Market Size (2026) | USD 5.25 Billion |
| Market Size (2031) | USD 15.17 Billion |
| Growth Rate (2026 - 2031) | 23.63% CAGR |
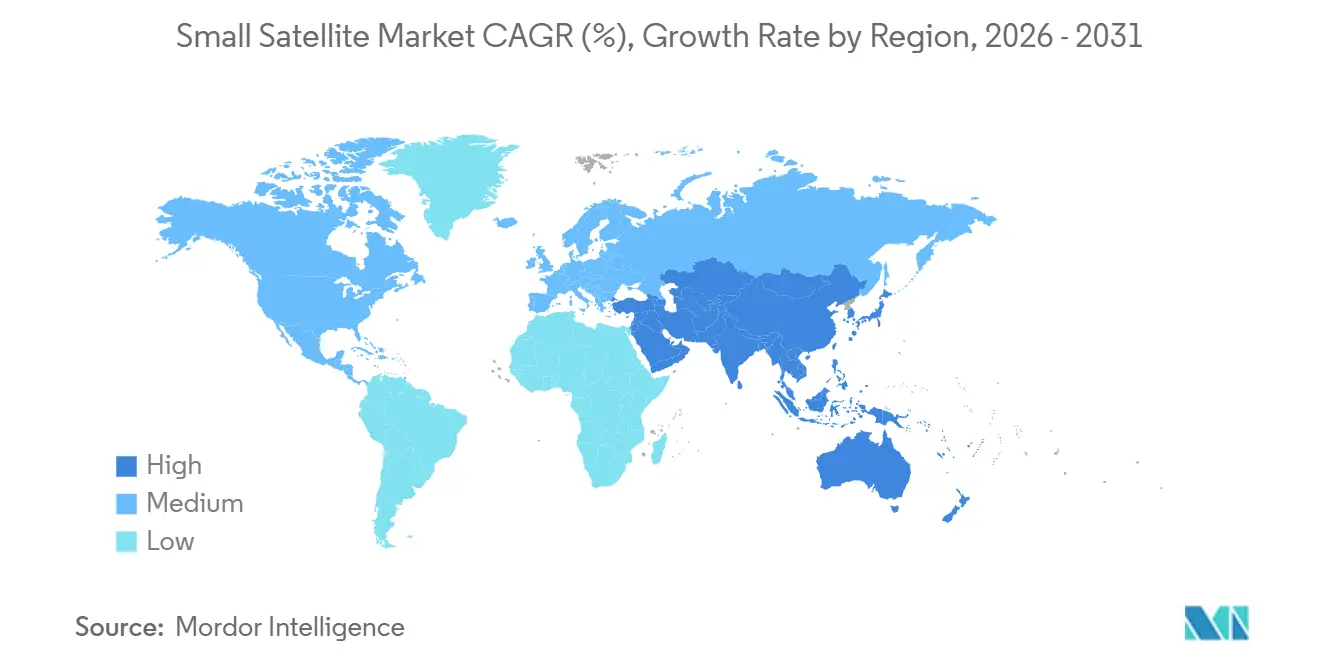
| Fastest Growing Market | Asia Pacific |
| Largest Market | North America |
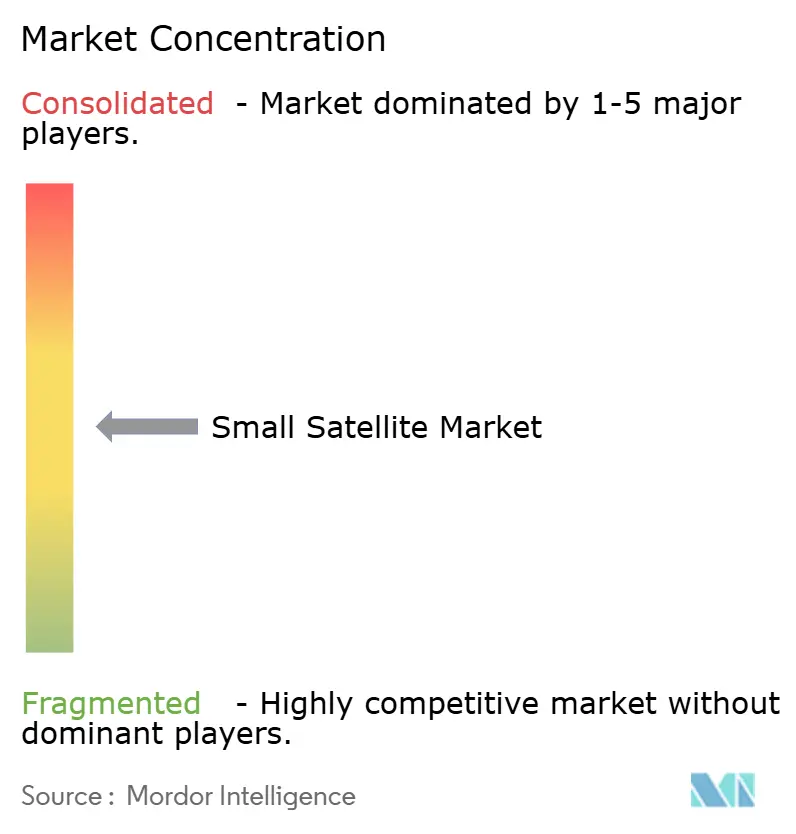
| Market Concentration | Medium |
Major Players *Disclaimer: Major Players sorted in no particular order Image © Mordor Intelligence. Reuse requires attribution under CC BY 4.0. | |
Small Satellite Market Analysis by Mordor Intelligence
The small satellite market size is expected to grow from USD 4.63 billion in 2025 to USD 5.25 billion in 2026 and is forecast to reach USD 15.17 billion by 2031 at a 23.63% CAGR over 2026-2031. Commercial operators are shifting from a few large geostationary craft to distributed LEO fleets that use numerous inexpensive nodes to achieve resilience. Reusable launch vehicles from SpaceX and Rocket Lab now let firms fly heavier or redundant payloads without incurring a mass penalty, widening design freedom. Venture-backed companies refresh hardware every 18 months, so technology enters orbit faster than traditional five-year cycles. Meanwhile, Earth-observation buyers in agriculture, insurance, and logistics want images several times a day rather than once a week, pushing up fleet counts. National security customers also favor proliferated constellations because dozens of nodes are harder to disrupt than a single exquisite satellite.
Key Report Takeaways
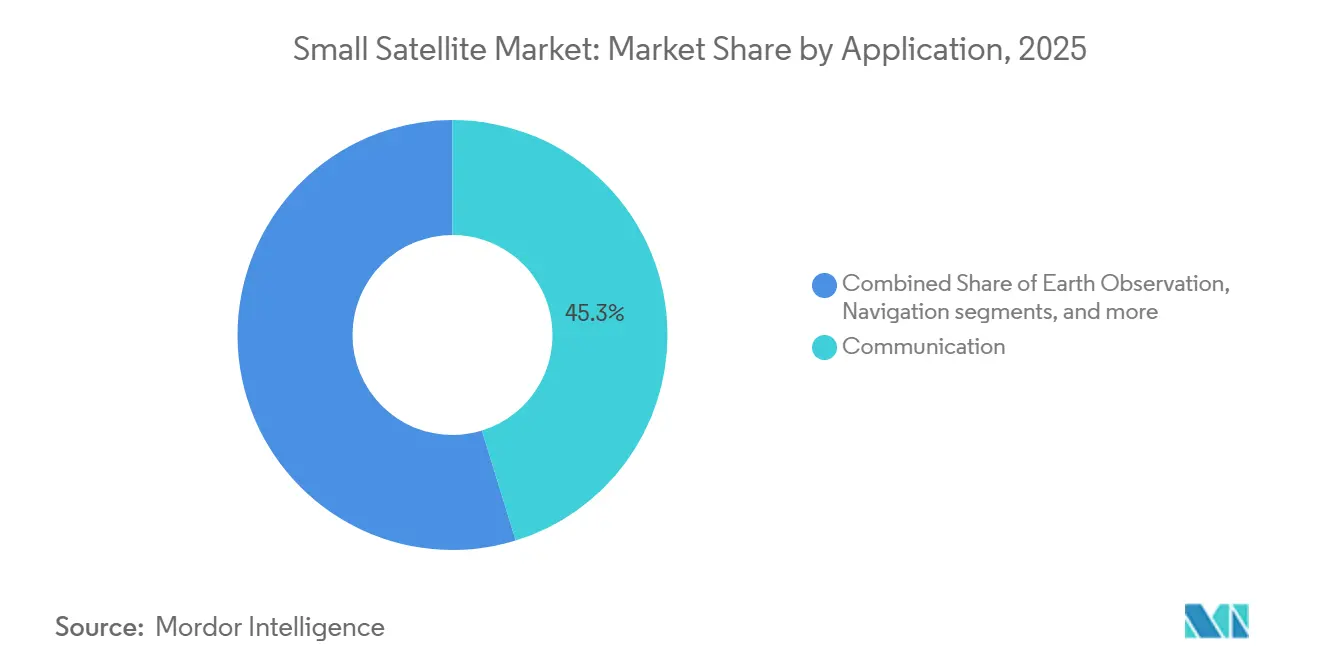
- By application, communication led with 45.25% of the small satellite market share in 2025, while Earth observation is forecasted to grow at a 24.71% CAGR through 2031.
- By orbit, LEO held 42.75% of the small satellite market size in 2025, and MEO is forecasted to expand at a 24.83% CAGR through 2031.
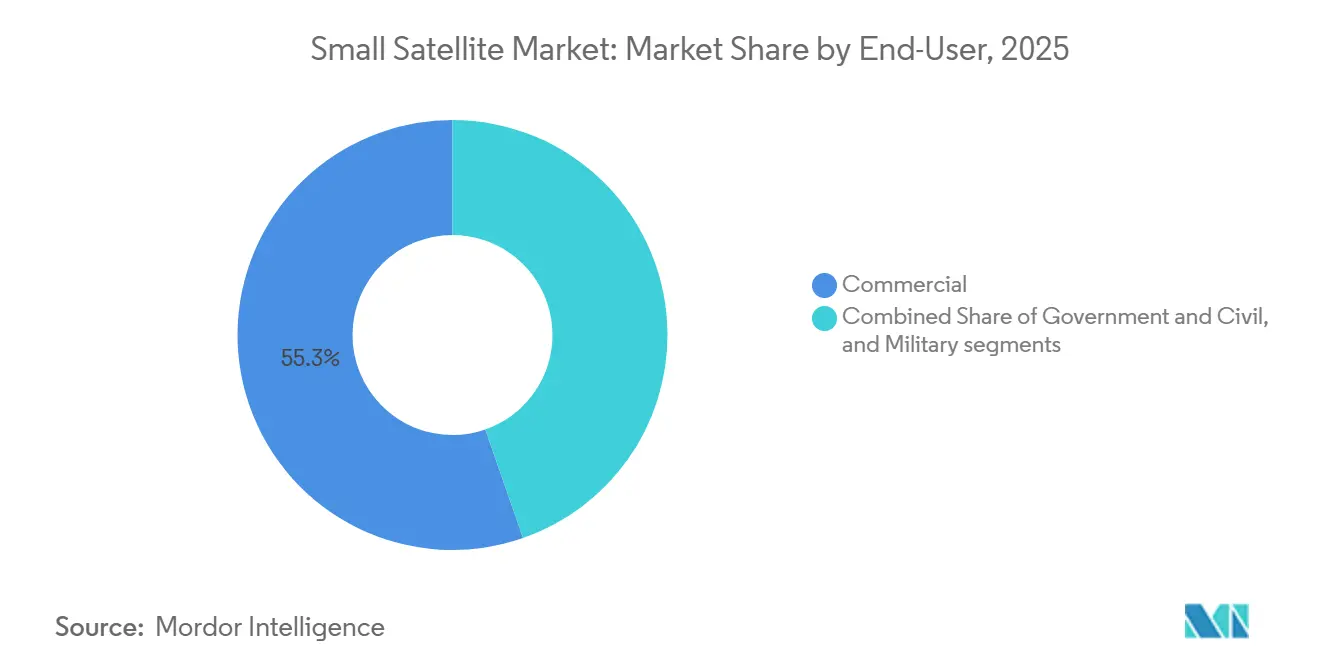
- By end user, the commercial segment accounted for 55.32% of the small satellite market share in 2025 and is forecasted to grow at a 24.91% CAGR through 2031.
- By mass, minisatellites captured 45.69% of the small satellite market in 2025, whereas microsatellites are forecasted to grow at a 24.52% CAGR through 2031.
- By geography, North America commanded 53.77% of the small satellite market share in 2025, yet Asia-Pacific is forecasted to grow at a 24.63% CAGR through 2031.
Note: Market size and forecast figures in this report are generated using Mordor Intelligence’s proprietary estimation framework, updated with the latest available data and insights as of January 2026.
Global Small Satellite Market Trends and Insights
Drivers Impact Analysis*
| DRIVER | (~) % IMPACT ON CAGR FORECAST | GEOGRAPHIC RELEVANCE | IMPACT TIMELINE |
|---|---|---|---|
| Reusable-launch cost collapse | +6.2% | Global, with North America and Asia-Pacific leading adoption | Medium term (2-4 years) |
| LEO broadband mega-constellations boom | +5.8% | Global, concentrated in North America, Europe, and Asia-Pacific | Short term (≤ 2 years) |
| Multi-sector demand for Earth-observation analytics | +4.7% | Global, with Asia-Pacific and Europe showing fastest uptake | Medium term (2-4 years) |
| National-security shift to proliferated LEO fleets | +3.9% | North America, Europe, Asia-Pacific (China, India, Japan) | Long term (≥ 4 years) |
| Climate-compliance monitoring mandates | +1.8% | Europe and North America, expanding to Asia-Pacific | Long term (≥ 4 years) |
| Export-credit support for domestic constellations | +1.3% | Asia-Pacific, Middle East, South America | Medium term (2-4 years) |
| Source: Mordor Intelligence | |||


Reusable-launch cost collapse
The adoption of reusable launch systems, initiated by SpaceX, has substantially reduced the cost of space access. Reusable first stages from operators such as Rocket Lab and SpaceX have broken the historic link between payload mass and launch expense.[1]Planet Labs PBC, “2024 10-K Filing,” planet.com Reusable rockets can be launched multiple times, achieving cost savings of up to 70% per launch. The SpaceX company has lowered the cost, equating to around USD 2,700 to USD 3,000 per kilogram to LEO. In contrast, traditional expendable rockets often cost more than USD 10,000 per kilogram, underscoring the financial benefits of reusability. Electron flew 21 times in 2025, and Falcon 9 surpassed 90 missions, so constellation owners can book monthly slots instead of waiting a year. Faster cadence means designers can update sensors every 18 months, keeping fleets technologically current. Lower cost per kilogram also encourages redundancy, which improves service uptime. Export-credit agencies in India and Japan finance new launch vehicles, adding global price pressure below USD 5,000 per kg. This cost efficiency reduces entry barriers for satellite operators, expedites constellation deployment, and supports growth in the small satellite market.
LEO Broadband Mega-Constellations Boom
The rapid growth of LEO broadband mega-constellations, driven by companies such as SpaceX and OneWeb, is a significant factor propelling the small satellite market. Amazon Kuiper gained a 7,727-satellite license and placed 210 craft by late 2025.[2]Amazon Kuiper, “FCC Authorization,” fcc.gov SpaceX exceeded 7,000 satellites in early 2026 and earned more than USD 6 billion in annual revenue, validating the economics of direct-to-consumer services.[3]Bloomberg News, “Starlink Revenue Analysis,” bloomberg.com OneWeb, with 634 satellites, targets enterprise users to sidestep consumer price wars. The first network to achieve global coverage usually wins regional distribution deals, locking customers into proprietary terminals. Regulations also matter; the US and UK licensing processes move faster than those in many other regions, giving their operators a head start. These extensive networks necessitate the deployment of hundreds to thousands of small satellites, increasing manufacturing demand, launch frequency, and downstream services, including global connectivity, particularly in underserved and remote areas.
Multi-sector demand for Earth-observation analytics
The increasing demand for Earth observation analytics across multiple industries is driving the deployment of small satellites. Sectors such as agriculture, energy, insurance, and defense are using this data for monitoring, forecasting, and decision-making. Planet Labs recorded revenue of USD 233.9 million in 2024 as farmers adopted daily imagery to manage irrigation.[4]Rocket Lab USA, “Q4 2025 Earnings Results,” rocketlabusa.com ICEYE raised USD 93 million in 2024 to expand SAR satellites that see through clouds for insurers.[5]ICEYE, “Series E Funding Announcement,” iceye.com Constellations of 50-plus craft deliver sub-daily revisit, turning imagery into a live data feed. Premium defense users pay for sub-meter resolution and tasking priority, while price-sensitive sectors accept 3-5 meter data bundled with change-detection algorithms. Regional firms in China and India compete on price and data-sovereignty assurances. Companies like Planet Labs and Maxar Technologies are enhancing their capabilities, fueling the global demand for high-resolution, frequent, and cost-effective satellite data services.
National-security shift to proliferated LEO fleets
The transition in national security strategies toward the deployment of proliferated LEO satellite fleets is significantly increasing demand in the small satellite market. The US Space Development Agency signed USD 1.8 billion of Andromeda contracts in 2026 to field optical crosslinks and infrared sensors across dozens of nodes. The US Space Force will test resilient GPS payloads in LEO by 2028. Distributing capability across many craft makes the network harder to disable. Traditional primes must now partner with commercial manufacturers to meet unit-cost and build-rate targets, letting new entrants like Rocket Lab capture defense revenue. Governments, especially the US Department of Defense (DoD), are prioritizing investments in distributed, resilient constellations to strengthen surveillance, communication, and missile-warning systems. This strategy enhances redundancy, minimizes vulnerabilities, and expedites the procurement of small satellites for defense purposes.
Restraints Impact Analysis*
| RESTRAINT | (~) % IMPACT ON CAGR FORECAST | GEOGRAPHIC RELEVANCE | IMPACT TIMELINE |
|---|---|---|---|
| Spectrum-licensing bottlenecks | -2.4% | Global, particularly impacting new entrants in North America and Europe | Short term (≤ 2 years) |
| Space-debris mitigation costs | -1.9% | Global, with Europe enforcing strictest compliance timelines | Medium term (2-4 years) |
| Single-source supply of rad-hard components | -1.2% | North America and Europe defense programs, spillover to commercial | Medium term (2-4 years) |
| Increased VLEO drag during solar maximum 25 | -0.8% | Global, affecting sub-500 km orbits | Short term (≤ 2 years) |
| Source: Mordor Intelligence | |||
Spectrum-licensing bottlenecks
Spectrum-licensing bottlenecks are a significant restraint on the small satellite market. Operators are required to obtain approvals from national regulators and coordinate internationally through organizations such as the International Telecommunication Union. The FCC halved its Earth-station backlog in 2025, yet coordination with federal spectrum users still takes up to two years. ITU power flux density limits hold back fleet throughput until new rules are agreed at WRC-27. Terminal makers hesitate to mass-produce V-band equipment without clear constellation timelines, slowing hardware cost reduction. Operators with earlier Ku- or Ka-band approvals, such as Starlink, enjoy a timing advantage. These processes are often lengthy and complex, and limited spectrum availability further delays constellation deployments, increases compliance costs, and creates uncertainty. This challenge is particularly pronounced for new entrants aiming for timely market access.
Space-debris mitigation costs
Space debris mitigation requirements pose an increasing challenge in the small satellite market. Operators are required to invest in tracking systems, collision-avoidance measures, and end-of-life disposal solutions to comply with guidelines set by organizations such as the European Space Agency (ESA). ESA now requires LEO satellites to deorbit within five years, cutting mission life and adding propellant mass. Meeting the rule costs USD 200,000-500,000 per satellite, eroding the low-budget edge of microsats. Insurance premiums climb for fleets in crowded 500-600 km orbits, nudging new deployments to lower altitudes where atmospheric drag cleans up debris faster. These additional design and operational expenses contribute to greater mission complexity, longer development timelines, and increased pressure on margins, especially for cost-sensitive small satellite constellations.
*Our forecasts treat driver/restraint impacts as directional, not additive. The impact forecasts reflect baseline growth, mix effects, and variable interactions.
Segment Analysis
By Application: Earth Observation Outpaces Legacy Broadband
Earth observation expanded with a 24.71% CAGR forecast for 2026-2031, overtaking communication’s dominance despite communication holding 45.25% of the small satellite market share in 2025. Planet Labs and ICEYE add high-resolution and SAR data that agriculture and insurance customers absorb in real time. The small satellite market size for Earth-observation services is propelled by analytics platforms that monetize alerts rather than raw pixels. Communication still relies on massive fleets like Starlink, but growth slows as North American consumer uptake plateaus. Analytic providers tailor products to defense, maritime, and disaster-response users, capturing higher margins.
Meanwhile, navigation payloads test LEO signals to protect against jamming. Scientific space-observation missions, though vital, remain niche due to limited funding. The application mix shows a split between high-volume consumer broadband and high-value data services, each shaping satellite design differently.


By Orbit: MEO Gains as PNT and Relay Demand Accelerates
LEO accounted for 42.75% of the small satellite market size in 2025, driven by internet constellations that value low latency. MEO is projected to grow at a 24.83% CAGR because positioning, navigation, and timing missions balance coverage and survivability without requiring thousands of craft. Defense contracts such as ESS place protected communication relays in MEO to sidestep GEO latency while avoiding LEO drag. GEO operators retrofit electric propulsion and flexible payloads, yet still lose share as customers demand latency under 100 ms. Regulatory fights over scarce GEO slots push emerging nations toward LEO alternatives. Hybrid fleets mixing MEO relays with LEO user links emerge as a compromise, spreading investment risk across orbits.
By End-User: Commercial Operators Set Deployment Pace
Commercial buyers held 55.32% of the small satellite market share in 2025 and grew at a 24.91% CAGR to 2031. Firms like Amazon and SpaceX accept shorter design cycles and higher technical risk to reach the market first. Commercial bandwidth or imagery is then resold to government agencies under service contracts, blurring the civil-military line. Defense programs still pay for bespoke security and radiation tolerance, which push up per-unit costs. Yet even the Pentagon now leases Starlink terminals during field exercises, signaling confidence in commercial reliability. Academic missions rely on grants rather than revenue, but benefit from lower launch prices that make student-built cubesats viable.
By Satellite Mass: Microsatellites Gain as Modular Payloads Mature
Minisatellites captured 45.69% of the small satellite market size in 2025, but microsatellites will grow at a 24.52% CAGR because advanced sensors now fit into 50-kg buses. ICEYE proves that 100-kg SAR platforms deliver 1-meter imagery once reserved for 500-kg craft. Rideshare missions favor sub-100 kg payloads that slip into excess capacity. Regulatory thresholds at 100 kg incentivize designers to stay lighter to simplify compliance with debris-mitigation requirements. Nanosatellites dominate education and technology demo flights, while femtosatellites remain experimental.
Geography Analysis
North America led with a 53.77% share in 2025 due to Starlink’s deployment pace and the Pentagon’s spending on proliferated architecture. The Andromeda contract spreads orders across 14 companies, encouraging supply-chain diversity and competition. Rocket Lab’s USD 1.85 billion backlog underlines how vertical integration secures margins despite price pressure. Canada’s Telesat prepares a 298-satellite network serving polar regions, broadening continental service coverage.
Asia-Pacific is forecasted to grow at a 24.63% CAGR as China’s Guowang constellation and India’s NewSpace India Limited scale local manufacturing. Chang Guang Satellite Technology sells high-resolution data across Southeast Asia and Africa at aggressive prices. India expands PSLV output, letting regional startups bypass foreign launch queues. Japan leverages precision manufacturing to supply electric-propulsion components, while Australia’s streamlined licensing draws ground-station investors.
Europe holds a stable 15-18% share, constrained by fragmented procurement and slower spectrum coordination. OneWeb completed its 634-satellite fleet and targets enterprise connectivity. ESA’s three-satellite CO2M program supports the EU Carbon Border Adjustment Mechanism, tying Earth-observation demand to climate policy. Middle East wealth funds back domestic platforms through Western joint ventures. South America sees steady growth as Brazil’s BNDES finances indigenous manufacturing, while Satellogic’s Uruguay plant ships 35-kg buses for agriculture analytics.

Competitive Landscape
The small satellite market is moderately fragmented. SpaceX owns 35-40% of global LEO deployment value through Starlink, but Amazon Kuiper, OneWeb, and regional challengers in China and India erode first-mover advantage. Vertically integrated players control manufacturing, launch, and ground networks, avoiding margin stacking. Rocket Lab’s strategy mirrors this model with its Electron and Photon platforms, locking in long-term contracts.
Technology differentiation now centers on optical crosslinks and on-board processing. The US defense contracts require domestic photonics supply, which disadvantages import-reliant firms. White-space opportunities include very-low-Earth-orbit (VLEO) swarms that self-deorbit, hybrid LEO-MEO constellations for latency-coverage trade-offs, and vertical-specific analytics bundles. Traditional primes lose commercial share because their processes, tuned for high-assurance defense work, cannot meet venture timelines. Export-credit financing in India, Japan, and Brazil reshapes competition by subsidizing domestic champions who might otherwise fail to reach scale. Supply-chain resilience has become a selling point, pushing companies to dual-source radiation-hardened chips to hedge geopolitical risk.
Small Satellite Industry Leaders
Airbus SE
OHB SE
Thales Alenia Space
Space Exploration Technologies Corp.
Chang Guang Satellite Technology Co. Ltd.
- *Disclaimer: Major Players sorted in no particular order

Recent Industry Developments
- April 2026: The US Space Development Agency awarded 14 firms a USD 1.8 billion ceiling under the Andromeda program to deliver optical links and infrared sensors for a proliferated network.
- December 2025: Amazon Kuiper secured an FCC license for a second-generation 7,727-satellite network and had 210 craft in orbit.
- October 2025: Airbus SE, Leonardo S.p.A., and Thales signed a Memorandum of Understanding (MOU) to consolidate their space activities into a new European space company, with operations planned to commence in 2027.
- September 2025: Hindustan Aeronautics Limited signed a technology transfer agreement with the Indian Space Research Organisation (ISRO), NewSpace India Limited, and IN-SPACe to acquire Small Satellite Launch Vehicle (SSLV) technology and to commence a 10-year production phase.
- July 2025: The Boeing Company won a USD 2.8 billion contract for Evolved Strategic SATCOM, blending protected ground terminals with LEO relay nodes.


Global Small Satellite Market Report Scope
Small satellites are those satellites weighing under 500 kg. The small satellite market report excludes sounding rockets, high-altitude balloon platforms, and purely experimental payloads.
The small satellite market is segmented by application, orbit, end-user, satellite mass, and geography. By application, the market is segmented into communication, Earth observation, navigation, space observation, and others. By orbit, the market is segmented into low Earth orbit (LEO), medium Earth orbit (MEO), and geostationary orbit (GEO). By end-user, the market is segmented into commercial, government and civil, and military. By satellite mass, the market is segmented into femtosatellites, picosatellites, nanosatellites, microsatellites, and minisatellites. The report also covers the market sizes and forecasts for the small satellite market in major countries across different regions. For each segment, the market size is provided in terms of value (USD).
By Application
| Communication |
| Earth Observation |
| Navigation |
| Space Observation |
| Others |
By Orbit
| Low Earth Orbit (LEO) |
| Medium Earth Orbit (MEO) |
| Geostationary Orbit (GEO) |
By End-User
| Commercial |
| Government and Civil |
| Military |
By Satellite Mass
| Femtosatellites |
| Picosatellites |
| Nanosatellites |
| Microsatellites |
| Minisatellites |
By Geography
| North America | United States | |
| Canada | ||
| Mexico | ||
| Europe | United Kingdom | |
| France | ||
| Germany | ||
| Russia | ||
| Rest of Europe | ||
| Asia-Pacific | China | |
| India | ||
| Japan | ||
| South Korea | ||
| Rest of Asia-Pacific | ||
| South America | Brazil | |
| Rest of South America | ||
| Middle East and Africa | Middle East | Saudi Arabia |
| United Arab Emirates | ||
| Rest of Middle East | ||
| Africa | South Africa | |
| Rest of Africa | ||
| By Application | Communication | ||
| Earth Observation | |||
| Navigation | |||
| Space Observation | |||
| Others | |||
| By Orbit | Low Earth Orbit (LEO) | ||
| Medium Earth Orbit (MEO) | |||
| Geostationary Orbit (GEO) | |||
| By End-User | Commercial | ||
| Government and Civil | |||
| Military | |||
| By Satellite Mass | Femtosatellites | ||
| Picosatellites | |||
| Nanosatellites | |||
| Microsatellites | |||
| Minisatellites | |||
| By Geography | North America | United States | |
| Canada | |||
| Mexico | |||
| Europe | United Kingdom | ||
| France | |||
| Germany | |||
| Russia | |||
| Rest of Europe | |||
| Asia-Pacific | China | ||
| India | |||
| Japan | |||
| South Korea | |||
| Rest of Asia-Pacific | |||
| South America | Brazil | ||
| Rest of South America | |||
| Middle East and Africa | Middle East | Saudi Arabia | |
| United Arab Emirates | |||
| Rest of Middle East | |||
| Africa | South Africa | ||
| Rest of Africa | |||


Market Definition
- Application - Various applications or purposes of the satellites are classified into communication, earth observation, space observation, navigation, and others. The purposes listed are those self-reported by the satellite’s operator.
- End User - The primary users or end users of the satellite is described as civil (academic, amateur), commercial, government (meteorological, scientific, etc.), military. Satellites can be multi-use, for both commercial and military applications.
- Launch Vehicle MTOW - The launch vehicle MTOW (maximum take-off weight) means the maximum weight of the launch vehicle during take-off, including the weight of payload, equipment and fuel.
- Orbit Class - The satellite orbits are divided into three broad classes namely GEO, LEO, and MEO. Satellites in elliptical orbits have apogees and perigees that differ significantly from each other and categorized satellite orbits with eccentricity 0.14 and higher as elliptical.
- Propulsion tech - Under this segment, different types of satellite propulsion systems have been classified as electric, liquid-fuel and gas-based propulsion systems.
- Satellite Mass - Under this segment, different types of satellite propulsion systems have been classified as electric, liquid-fuel and gas-based propulsion systems.
- Satellite Subsystem - All the components and subsystems which includes propellants, buses, solar panels, other hardware of satellites are included under this segment.
| Keyword | Definition |
|---|---|
| Attitude Control | The orientation of the satellite relative to the Earth and the sun. |
| INTELSAT | The International Telecommunications Satellite Organization operates a network of satellites for international transmission. |
| Geostationary Earth Orbit (GEO) | Geostationary satellites in Earth orbit 35,786 km (22,282 mi) above the equator in the same direction and at the same speed as the earth rotates on its axis, making them appear fixed in the sky. |
| Low Earth Orbit (LEO) | Low Earth Orbit satellites orbit from 160-2000km above the earth, take approximately 1.5 hours for a full orbit and only cover a portion of the earth’s surface. |
| Medium Earth Orbit (MEO) | MEO satellites are located above LEO and below GEO satellites and typically travel in an elliptical orbit over the North and South Pole or in an equatorial orbit. |
| Very Small Aperture Terminal (VSAT) | Very Small Aperture Terminal is an antenna that is typically less than 3 meters in diameter |
| CubeSat | CubeSat is a class of miniature satellites based on a form factor consisting of 10 cm cubes. CubeSats weigh no more than 2 kg per unit and typically use commercially available components for their construction and electronics. |
| Small Satellite Launch Vehicles (SSLVs) | Small Satellite Launch Vehicle (SSLV) is a three-stage Launch Vehicle configured with three Solid Propulsion Stages and a liquid propulsion-based Velocity Trimming Module (VTM) as a terminal stage |
| Space Mining | Asteroid mining is the hypothesis of extracting material from asteroids and other asteroids, including near-Earth objects. |
| Nano Satellites | Nanosatellites are loosely defined as any satellite weighing less than 10 kilograms. |
| Automatic Identification System (AIS) | Automatic identification system (AIS) is an automatic tracking system used to identify and locate ships by exchanging electronic data with other nearby ships, AIS base stations, and satellites. Satellite AIS (S-AIS) is the term used to describe when a satellite is used to detect AIS signatures. |
| Reusable launch vehicles (RLVs) | Reusable launch vehicle (RLV) means a launch vehicle that is designed to return to Earth substantially intact and therefore may be launched more than one time or that contains vehicle stages that may be recovered by a launch operator for future use in the operation of a substantially similar launch vehicle. |
| Apogee | The point in an elliptical satellite orbit which is farthest from the surface of the earth. Geosynchronous satellites which maintain circular orbits around the earth are first launched into highly elliptical orbits with apogees of 22,237 miles. |


Research Methodology
Mordor Intelligence follows a four-step methodology in all our reports.
- Step-1: Identify Key Variables: In order to build a robust forecasting methodology, the variables and factors identified in Step-1 are tested against available historical market numbers. Through an iterative process, the variables required for market forecast are set and the model is built on the basis of these variables.
- Step-2: Build a Market Model: Market-size estimations for the historical and forecast years have been provided in revenue and volume terms. For sales conversion to volume, the average selling price (ASP) is kept constant throughout the forecast period for each country, and inflation is not a part of the pricing.
- Step-3: Validate and Finalize: In this important step, all market numbers, variables and analyst calls are validated through an extensive network of primary research experts from the market studied. The respondents are selected across levels and functions to generate a holistic picture of the market studied.
- Step-4: Research Outputs: Syndicated Reports, Custom Consulting Assignments, Databases & Subscription Platforms.


