Remote Sensing Satellites Market Size and Share
Market Overview
| Study Period | 2017 - 2030 |
|---|---|
| Forecast Data Period | 2025 - 2030 |
| Historical Data Period | 2017 - 2023 |
| Market Size (2025) | USD 48.62 Billion |
| Market Size (2030) | USD 84.35 Billion |
| Growth Rate (2025 - 2030) | 11.65% CAGR |
| Market Concentration | High |
Major Players*Disclaimer: Major Players sorted in no particular order Image © Mordor Intelligence. Reuse requires attribution under CC BY 4.0. | |

Remote Sensing Satellites Market Analysis by Mordor Intelligence
The Remote Sensing Satellites Market size is estimated at 48.62 billion USD in 2025, and is expected to reach 84.35 billion USD by 2030, growing at a CAGR of 11.65% during the forecast period (2025-2030).
The remote sensing satellite industry is experiencing significant transformation driven by technological advancements and evolving application requirements. Low Earth Orbit (LEO) has emerged as the preferred deployment zone, with approximately 90% of remote sensing satellites launched between 2017 and 2022 positioned in LEO for Earth observation and scientific applications. This preference stems from LEO's proximity to Earth, enabling high-resolution imagery transmission with minimal latency. The industry is witnessing increased collaboration between space agencies and private sector companies, as exemplified by the February 2023 agreement between NASA and Esri to expand access to geospatial content for research and exploration purposes.
The market landscape is characterized by diverse applications across communication, navigation, and Earth observation sectors. Recent deployment patterns reveal specialized orbital preferences based on functionality, with 105 out of 147 GEO satellites dedicated to communication applications, while 46 out of 56 MEO satellites serve navigation and global positioning purposes. This strategic orbital positioning demonstrates the industry's mature understanding of optimal satellite placement for specific applications. In January 2023, Airbus Defence and Space secured a contract with Poland to provide a comprehensive geospatial intelligence system, including the development and delivery of two high-performance optical Earth observation satellites.
The commercial space sector is witnessing unprecedented growth in satellite deployment capabilities and advanced imaging technologies. Space agencies are actively pursuing next-generation Earth observation missions, as demonstrated by JAXA's March 2023 initiative to launch the Advanced Land Observing Satellite "Daichi 3" (ALOS-3). These developments are complemented by increasing private sector participation in satellite manufacturing and deployment, fostering innovation in remote sensing industry technologies and applications.
The industry is experiencing a shift toward integrated satellite systems and constellations, enabling comprehensive Earth observation and monitoring capabilities. Space agencies and commercial operators are focusing on developing sophisticated remote sensing platforms that combine multiple imaging technologies, including optical, radar, and hyperspectral sensors. This trend is supported by advancements in data processing capabilities and artificial intelligence, enabling more efficient analysis of satellite imagery for applications ranging from environmental monitoring to urban planning and disaster management. The satellite market is poised for growth as these innovations continue to evolve.
Global Remote Sensing Satellites Market Trends and Insights
Rising demand for satellite miniaturization across all regions is driving the market
- The ability of small satellites to perform nearly all the functions of traditional satellites at a fraction of their cost has increased the viability of building, launching, and operating small satellite constellations. The demand from North America is primarily driven by the United States, which manufactures the largest number of small satellites each year. In North America, during 2017-2022, a total of 596 nanosatellites were placed into orbit by various regional players. NASA is also currently involved in several projects aimed at developing these satellites.
- The demand from Europe is primarily driven by Germany, France, Russia, and the United Kingdom, which manufacture the largest number of small satellites each year. During 2017-2022, more than 50 nano and microsatellites were placed into orbit by various regional players. The miniaturization and commercialization of electronic components and systems have driven market participation, resulting in the emergence of new market players who aim to capitalize on and enhance the current market scenario. For instance, UK-based startup Open Cosmos partnered with ESA to provide commercial nanosatellite launch services to end users while ensuring competitive cost savings of around 90%.
- The demand from Asia-Pacific is primarily driven by China, Japan, and India, which manufacture the largest number of small satellites annually. During 2017-2022, more than 190 nano and microsatellites were placed into orbit by various regional players. China is investing significant resources toward augmenting its space-based capabilities. The country has launched the most significant number of nano and microsatellites in Asia-Pacific to date.
,-Number-of-Launches,-Global,-2017---2022.svg)


Investment opportunities in satellite manufacturing is driving the market
- In North America, global government expenditure for space programs reached a record of approximately USD 103 billion in 2021. The region is the epicenter of space innovation and research, with the presence of the world's biggest space agency, NASA. In 2022, the US government spent nearly USD 62 billion on its space programs, making it the highest spender on space programs in the world. In the United States, federal agencies receive funding from Congress every year worth USD 32.33 billion for their subsidiaries.
- European countries are recognizing the importance of various investments in the space domain and are increasing their spending on innovative activities to remain competitive in the global space industry. In November 2022, ESA announced that it had proposed a 25% boost in space funding over the next three years designed to maintain Europe's lead in Earth observation, expand navigation services, and remain a partner in space exploration with the United States. The European Space Agency (ESA) is asking its 22 nations to back a budget of some EUR 18.5 billion for 2023-2025. Germany, France, and Italy are the major contributors.
- In line with the increase in space-related activities in the Asia-Pacific region, in 2022, Japan’s draft budget registered a rise in its space budget, which amounted to over USD 1.4 billion. It included the development of the H3 rocket, Engineering Test Satellite-9, and the nation's Information Gathering Satellite (IGS) program. Similarly, the proposed budget for India's space programs for FY22 was USD 1.83 billion. In 2022, the South Korean Ministry of Science and ICT announced a space budget of USD 619 million for manufacturing satellites, rockets, and other key space equipment.

OTHER KEY INDUSTRY TRENDS COVERED IN THE REPORT
- Medium And Micro Satellites Poised To Generate Demand In The Market
Segment Analysis: Satellite Mass
Above 1000kg Segment in Remote Sensing Satellites Market
The above 1000kg segment dominates the remote sensing satellites market, accounting for approximately 76% market share in 2024. Large satellites in this category are equipped with radiation-hardened space-grade electronics and generate more power through larger deployable solar panels to support all subsystems and larger loads. These satellites are primarily designed for operational purposes with extended lifespans ranging between 5 and 10 years, making them ideal for carrying larger remote sensing payloads, transponders, and larger antennas for communication purposes. The high-resolution capabilities of these satellites enable them to capture detailed images and gather more accurate data about Earth, particularly useful for monitoring natural disasters and environmental changes. Their operational reliability is enhanced through redundancy in all major subsystems, which helps support accidental failures and extends their operational life.
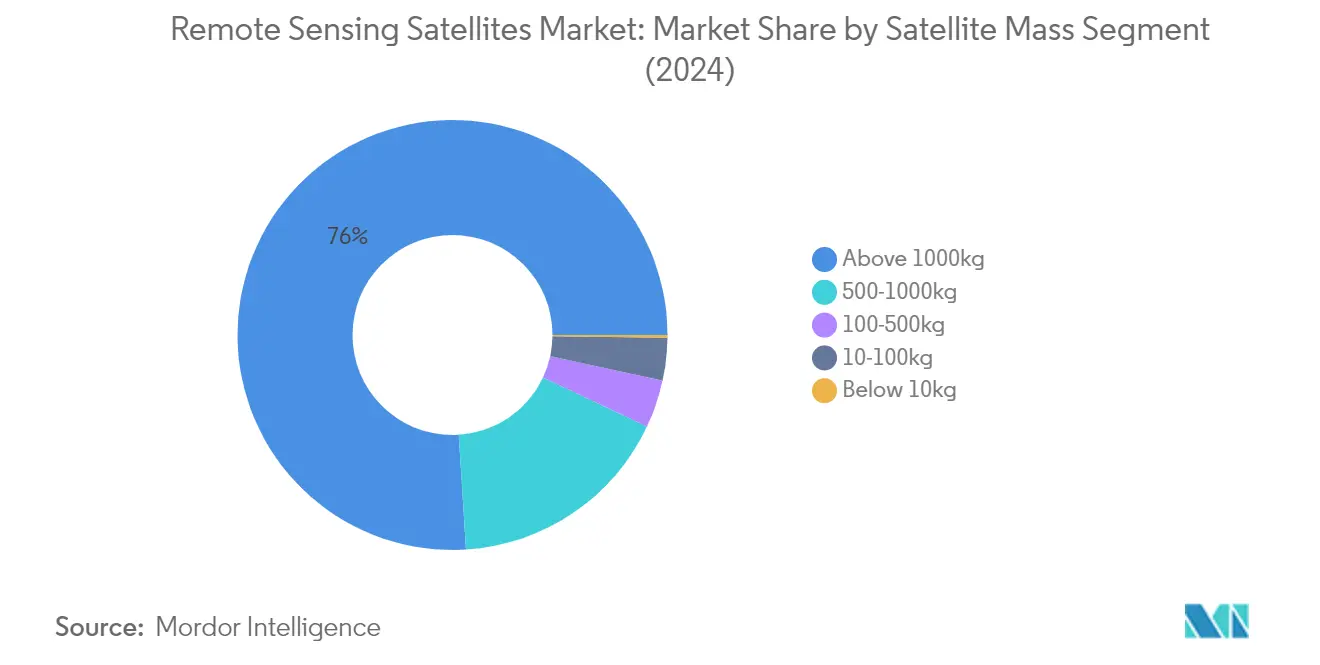

500-1000kg Segment in Remote Sensing Satellites Market
The 500-1000kg segment is projected to experience significant growth at approximately 12% CAGR from 2024 to 2029. Medium-sized satellites in this category are witnessing increased adoption due to their ability to provide greater coverage with fewer launches, making them a cost-effective solution for various applications. The growth is particularly driven by rising demand from surveillance, intelligence gathering, and navigation applications, prompting government and defense agencies to invest heavily in medium-sized military satellites. These satellites offer an optimal balance between capability and cost, making them attractive for both commercial and military applications. The segment's growth is further supported by technological advancements in satellite manufacturing and increasing investments in space programs globally.
Remaining Segments in Satellite Mass
The remaining segments, including 100-500kg, 10-100kg, and below 10kg satellites, each serve specific market niches with unique advantages. Mini-satellites (100-500kg) compete with larger satellites in many applications, featuring miniature but redundant electronics that reduce size and mass while maintaining functionality. Microsatellites (10-100kg) offer cost-effective solutions for medium-term applications and are particularly suitable for constellation deployments. Nanosatellites (below 10kg) provide an economical option for specific applications, especially popular among universities and research institutions for specialized missions. These segments collectively contribute to market diversity by offering varied solutions for different mission requirements and budget constraints.
Segment Analysis: Orbit Class
LEO Segment in Remote Sensing Satellites Market
Low Earth Orbit (LEO) dominates the remote sensing satellites market, commanding approximately 80% market share in 2024. This significant market position is driven by the growing demand for global connectivity, including Internet of Things (IoT), Earth observation, climate monitoring, and scientific research applications. LEO satellites are particularly advantageous due to their proximity to Earth's surface, which enables them to provide high-resolution imagery with minimal signal latency. The reduced cost of launching small satellites into LEO compared to higher orbits has made it increasingly accessible for various organizations, including universities and startups. The segment's growth is further supported by the rising need for accurate and frequent Earth observation data across multiple industries, including agriculture, urban planning, and disaster management.
MEO Segment in Remote Sensing Satellites Market
The Medium Earth Orbit (MEO) segment is experiencing the fastest growth in the remote sensing technology market, with a projected growth rate of approximately 13% from 2024 to 2029. This accelerated growth is primarily driven by increasing military and intelligence applications, particularly in navigation systems and surveillance operations. The segment's expansion is further supported by technological advancements in satellite manufacturing and growing investments from defense organizations worldwide. Recent developments include the U.S. Space Force's initiatives in developing Missile Track Custody (MTC) MEO satellites for enhanced surveillance capabilities. Additionally, European organizations are actively investing in MEO satellite constellations for navigation and positioning services, demonstrating the segment's growing importance in global space infrastructure.
Remaining Segments in Orbit Class
The Geostationary Earth Orbit (GEO) segment continues to play a crucial role in the satellite market, particularly for applications requiring continuous coverage of specific geographical areas. GEO satellites are essential for weather forecasting, climate monitoring, and communications services due to their ability to maintain a fixed position relative to Earth's surface. These satellites provide valuable services for military operations, government agencies, and commercial entities requiring constant surveillance or communication capabilities over specific regions. The segment's stability and reliability make it particularly important for long-term Earth observation missions and strategic military applications.
Segment Analysis: Satellite Subsystem
Propulsion Hardware and Propellant Segment in Remote Sensing Satellites Market
The Propulsion Hardware and Propellant segment dominates the remote sensing satellites market, commanding approximately 44% market share in 2024. This segment's prominence is driven by the increasing demand for mass satellite constellations and the critical role of propulsion systems in satellite operations. These systems are essential for adjusting satellite direction, position maintenance, and orbital transfers. The segment's growth is further supported by technological advancements in both chemical and electric propulsion systems, with companies focusing on developing more efficient and mission-specific propulsion solutions. The integration of innovative technologies like plasma electric propulsion systems and the rising demand for in-space maneuvering capabilities have strengthened this segment's market position. Additionally, the segment benefits from the increasing deployment of satellites requiring sophisticated propulsion systems for precise orbital positioning and extended operational lifespans.
Satellite Bus & Subsystems Segment in Remote Sensing Satellites Market
The Satellite Bus & Subsystems segment demonstrates significant growth potential in the remote sensing satellites market, with an expected growth rate of approximately 11% from 2024 to 2029. This growth is primarily driven by the increasing commercial demand for small satellites and the continuous advancement in miniaturized electronic components. The segment's expansion is supported by private players investing substantially in research and development to exploit new market opportunities. The development of flexible, multi-mission spacecraft platforms, such as the LM 400 satellite bus, showcases the segment's innovation trajectory. Furthermore, the emphasis on developing customizable and adaptable satellite buses for various applications, including military, civilian, and commercial uses, contributes to the segment's growth momentum. The integration of advanced technologies and the focus on cost-effective, reliable satellite bus solutions continue to drive innovation in this segment.
Remaining Segments in Satellite Subsystem
The Solar Array & Power Hardware and Structures, Harness & Mechanisms segments play vital roles in the remote sensing satellites market. The Solar Array & Power Hardware segment is crucial for providing a consistent power supply to satellites, particularly important for long-duration space missions and autonomous operations. This segment continues to evolve with advancements in solar panel technologies and power management systems. The Structures, Harness & Mechanisms segment focuses on the physical framework and mechanical systems of satellites, including payload integration and deployment mechanisms. Both segments are experiencing technological advancements, with manufacturers focusing on developing lighter, more durable materials and more efficient power generation solutions. The integration of these subsystems is essential for overall satellite performance and reliability, making them integral components of modern satellite architecture.
Segment Analysis: End User
Military & Government Segment in Remote Sensing Satellites Market
The military and government segment dominates the remote sensing satellites market, commanding approximately 93% market share in 2024. This substantial market presence is primarily driven by increasing defense spending worldwide and the growing integration of space systems with air, land, and sea platforms by armed forces globally. Military organizations are extensively utilizing remote sensing satellites for various critical applications, including surveillance missions, missile tracking, intelligence gathering, and navigation applications. The segment's growth is further bolstered by significant investments from major defense agencies in upgrading existing satellite navigation systems to better prepare for future threats. Several government space agencies are also actively involved in satellite development programs, contributing to the segment's dominant position in the market.
Commercial Segment in Remote Sensing Satellites Market
The commercial segment in the remote sensing satellites market is experiencing significant growth, with an expected growth rate of approximately 12% during the forecast period 2024-2029. This robust growth is driven by the increasing adoption of remote sensing technologies for various commercial applications, including agriculture, forestry, ocean resources, and disaster management. The segment is witnessing heightened demand for accurate and frequent Earth observation data, particularly in radiative, spatial, and spectral resolution capabilities. Commercial entities are increasingly investing in hyperspectral imaging systems for diverse research programs across fields such as soil analysis, forestry management, agriculture monitoring, urban planning, and cryosphere studies. The growth is further supported by the rising number of private companies entering the market with innovative satellite solutions and services.
Remaining Segments in End User
The other segment in the remote sensing satellites market primarily comprises academic institutions and research organizations. While this segment represents a smaller portion of the market, it plays a crucial role in advancing satellite technology and research applications. Academic institutions are increasingly launching satellites for scientific research and educational purposes, particularly in areas where commercial or government-operated satellites may not provide the necessary specialized data. These institutions often collaborate with commercial and government entities on innovative satellite projects, contributing to technological advancement in the field. The segment's activities primarily focus on specialized research applications, experimental technologies, and educational initiatives that complement the broader commercial and military applications in the market.
Remote Sensing Satellites Market Geography Segment Analysis
Remote Sensing Satellites Market in Asia-Pacific
The Asia-Pacific region dominates the global remote sensing satellite market, accounting for approximately 45% of the global market value in 2024. The region's prominence is primarily driven by China, which leads in manufacturing and launching a significant number of remote sensing satellites. China's substantial investments in modern satellite constellations for intelligence, surveillance, positioning, navigation, and timing, as well as Earth observation, have established its position as a key market player. Japan, India, and South Korea also contribute significantly to the regional market, though at a smaller scale compared to China due to their relatively limited funding for space-related activities. These countries are actively developing their space capabilities through various satellite programs and international collaborations. The region's market is characterized by a strong focus on technological advancement, with particular emphasis on miniaturization and cost-effective satellite solutions. Government support, increasing private sector participation, and growing applications in areas such as disaster management, agriculture, and urban planning continue to drive market growth in the region.
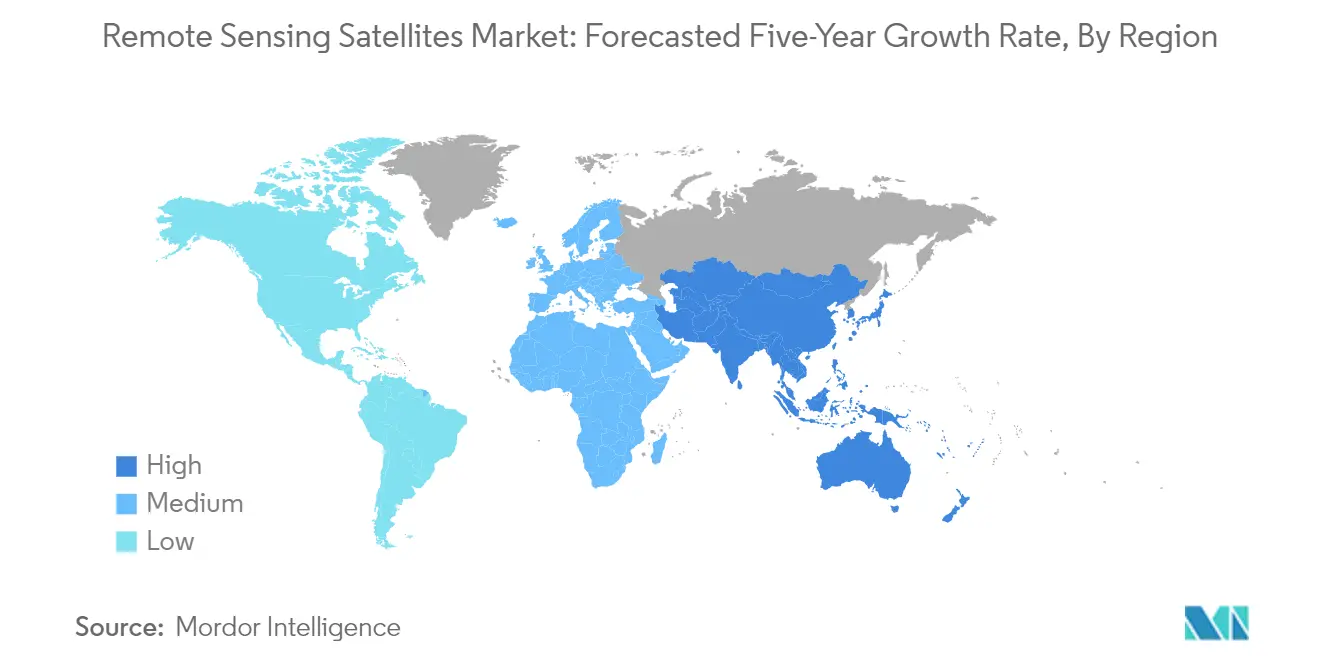
Remote Sensing Satellites Market in Europe
The European remote sensing satellite market has demonstrated steady development, registering approximately 3% growth annually from 2019 to 2024. The market is characterized by strong collaboration between various European nations, with Russia, France, Germany, and the United Kingdom emerging as key players in the region. The European Space Agency (ESA) plays a crucial role in coordinating space activities and fostering technological innovation across member states. The region's market is distinguished by its focus on environmental monitoring, climate change research, and defense applications. European companies have developed significant expertise in manufacturing high-resolution Earth observation satellites and advanced sensor technologies. The market benefits from robust government support, particularly in France, which maintains one of the world's largest space program budgets. The region's emphasis on sustainable space practices and the development of reusable technology has created a unique market environment that balances innovation with environmental responsibility. The presence of established aerospace companies and emerging space startups has created a dynamic ecosystem that continues to drive market evolution.
Remote Sensing Satellites Market in North America
The North American remote sensing market is projected to grow at approximately 9% annually from 2024 to 2029, driven primarily by the United States' advanced technological capabilities and robust space program. The region's market is characterized by strong collaboration between government agencies, military organizations, and commercial entities. The presence of major aerospace companies and innovative startups has created a highly competitive and dynamic market environment. The United States maintains its position as a global leader through continuous investment in cutting-edge satellite technology and applications. The market benefits from substantial government funding, particularly through agencies like NASA and the Department of Defense. Commercial applications continue to expand, with an increasing focus on areas such as precision agriculture, urban planning, and environmental monitoring. The region's emphasis on developing smaller, more cost-effective satellites while maintaining high-performance capabilities has created new opportunities for market growth. Canada's contributions to the market, particularly in radar satellite technology and Earth observation systems, further strengthen North America's position in the global remote sensing industry.
Remote Sensing Satellites Market in Rest of World
The Rest of World market, encompassing regions such as the Middle East, Africa, and South America, represents an emerging opportunity in the global satellite market industry. The Middle East and Africa region is positioned to become increasingly attractive for low-cost remote sensing services providers, driven by growing demand for satellite-based communications and Earth observation services. South America has emerged as a significant hub for satellite-related activities, with regional fleet operators actively upgrading their satellite capacity to meet increasing demand. The geographical advantages of launch sites in these regions have fostered strategic cooperation between countries, contributing to the development of regional satellite manufacturing and infrastructure capabilities. These regions are characterized by growing investment in space technology, increasing participation in international space projects, and rising demand for applications such as agricultural monitoring, resource management, and telecommunications. The market is witnessing increased collaboration between local organizations and established global players, facilitating technology transfer and capacity building in these regions.

Competitive Landscape
Top Companies in Remote Sensing Satellites Market
The remote sensing satellites market is characterized by continuous product innovation among major players, with companies focusing on developing advanced satellite technologies and expanding their satellite constellations. Companies are actively pursuing strategic partnerships and collaborations to enhance their technological capabilities and market presence, particularly in emerging applications like Earth observation and climate monitoring. Operational agility is demonstrated through rapid satellite deployment capabilities and flexible launch services. Market leaders are expanding their global footprint through regional offices and manufacturing facilities, while also investing in state-of-the-art research and development centers. The industry witnesses regular product launches of next-generation satellites with improved capabilities in areas such as imaging resolution, data processing, and communication systems.
Government-Backed Players Lead Market Development Trends
The remote sensing satellite market is dominated by large government-backed organizations and established aerospace conglomerates, with companies like CASC, Lockheed Martin, and Roscosmos holding significant market positions. These dominant players benefit from long-standing relationships with government agencies and military organizations, which provide them with stable revenue streams and opportunities for technological advancement. The market shows moderate consolidation, with major players leveraging their extensive manufacturing capabilities and technological expertise to maintain their market positions.
The industry is characterized by strategic partnerships rather than outright acquisitions, as companies focus on combining complementary capabilities to address specific market needs. Joint ventures and collaborative agreements are common, particularly in developing new satellite technologies and sharing launch infrastructure. Regional players, especially in Asia-Pacific, are gradually expanding their presence through government support and increased investment in space technology, leading to a more diverse competitive landscape.
Innovation and Partnerships Drive Future Growth
Success in the remote sensing industry increasingly depends on developing cost-effective solutions while maintaining high-quality performance standards. Companies need to focus on building comprehensive end-to-end solutions that include not just satellite manufacturing but also data analytics and ground station services. The ability to offer customized solutions for specific applications, such as environmental monitoring or defense surveillance, while maintaining operational efficiency will be crucial for market success. Regulatory compliance and security certifications are becoming increasingly important as governments worldwide implement stricter controls on space activities.
For new entrants and smaller players, success lies in identifying and serving niche market segments while building strategic partnerships with established players. Companies must invest in developing proprietary technologies and intellectual property to differentiate themselves in the remote sensing market. The growing demand for commercial applications presents opportunities for specialized service providers, particularly in data analytics and value-added services. Building strong relationships with government agencies and participating in national space programs remains crucial for long-term success, while maintaining flexibility to adapt to changing market demands and technological advancements.
Remote Sensing Satellites Industry Leaders
China Aerospace Science and Technology Corporation (CASC)
Japan Aerospace Exploration Agency (JAXA)
Lockheed Martin Corporation
Northrop Grumman Corporation
ROSCOSMOS
- *Disclaimer: Major Players sorted in no particular order


Recent Industry Developments
- March 2023: The Japan Aerospace Exploration Agency (JAXA) had scheduled the launch of the first H3 Launch Vehicle with the Advanced Land Observing Satellite "Daichi 3" (ALOS-3) onboard from the Tanegashima Space Center.
- February 2023: NASA and geographic information service provider Esri will grant wider access to the space agency’s geospatial content for research and exploration purposes through the Space Act Agreement.
- January 2023: Airbus Defence and Space has signed a contract with Poland to provide a geospatial intelligence system including the development, manufacture, launch and delivery in orbit of two high-performance optical Earth observation satellites.


Global Remote Sensing Satellites Market Report Scope
10-100kg, 100-500kg, 500-1000kg, Below 10 Kg, above 1000kg are covered as segments by Satellite Mass. GEO, LEO, MEO are covered as segments by Orbit Class. Propulsion Hardware and Propellant, Satellite Bus & Subsystems, Solar Array & Power Hardware, Structures, Harness & Mechanisms are covered as segments by Satellite Subsystem. Commercial, Military & Government are covered as segments by End User. Asia-Pacific, Europe, North America are covered as segments by Region.| 10-100kg |
| 100-500kg |
| 500-1000kg |
| Below 10 Kg |
| above 1000kg |
| GEO |
| LEO |
| MEO |
| Propulsion Hardware and Propellant |
| Satellite Bus & Subsystems |
| Solar Array & Power Hardware |
| Structures, Harness & Mechanisms |
| Commercial |
| Military & Government |
| Other |
| Asia-Pacific |
| Europe |
| North America |
| Rest of World |
| Satellite Mass | 10-100kg |
| 100-500kg | |
| 500-1000kg | |
| Below 10 Kg | |
| above 1000kg | |
| Orbit Class | GEO |
| LEO | |
| MEO | |
| Satellite Subsystem | Propulsion Hardware and Propellant |
| Satellite Bus & Subsystems | |
| Solar Array & Power Hardware | |
| Structures, Harness & Mechanisms | |
| End User | Commercial |
| Military & Government | |
| Other | |
| Region | Asia-Pacific |
| Europe | |
| North America | |
| Rest of World |


Market Definition
- Application - Various applications or purposes of the satellites are classified into communication, earth observation, space observation, navigation, and others. The purposes listed are those self-reported by the satellite’s operator.
- End User - The primary users or end users of the satellite is described as civil (academic, amateur), commercial, government (meteorological, scientific, etc.), military. Satellites can be multi-use, for both commercial and military applications.
- Launch Vehicle MTOW - The launch vehicle MTOW (maximum take-off weight) means the maximum weight of the launch vehicle during take-off, including the weight of payload, equipment and fuel.
- Orbit Class - The satellite orbits are divided into three broad classes namely GEO, LEO, and MEO. Satellites in elliptical orbits have apogees and perigees that differ significantly from each other and categorized satellite orbits with eccentricity 0.14 and higher as elliptical.
- Propulsion tech - Under this segment, different types of satellite propulsion systems have been classified as electric, liquid-fuel and gas-based propulsion systems.
- Satellite Mass - Under this segment, different types of satellite propulsion systems have been classified as electric, liquid-fuel and gas-based propulsion systems.
- Satellite Subsystem - All the components and subsystems which includes propellants, buses, solar panels, other hardware of satellites are included under this segment.
| Keyword | Definition |
|---|---|
| Attitude Control | The orientation of the satellite relative to the Earth and the sun. |
| INTELSAT | The International Telecommunications Satellite Organization operates a network of satellites for international transmission. |
| Geostationary Earth Orbit (GEO) | Geostationary satellites in Earth orbit 35,786 km (22,282 mi) above the equator in the same direction and at the same speed as the earth rotates on its axis, making them appear fixed in the sky. |
| Low Earth Orbit (LEO) | Low Earth Orbit satellites orbit from 160-2000km above the earth, take approximately 1.5 hours for a full orbit and only cover a portion of the earth’s surface. |
| Medium Earth Orbit (MEO) | MEO satellites are located above LEO and below GEO satellites and typically travel in an elliptical orbit over the North and South Pole or in an equatorial orbit. |
| Very Small Aperture Terminal (VSAT) | Very Small Aperture Terminal is an antenna that is typically less than 3 meters in diameter |
| CubeSat | CubeSat is a class of miniature satellites based on a form factor consisting of 10 cm cubes. CubeSats weigh no more than 2 kg per unit and typically use commercially available components for their construction and electronics. |
| Small Satellite Launch Vehicles (SSLVs) | Small Satellite Launch Vehicle (SSLV) is a three-stage Launch Vehicle configured with three Solid Propulsion Stages and a liquid propulsion-based Velocity Trimming Module (VTM) as a terminal stage |
| Space Mining | Asteroid mining is the hypothesis of extracting material from asteroids and other asteroids, including near-Earth objects. |
| Nano Satellites | Nanosatellites are loosely defined as any satellite weighing less than 10 kilograms. |
| Automatic Identification System (AIS) | Automatic identification system (AIS) is an automatic tracking system used to identify and locate ships by exchanging electronic data with other nearby ships, AIS base stations, and satellites. Satellite AIS (S-AIS) is the term used to describe when a satellite is used to detect AIS signatures. |
| Reusable launch vehicles (RLVs) | Reusable launch vehicle (RLV) means a launch vehicle that is designed to return to Earth substantially intact and therefore may be launched more than one time or that contains vehicle stages that may be recovered by a launch operator for future use in the operation of a substantially similar launch vehicle. |
| Apogee | The point in an elliptical satellite orbit which is farthest from the surface of the earth. Geosynchronous satellites which maintain circular orbits around the earth are first launched into highly elliptical orbits with apogees of 22,237 miles. |


Research Methodology
Mordor Intelligence follows a four-step methodology in all our reports.
- Step-1: Identify Key Variables: In order to build a robust forecasting methodology, the variables and factors identified in Step-1 are tested against available historical market numbers. Through an iterative process, the variables required for market forecast are set and the model is built on the basis of these variables.
- Step-2: Build a Market Model: Market-size estimations for the historical and forecast years have been provided in revenue and volume terms. For sales conversion to volume, the average selling price (ASP) is kept constant throughout the forecast period for each country, and inflation is not a part of the pricing.
- Step-3: Validate and Finalize: In this important step, all market numbers, variables and analyst calls are validated through an extensive network of primary research experts from the market studied. The respondents are selected across levels and functions to generate a holistic picture of the market studied.
- Step-4: Research Outputs: Syndicated Reports, Custom Consulting Assignments, Databases & Subscription Platforms.


