LEO Satellite Market Size and Share
Market Overview
| Study Period | 2019 - 2031 |
|---|---|
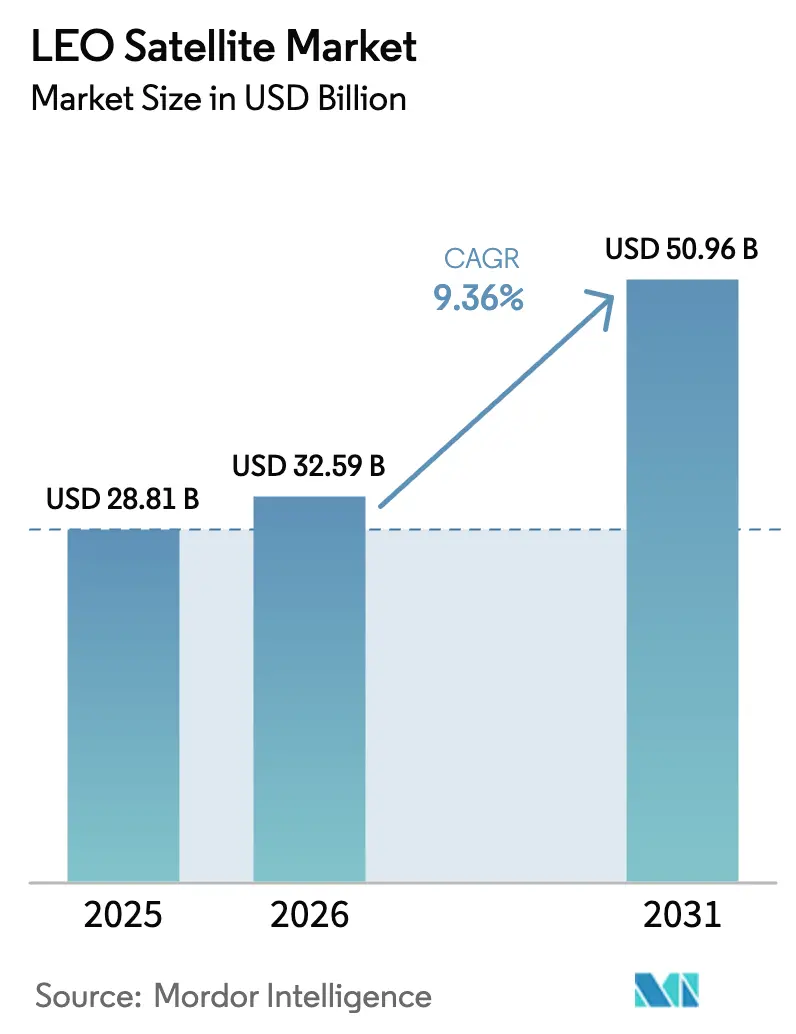
| Market Size (2026) | USD 32.59 Billion |
| Market Size (2031) | USD 50.96 Billion |
| Growth Rate (2026 - 2031) | 9.36% CAGR |
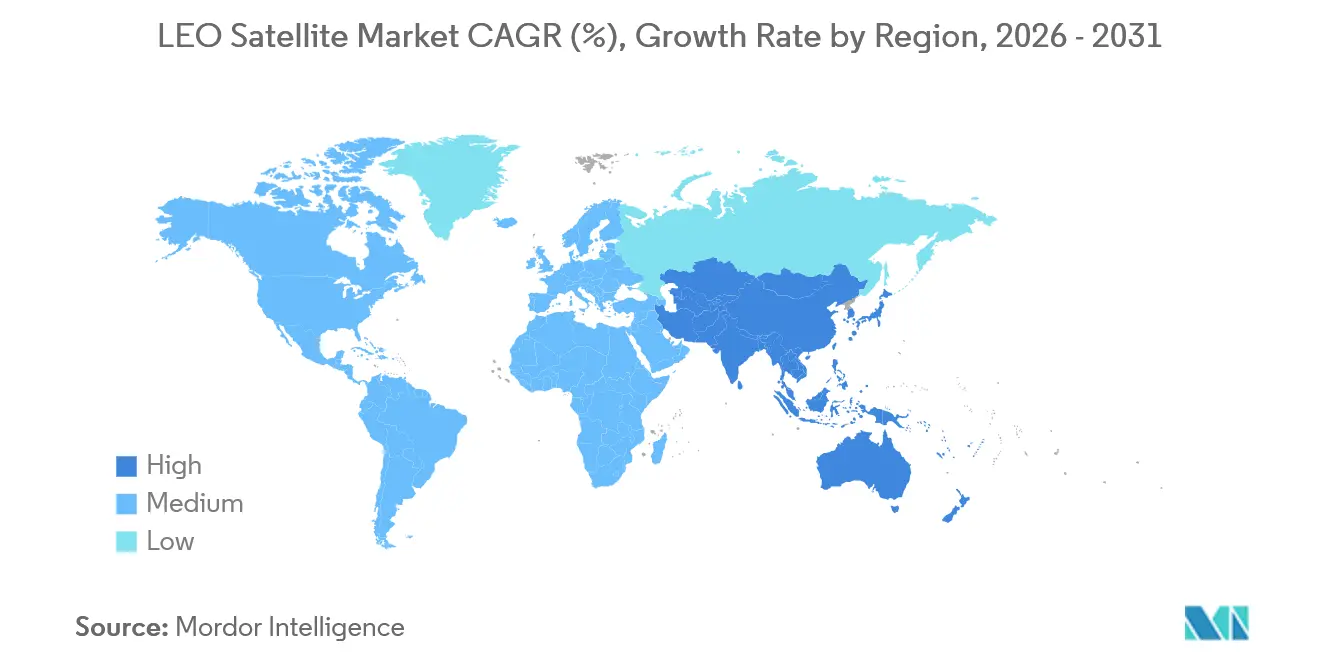
| Fastest Growing Market | Asia Pacific |
| Largest Market | North America |
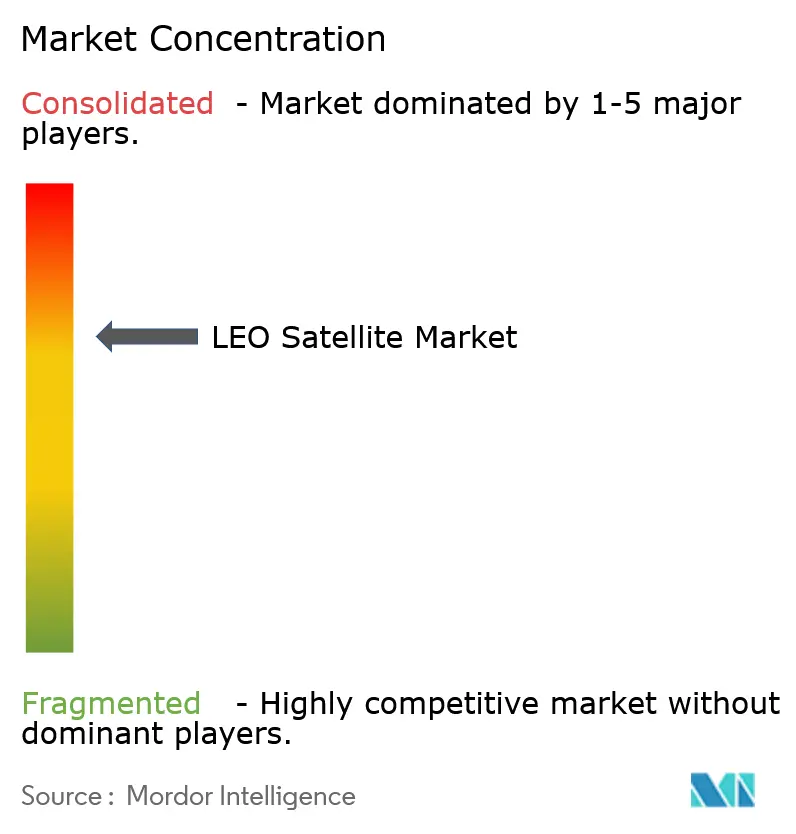
| Market Concentration | Medium |
Major Players *Disclaimer: Major Players sorted in no particular order Image © Mordor Intelligence. Reuse requires attribution under CC BY 4.0. | |
LEO Satellite Market Analysis by Mordor Intelligence
The LEO satellite market size is expected to grow from USD 28.81 billion in 2025 to USD 32.59 billion in 2026 and is forecast to reach USD 50.96 billion by 2031 at 9.36% CAGR over 2026-2031. Solid subscriber growth for Constellation Broadband, new defense programs that rely on proliferated spacecraft, and declining launch costs are the dominant growth catalysts. Competition is intensifying as vertically-integrated operators prove they can monetize mass-market connectivity, which pushes prices down and accelerates adoption. Regulations are tightening on orbital debris, yet they also create demand for sustainable platforms and in-orbit services. Supply-chain localization and additive manufacturing further compress cycle times, letting newcomers enter faster and diversifying revenue streams across the LEO satellite market.
Key Report Takeaways
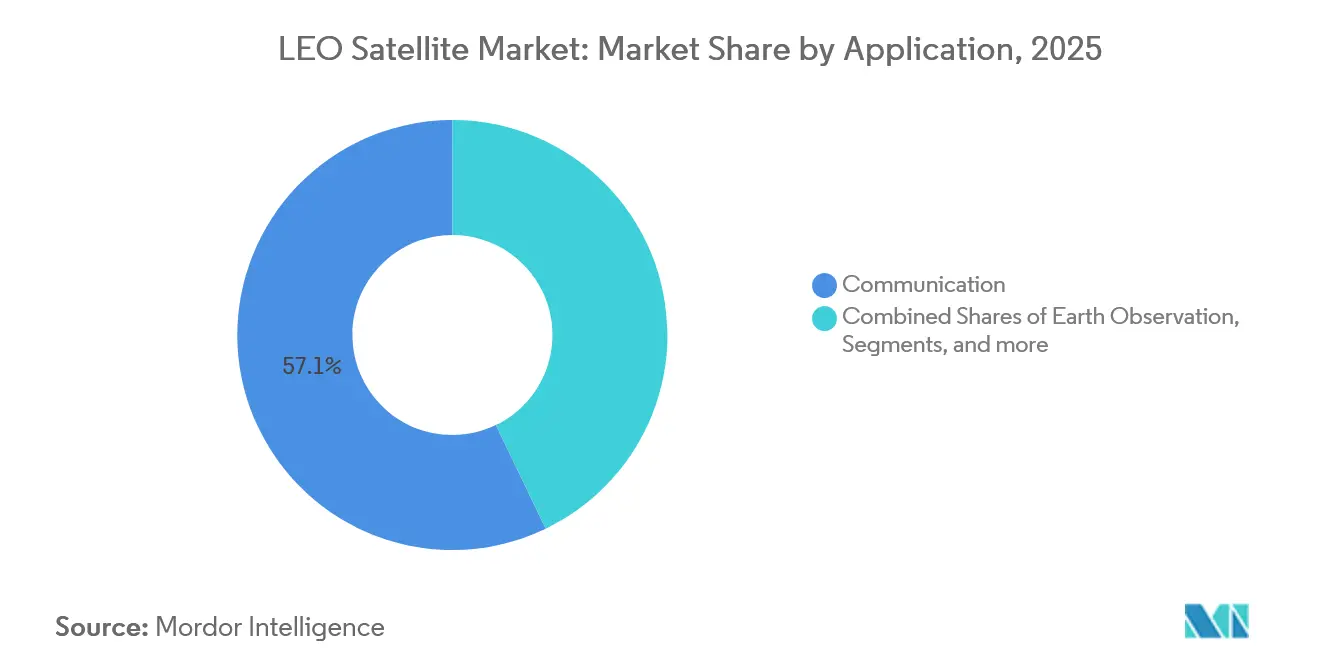
- By application, communication services led the LEO satellite market with a 57.1% share in 2025, while Earth observation is expected to expand at a 10.3% CAGR through 2031.
- By satellite mass, the 10–100 kg class accounted for 47.5% of the LEO satellite market size in 2025, and the sub-10 kg class is predicted to advance at an 8.6% CAGR between 2026 and 2031.
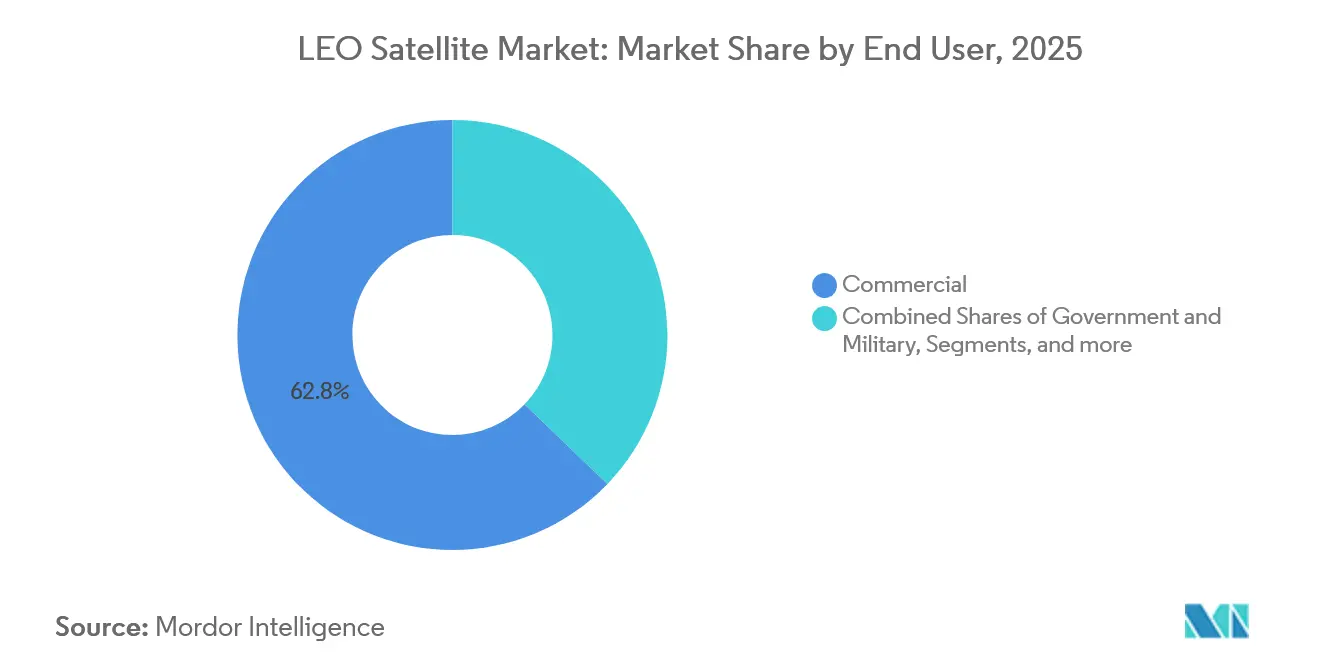
- By end user, commercial operators held 62.8% of the LEO satellite market in 2025; government and military demand is rising fastest at a 9.8% CAGR through 2031.
- By propulsion technology, electric systems captured 58.3% of the LEO satellite market share in 2025 and are expected to increase at a 9.2% CAGR through 2031.
- By geography, North America commanded a 68.6% share of the LEO satellite market size in 2025, while the Asia-Pacific region is projected to expand at a 9.12% CAGR through 2031.
Note: Market size and forecast figures in this report are generated using Mordor Intelligence’s proprietary estimation framework, updated with the latest available data and insights as of January 2026.
Global LEO Satellite Market Trends and Insights
Driver Impact Analysis*
| Driver | (~) % Impact on CAGR Forecast | Geographic Relevance | Impact Timeline |
|---|---|---|---|
| Rising demand for global broadband connectivity | +2.8% | Global; early gains in North America and APAC rural markets | Medium term (2-4 years) |
| Surge in government and defense spending on resilient SATCOM | +2.1% | North America and EU; spill-over to APAC | Short term (≤2 years) |
| Falling launch and manufacturing costs due to reusability | +1.9% | Global | Long term (≥4 years) |
| Direct-to-device standards unlocking mass-market handsets | +1.5% | Global; early adoption in North America and EU | Medium term (2-4 years) |
| Proliferation of edge/AI processing reducing down-link bandwidth | +1.2% | Global | Long term (≥4 years) |
| Rapid build-out of optical inter-satellite-link mesh networks | +0.9% | Global | Medium term (2-4 years) |
| Source: Mordor Intelligence | |||
Rising Demand for Global Broadband Connectivity
Constellation operators have demonstrated that low-latency satellite internet can achieve speeds exceeding 100 Mbps in rural communities and on mobile platforms.[1]Gwynne Shotwell, “Starlink Constellation,” SpaceX, spacex.com This success reshapes infrastructure plans for maritime, aviation, and emergency response agencies, as they can now operate beyond terrestrial coverage. Newly finalized 3GPP non-terrestrial network specifications enable mobile carriers to integrate satellites into 5G cores, extending revenue per user without costly tower deployments. As handset makers preload satellite messaging functions, uptake accelerates among consumers who previously ignored satellite gear. Governments support the rollout as part of digital-inclusion programs that treat broadband as a universal service obligation. These forces combine to widen addressable demand and lift service penetration across the LEO satellite market.
Surge in Government and Defense Spending on Resilient SATCOM
Military planners recognize that proliferated LEO layers add survivability because no single spacecraft becomes a critical node.[2]United States Space Force, “Proliferated Warfighter Space Architecture Awards,” spaceforce.mil The US Space Development Agency’s tranche contracts seed hundreds of small satellites for secure communications and missile-warning networks at a unit price far below traditional GEO platforms. European ministries fund parallel programs such as EMISSARY and IRIS² to secure autonomous connectivity while stimulating local industry.[3]European Commission, “A Vision for the European Space Economy,” europa.eu Rapid procurement models favor commercial-off-the-shelf buses that can be refreshed every few years, driving recurrent production orders. As allied nations harmonize standards for interoperable payloads, cross-border constellation sharing gains momentum. The resulting spending cycle grants near-term tailwinds to manufacturers across the LEO satellite market.
Falling Launch and Manufacturing Costs Due to Reusability
Reusable boosters reduced average launch cost from USD 10,000 per kg in 2020 to under USD 3,000 for LEO missions by 2024.[4]European Space Agency, “Report on the Space Economy 2024,” ESA, esa.int Lower cost per slot makes thousands-of-satellite architectures economically rational, pushing the business case from experimental to mainstream. Factory automation, software-defined payloads, and common-bus designs shortened build schedules and trimmed small-satellite unit cost by up to 50%. Rideshare services and transfer vehicles maximize manifest utilization, allowing operators to deploy diverse payloads at a marginal incremental cost. Planned heavy-lift vehicles promise another order-of-magnitude improvement, which would extend volume production at automotive-style scales. These structural savings cascade through the LEO satellite market, freeing capital for service upgrades and customer-premise equipment subsidies.
Direct-to-Device (D2D) Standards Unlocking Mass-Market Handsets
3GPP Release 17 established uplink grant-free waveforms, timing-advance methods, and mobility procedures for hand-held devices that connect directly to satellites. Field tests validated bi-directional 5G calls from an unmodified smartphone, eliminating the cost barrier of dedicated terminals. Ultra-large array antennas aboard satellites synthesize thousands of steerable beams, each adjusted in real-time with adaptive algorithms to counter fast Doppler shifts. Dynamic spectrum partitioning enables satellites to utilize terrestrial carrier blocks without causing harmful interference, thereby expanding the usable bandwidth. With billions of existing smartphones addressable, service providers can scale user counts faster than earlier satellite phone attempts. D2D thus injects a sizable consumer segment into the LEO satellite market.
Restraint Impact Analysis*
| Restraint | (~) % Impact on CAGR Forecast | Geographic Relevance | Impact Timeline |
|---|---|---|---|
| Escalating space-debris collision risk and stricter disposal rules | -1.80% | Global | Short term (≤2 years) |
| Spectrum-sharing conflicts with terrestrial 5G/6G incumbents | -1.20% | Global; acute in EU and APAC dense urban areas | Medium term (2-4 years) |
| High terminal cost hindering adoption in low-income regions | -0.90% | APAC, MEA, Latin America | Long term (≥4 years) |
| Talent and specialized-component supply-chain shortages | -0.70% | Global; concentrated in North America and EU | Medium term (2-4 years) |
| Source: Mordor Intelligence | |||
Escalating Space-Debris Collision Risk and Stricter Disposal Rules
Active satellites must dodge more objects as legacy spacecraft, rocket bodies, and fragments populate popular altitudes. Revised ITU and national guidelines shorten post-mission disposal deadlines, requiring operators to carry sufficient propulsion for reliable deorbiting. Compliance adds mass and cost, which can erode payload margins. Regulators are drafting monetary penalties that target non-performing spacecraft, raising financial exposure for under-capitalized ventures. Insurance premiums have already trended upward because actuarial models incorporate elevated collision probabilities. Mitigation technologies, such as drag sails and autonomous debris capture, remain in the early stages; therefore, capacity constraints may arise in the short term across the LEO satellite market.
Spectrum-Sharing Conflicts with Terrestrial 5G/6G Incumbents
NTN rules allow satellites to reuse mobile spectrum, yet coexistence in dense cities poses interference risk if handset power control or beam management falters. Regional regulators weigh exclusive satellite allocations against dynamic-sharing frameworks, creating uncertainty for business plans. Commercial mobile operators lobby for primary rights, fearing diminished quality of experience for ground networks. Prolonged negotiations have slowed the rollout of mass-market satellite messaging features, especially in Europe and parts of Asia, where spectrum auctions fund fiscal budgets. The pace at which harmonized coexistence schemes emerge will influence near-term adoption in urban pockets of the LEO satellite market.
*Our forecasts treat driver/restraint impacts as directional, not additive. The impact forecasts reflect baseline growth, mix effects, and variable interactions.
Segment Analysis
By Application: Communication Dominance Drives Market Evolution
Communication services accounted for 57.1% of the LEO satellite market share in 2025, validating the commercial pivot from technology demonstration to mass-market broadband. Subscriber growth surpasses 2 million households, as well as cruise ships and aircraft, that enjoy fiber-like latency. The LEO satellite market size for communication is forecast to expand at a 10.3% CAGR as multi-orbital roaming and direct-to-device messaging attract new segments. Competitive intensity rises as new fleets launch, yet cumulative throughput demand keeps capacity in rural corridors sold out. Scaling factors favor vertically-integrated players that control launch, spacecraft, and ground software, enabling rapid service updates.
Earth observation is the second-largest application, boosted by rapid-revisit imagery for crop analytics, urban planning, and climate compliance. Governments integrate real-time optical and radar feeds into disaster response, while insurers pay for high-frequency monitoring of industrial assets. Navigation augmentation in LEO enhances position accuracy to sub-meter levels in urban canyons. Space-science payloads and in-orbit manufacturing occupy a niche today but provide test beds for quantum communications and space-based solar power. As these technologies mature, they will add diverse revenue streams to the LEO satellite market.


By Satellite Mass: Mid-Range Platforms Balance Capability and Economics
Satellites weighing 10-100 kg captured 47.5% of the LEO satellite market in 2025, a sweet spot where standard CubeSat frames can accommodate larger solar arrays, high-gain antennas, and propulsion modules. The class benefits from rideshare launches that lift dozens of units at once, distributing launch overhead across many payloads. The sub-10 kg category leads growth at an 8.6% CAGR as universities and startups fly precursor missions to validate hardware. Pocket-Qube platforms reach developing nations with modest budgets, broadening participation.
The 100–500 kg range serves high-throughput nodes in broadband constellations, as larger solar wings feed multi-beam phased arrays. Buses weighing up to 1,000 kg carry optical links, digital channelizers, and multiple hosted payloads, trading higher launch costs for capacity that amortizes over vast subscriber pools. Projects above 1,000 kg await next-generation heavy lifters, which promise lower per-kilogram cost and relaxed fairing constraints. Automated panel folding, 3-D-printed thruster assemblies, and machine-vision quality checks streamline production lines across all mass classes, reinforcing volume economics in the LEO satellite market.
By End-User: Commercial Sector Leads Market Transformation
Commercial operators held 62.8% of the LEO satellite market share in 2025, an outcome of venture financing and agile production cycles that target broadband and data analytics customers. Cloud providers bundle satellite downlinks into edge-compute regions, easing integration for developers and boosting data-egress revenue. Agriculture, energy, and logistics firms subscribe to analytics feeds rather than owning space assets, which accelerates service adoption. Open application programming interfaces allow third parties to monetize derivative products, adding layered income streams.
Government and military buyers remain critical for early anchor tenancy, especially where secure networks with assured access are essential. Rising geopolitical tensions elevate budget priority for missile-warning and resilient command links. Civil agencies procure high-resolution imagery for environmental regulation and border surveillance. Academic institutions and international organizations occupy the “Other” end-user bucket, flying technology pathfinders and scientific instruments that pave the way for next-generation services. Together, these user groups diversify demand and stabilize cash flows within the LEO satellite market.
By Propulsion Technology: Electric Systems Enable Efficient Operations
Electric propulsion accounted for 58.3% of the LEO satellite market size in 2025 because Hall-effect and ion thrusters extend mission life without a proportional mass penalty. Precise thrust vectors let constellation managers adjust planes for phasing, collision avoidance, and end-of-life disposal. System designers integrate solar array wings and power-processing units so that thruster duty cycles align with orbit night-day patterns. Liquid chemical engines remain common for launch vehicle injection errors and emergency maneuvers that need high thrust quickly. Gas-based cold-gas or water-vapor systems address nanosat attitude control and safe deorbit on pico-payloads.
Advances in cathode longevity, high-voltage processing, and xenon alternatives reduce cost per Newton-second. Electric units now scale down to CubeSat volumes, broadening adoption at the low-mass end. As collision-avoidance rules tighten, precise delta-V capability becomes essential, driving further shift toward electric systems. These technology dynamics reinforce the operational efficiency narrative that underpins long-term competitiveness in the LEO satellite market.
Geography Analysis
North America commanded 68.6% of the global LEO satellite market in 2025. Favorable Federal Communications Commission licensing, deep venture capital pools, and established launch pads in Florida, California, and Alaska create an end-to-end ecosystem. The US government service contracts underpin early demand for secure broadband and sensor payload hosting. Canada supplies phased-array antennas and software-defined ground gateways, further anchoring regional dominance. Momentum will persist as integrated launch-manufacturing-service models continue to iterate on hardware and pricing.
The Asia-Pacific region is the fastest-growing, with a 9.1% CAGR projected through 2031. National champions in China deploy prominent constellations under a state-led digital infrastructure mandate. India liberalized launch and frequency assignment rules, drawing private investment into satellite production clusters. Japan funds dual-use research and development that aligns civil disaster relief with defense postures, while South Korea and Australia specialize in ground-segment cybersecurity and optical terminal testbeds. Regional cooperation on spectrum and orbital-slot filings emerges to avoid mutual interference as fleets multiply.
Europe holds a roughly 15% share but is intent on achieving strategic autonomy. The IRIS² public–private partnership funds up to 290 satellites equipped with optical inter-satellite links to secure continental routing. National agencies offer zero-debris design grants that promote green propulsion research. The Ariane 6 maiden flight restored competitive launch pricing for European customers, though volume remains lower than in the United States. Regulatory harmonization across member states aims to shorten licensing cycles, a prerequisite for scaling production - collective industrial depth positions Europe for leadership in sustainable platforms within the LEO satellite market.
The rest of the world includes Latin America, the Middle East, and Africa, where unserved connectivity zones and remote industrial operations drive demand. Operators deploy community gateways and pay-as-you-go data models to address affordability. National space agencies in Brazil and the United Arab Emirates invest in small-sat programs to build domestic talent pipelines. Africa benefits from ground-station hosting revenue and high-throughput backhaul services that leapfrog fiber limitations. These dynamics collectively expand the global footprint of the LEO satellite market.

Competitive Landscape
The LEO satellite market exhibits moderate concentration as vertically integrated pioneers face a widening field of entrants. One operator combines in-house boosters, mass-produced spacecraft, and consumer hardware, which yields unmatched cost control and speed-to-orbit. Competitors answer with cloud-backed ground-segment software, retail distribution muscle, and strategic supplier investments to replicate scale economics. Integrated launch availability remains a bottleneck for late movers, spurring partnerships with emerging reusable rockets that promise 1-day turnaround cycles.
Software-defined payloads shift competitive advantage toward firmware updates and network-management algorithms rather than physical redesigns. Startups specializing in onboard AI analytics license edge-compute stacks to constellation owners and carve out royalty streams. European primes develop zero-debris buses and electric-propulsion kits aligned with forthcoming disposal mandates, differentiating on sustainability. Government contracts stipulate open interfaces that prevent vendor lock-in, encouraging multi-supplier fleets and secondary-market refurbishment businesses.
Mergers and minority investments target optical terminal makers, high-rate Ka-band amplifier suppliers, and secure authentication chipset vendors. Intellectual-property portfolios focusing on beam-forming ASICs and dynamic routing software command premium multiples. Ecosystem fragmentation remains at a mid-level, with the top five operators controlling just under 60% of active satellites, leaving room for specialized providers in Earth observation, Internet of Things (IoT) relays, and in-orbit servicing niches. Such dynamics maintain high innovation velocity while deterring monopolistic behavior in the LEO satellite market.
LEO Satellite Industry Leaders
Space Exploration Technologies Corp.
Eutelsat S.A.
Planet Labs PBC
Iridium Communications Inc.
Spire Global, Inc.
- *Disclaimer: Major Players sorted in no particular order

Recent Industry Developments
- August 2025: EchoStar Corporation selected MDA Space Ltd. as the prime contractor for its new non-terrestrial network (NTN) satellite constellation. MDA, a trusted partner in the swiftly growing global space sector, is set to play a pivotal role in EchoStar's ambitious project.
- June 2025: The European Space Agency (ESA) announced that the inaugural launch of its two LEO-PNT satellites is slated for the latter half of December 2025. The launch will utilize a Rocket Lab Electron vehicle, taking off from New Zealand.
- April 2025: SpinLaunch selected Kongsberg NanoAvionics ('KONGSBERG') as the exclusive satellite supplier for its Meridian Space broadband communication constellation, positioned in low Earth orbit (LEO).


Global LEO Satellite Market Report Scope
Low Earth orbit (LEO) satellite systems cover spacecraft, launch vehicles, ground gateways, user terminals, and software platforms that provide broadband connectivity, Earth-observation imagery, positioning augmentation, scientific experimentation, and in-orbit services from altitudes between 160 km and 2,000 km. Core activities span satellite design and manufacturing, launch and early-orbit operations, constellation network management, data processing, and emerging in-orbit servicing, assembly, and debris-mitigation solutions.
The LEO satellite market is segmented by application, satellite mass, end-user, propulsion technology, and geography. By application, it includes communication, Earth observation, navigation, space science and technology demonstration, and other emerging uses. By satellite mass, it covers less than 10 kg, 10–100 kg, 100–500 kg, 500–1,000 kg, and greater than 1,000 kg classes. By end-user, the study considers commercial, government, military, and other institutional customers. By propulsion technology, it is divided into electric, gas-based, and liquid-fuel systems. Geographically, the analysis spans North America, Asia-Pacific, Europe, and the rest of the world. The report offers market size by value for all segments in USD Billion.
| Communication |
| Earth Observation |
| Navigation |
| Space Science and Tech-Demo |
| Others |
| Less than 10 kg |
| 10–100 kg |
| 100–500 kg |
| 500–1,000 kg |
| Greater than 1,000 kg |
| Commercial |
| Government and Military |
| Other |
| Electric |
| Gas Based |
| Liquid Fuel |
| North America | United States |
| Canada | |
| Asia-Pacific | China |
| India | |
| Japan | |
| South Korea | |
| Rest of the Asia-Pacific | |
| Europe | France |
| Germany | |
| United Kingdom | |
| Rest of Europe | |
| Rest of the World | Saudi Arabia |
| United Arab Emirates | |
| Rest of the World |
| By Application | Communication | |
| Earth Observation | ||
| Navigation | ||
| Space Science and Tech-Demo | ||
| Others | ||
| By Satellite Mass | Less than 10 kg | |
| 10–100 kg | ||
| 100–500 kg | ||
| 500–1,000 kg | ||
| Greater than 1,000 kg | ||
| By End-User | Commercial | |
| Government and Military | ||
| Other | ||
| By Propulsion Technology | Electric | |
| Gas Based | ||
| Liquid Fuel | ||
| By Geography | North America | United States |
| Canada | ||
| Asia-Pacific | China | |
| India | ||
| Japan | ||
| South Korea | ||
| Rest of the Asia-Pacific | ||
| Europe | France | |
| Germany | ||
| United Kingdom | ||
| Rest of Europe | ||
| Rest of the World | Saudi Arabia | |
| United Arab Emirates | ||
| Rest of the World | ||


Market Definition
- Application - Various applications or purposes of the satellites are classified into communication, earth observation, space observation, navigation, and others. The purposes listed are those self-reported by the satellite’s operator.
- End User - The primary users or end users of the satellite is described as civil (academic, amateur), commercial, government (meteorological, scientific, etc.), military. Satellites can be multi-use, for both commercial and military applications.
- Launch Vehicle MTOW - The launch vehicle MTOW (maximum take-off weight) means the maximum weight of the launch vehicle during take-off, including the weight of payload, equipment and fuel.
- Orbit Class - The satellite orbits are divided into three broad classes namely GEO, LEO, and MEO. Satellites in elliptical orbits have apogees and perigees that differ significantly from each other and categorized satellite orbits with eccentricity 0.14 and higher as elliptical.
- Propulsion tech - Under this segment, different types of satellite propulsion systems have been classified as electric, liquid-fuel and gas-based propulsion systems.
- Satellite Mass - Under this segment, different types of satellite propulsion systems have been classified as electric, liquid-fuel and gas-based propulsion systems.
- Satellite Subsystem - All the components and subsystems which includes propellants, buses, solar panels, other hardware of satellites are included under this segment.
| Keyword | Definition |
|---|---|
| Attitude Control | The orientation of the satellite relative to the Earth and the sun. |
| INTELSAT | The International Telecommunications Satellite Organization operates a network of satellites for international transmission. |
| Geostationary Earth Orbit (GEO) | Geostationary satellites in Earth orbit 35,786 km (22,282 mi) above the equator in the same direction and at the same speed as the earth rotates on its axis, making them appear fixed in the sky. |
| Low Earth Orbit (LEO) | Low Earth Orbit satellites orbit from 160-2000km above the earth, take approximately 1.5 hours for a full orbit and only cover a portion of the earth’s surface. |
| Medium Earth Orbit (MEO) | MEO satellites are located above LEO and below GEO satellites and typically travel in an elliptical orbit over the North and South Pole or in an equatorial orbit. |
| Very Small Aperture Terminal (VSAT) | Very Small Aperture Terminal is an antenna that is typically less than 3 meters in diameter |
| CubeSat | CubeSat is a class of miniature satellites based on a form factor consisting of 10 cm cubes. CubeSats weigh no more than 2 kg per unit and typically use commercially available components for their construction and electronics. |
| Small Satellite Launch Vehicles (SSLVs) | Small Satellite Launch Vehicle (SSLV) is a three-stage Launch Vehicle configured with three Solid Propulsion Stages and a liquid propulsion-based Velocity Trimming Module (VTM) as a terminal stage |
| Space Mining | Asteroid mining is the hypothesis of extracting material from asteroids and other asteroids, including near-Earth objects. |
| Nano Satellites | Nanosatellites are loosely defined as any satellite weighing less than 10 kilograms. |
| Automatic Identification System (AIS) | Automatic identification system (AIS) is an automatic tracking system used to identify and locate ships by exchanging electronic data with other nearby ships, AIS base stations, and satellites. Satellite AIS (S-AIS) is the term used to describe when a satellite is used to detect AIS signatures. |
| Reusable launch vehicles (RLVs) | Reusable launch vehicle (RLV) means a launch vehicle that is designed to return to Earth substantially intact and therefore may be launched more than one time or that contains vehicle stages that may be recovered by a launch operator for future use in the operation of a substantially similar launch vehicle. |
| Apogee | The point in an elliptical satellite orbit which is farthest from the surface of the earth. Geosynchronous satellites which maintain circular orbits around the earth are first launched into highly elliptical orbits with apogees of 22,237 miles. |


Research Methodology
Mordor Intelligence follows a four-step methodology in all our reports.
- Step-1: Identify Key Variables: In order to build a robust forecasting methodology, the variables and factors identified in Step-1 are tested against available historical market numbers. Through an iterative process, the variables required for market forecast are set and the model is built on the basis of these variables.
- Step-2: Build a Market Model: Market-size estimations for the historical and forecast years have been provided in revenue and volume terms. For sales conversion to volume, the average selling price (ASP) is kept constant throughout the forecast period for each country, and inflation is not a part of the pricing.
- Step-3: Validate and Finalize: In this important step, all market numbers, variables and analyst calls are validated through an extensive network of primary research experts from the market studied. The respondents are selected across levels and functions to generate a holistic picture of the market studied.
- Step-4: Research Outputs: Syndicated Reports, Custom Consulting Assignments, Databases & Subscription Platforms.


