Reusable Launch Vehicles Market Size and Share
Market Overview
| Study Period | 2019 - 2031 |
|---|---|
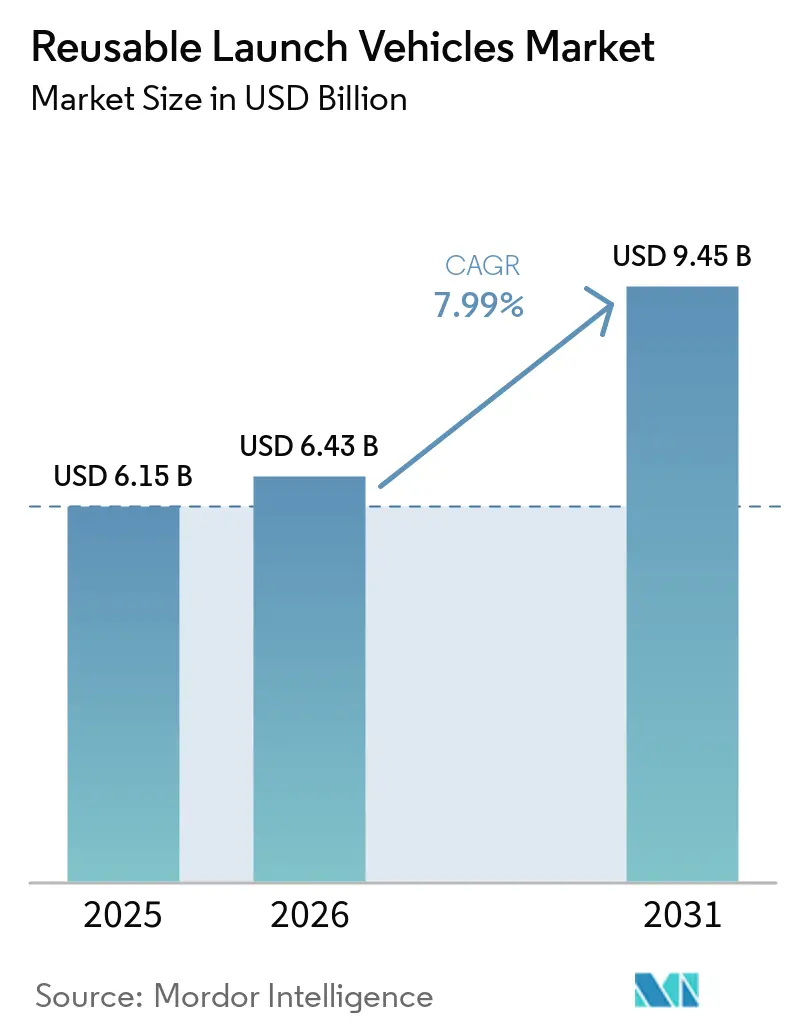
| Market Size (2026) | USD 6.43 Billion |
| Market Size (2031) | USD 9.45 Billion |
| Growth Rate (2026 - 2031) | 7.99% CAGR |
| Fastest Growing Market | Asia-Pacific |
| Largest Market | North America |
| Market Concentration | High |
Major Players *Disclaimer: Major Players sorted in no particular order Image © Mordor Intelligence. Reuse requires attribution under CC BY 4.0. | |
Reusable Launch Vehicles Market Analysis by Mordor Intelligence
The reusable launch vehicles market size was valued at USD 6.15 billion in 2025 and is estimated to grow from USD 6.43 billion in 2026 to USD 9.45 billion by 2031, at a CAGR of 7.99% during the forecast period (2026-2031). Growth stems from operators shifting away from expendable rockets toward hardware that can be recovered, refurbished, and reflown. Demonstrated booster life cycles of up to 40 missions with refurbishment costs below 10% of new‐build expenses have validated the economic upside. High-cadence constellation launches, steady government service contracts, and early demand for space tourism create persistent launch needs that favor assets capable of rapid turnaround. Manufacturing scale is improving as engine plants and vehicle assembly lines move toward automotive-style throughput, while gradual regulatory reforms shorten licensing timelines.
Key Report Takeaways
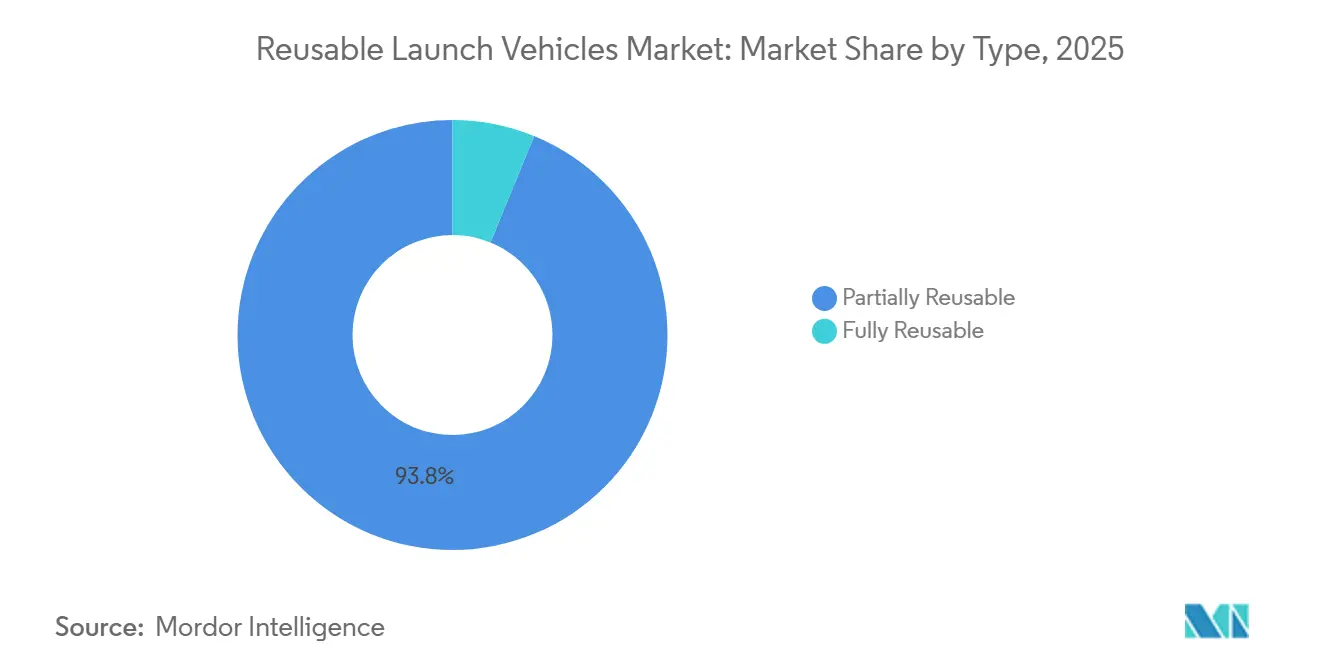
- By type, partially reusable systems held 93.80% of the reusable launch vehicles market share in 2025; fully reusable configurations are forecast to have the fastest growth at an 11.17% CAGR to 2031.
- By configuration, two-stage-to-orbit vehicles captured 88.90% of the revenue share in 2025 and are projected to grow at the highest CAGR of 8.17% through 2031.
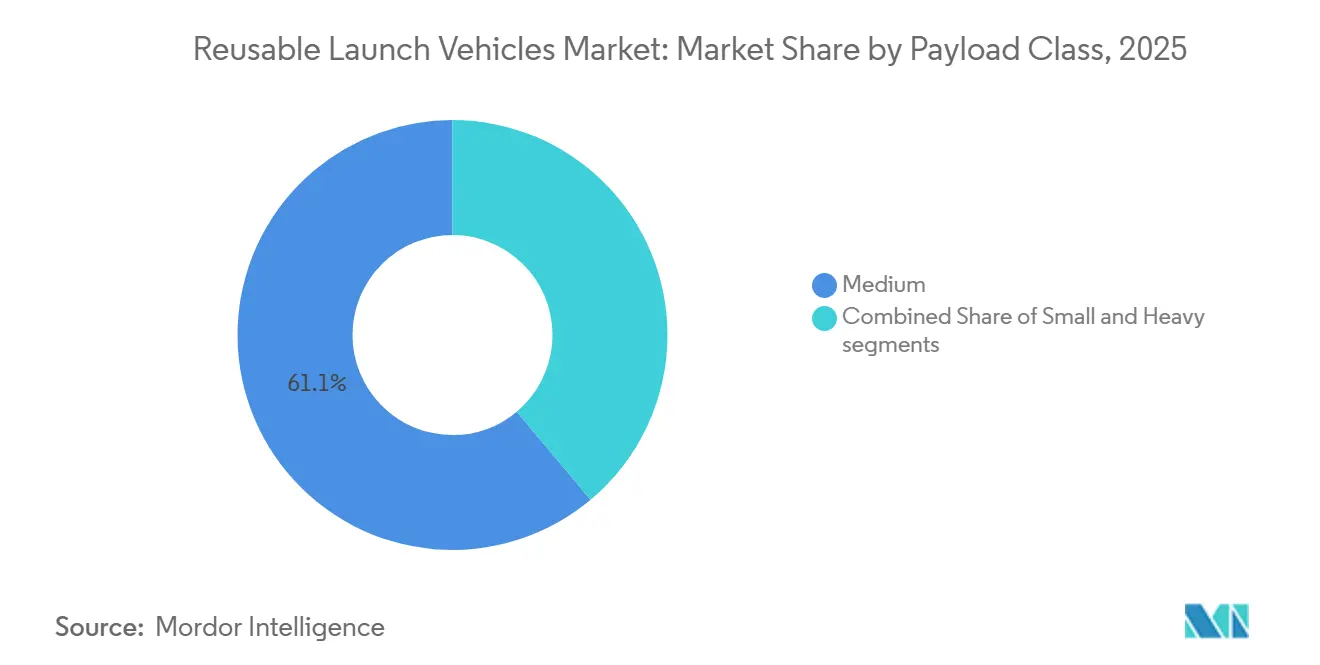
- By payload class, medium payloads accounted for 61.10% of the reusable launch vehicles market in 2025, while heavy-payload missions above 20,000 kg are forecast to expand at a 9.13% CAGR.
- By end user, the commercial segment led with 73.90% revenue share in 2025 and is forecast to grow at a 8.21% CAGR during the forecast period.
- By application, satellite deployment dominated the reusable launch vehicles market, accounting for 72.05% of the market size in 2025; the human spaceflight segment is projected to grow at a 9.17% CAGR.
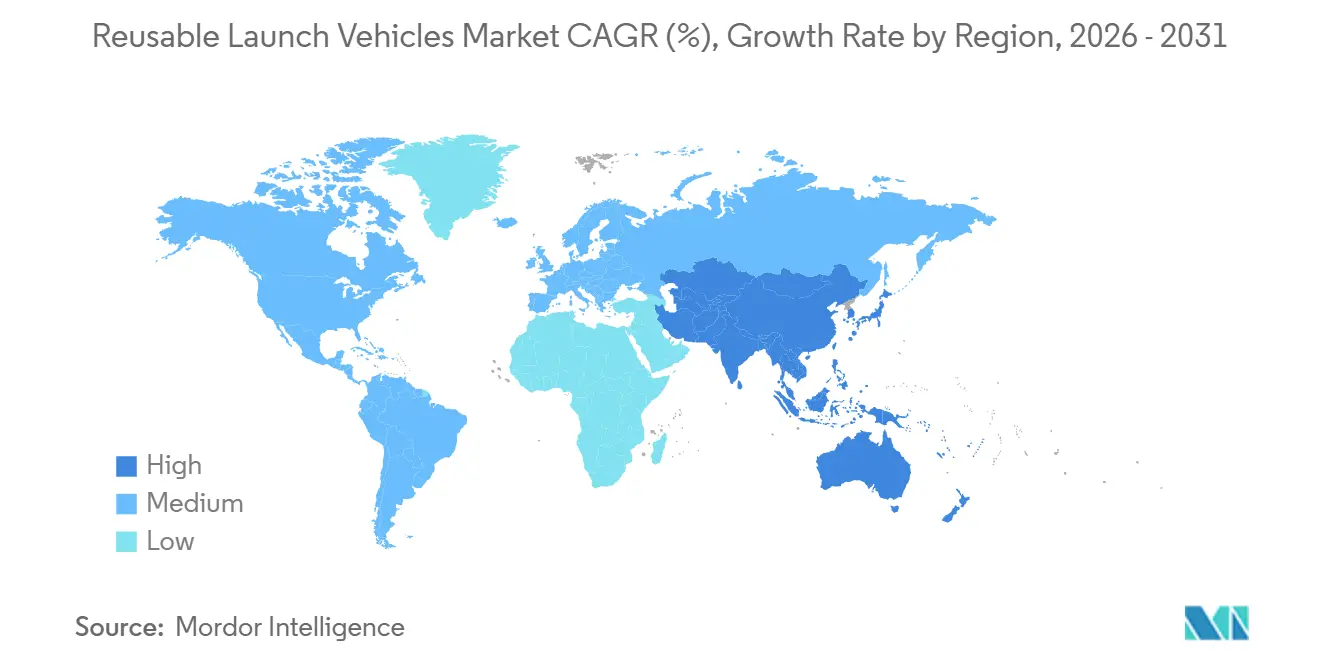
- By geography, North America commanded 83.61% market share in 2025; Asia-Pacific is projected to register the fastest growth at a 17.77% CAGR through 2031.
Note: Market size and forecast figures in this report are generated using Mordor Intelligence’s proprietary estimation framework, updated with the latest available data and insights as of 2026.
Global Reusable Launch Vehicles Market Trends and Insights
Drivers Impact Analysis*
| Driver | (~) % Impact on CAGR Forecast | Geographic Relevance | Impact Timeline |
|---|---|---|---|
| Cost-per-kg drop to less than USD 2,500 driven by booster reuse | +3.2% | Global, led by North America | Medium term (2-4 years) |
| Constellation boom demanding high-cadence launches | +2.8% | Global, concentrated in North America and Asia-Pacific | Short term (≤ 2 years) |
| Government and DoD multi-year service contracts | +2.1% | North America, expanding to allied nations | Medium term (2-4 years) |
| Emergence of heavy-lift fully reusable systems (Less than 100 tons) | +1.9% | North America, with Asia-Pacific following | Long term (≥ 4 years) |
| Venture-capital shift to "launch-on-demand" business models | +1.4% | Global, concentrated in North America and Europe | Medium term (2-4 years) |
| Certification of reused boosters for national-security payloads | +1.0% | North America, expanding to allied nations | Short term (≤ 2 years) |
| Source: Mordor Intelligence | |||
Cost-per-kg Drop to Less than USD 2,500 Driven by Booster Reuse
Reusable booster fleets are pushing average launch costs below the USD 2,500-per-kilogram threshold that once constrained many commercial missions. Marginal pricing falls as operators pivot to line-style engine production and standardized refurbishment procedures. These economics open new routes such as point-to-point cargo delivery and low-orbit logistics services that compete with premium air freight rates. Lower hardware emissions reinforce adoption by aligning with emerging environmental standards, creating a dual economic and sustainability benefit. The cost tipping point widens addressable demand across broadband, remote sensing, and in-space logistics.[1]Source: arXiv Authors, “Life-Cycle Emissions Comparison of Reusable and Expendable Rockets,” arxiv.org
Constellation Boom Demanding High-Cadence Launches
More than 400 commercial constellation projects are in various stages of build-out, yet fewer than one-fifth are actively launching. Each roll-out phase compresses into an 18- to 36-month window, forcing providers to seek vehicles able to fly weekly or even daily. Scheduled flights for national broadband networks and earth-observation arrays already exceed available slots on expendable rockets. Reusable fleets that can complete multiple missions per booster each month provide operators with both cost relief and schedule certainty, locking in launch contracts several years in advance.
Government and DoD Multi-Year Service Contracts
Long-term procurement awards from defense ministries and space agencies provide predictable cash flows that de-risk capital spending on reuse technologies. For instance, the US Department of Defense (DoD) allocated USD 13.7 billion for national security launches through 2029, with certified providers expected to meet strict mission-assurance standards. Similar multi-year frameworks are appearing in allied nations, signaling a broader shift toward reuse as an accepted element of strategic space infrastructure.
Emergence of Heavy-Lift Fully Reusable Systems (Greater than 100 tons)
Next-generation launchers targeting 150 tons or more to LEO could eliminate multi-mission assembly campaigns by placing entire lunar or deep-space payload stacks on a single flight. Bringing both stages back for turnaround amplifies the cost leverage, but also demands new high-temperature materials, high-rate engine casting, and automated ground operations. Successful commercialization of heavy-lift reuse is expected to reshape planetary mission design, allowing space stations, depots, and surface cargo to launch ready-built.
Restraints Impact Analysis*
| Restraint | (~) % Impact on CAGR Forecast | Geographic Relevance | Impact Timeline |
|---|---|---|---|
| Up-front capex and refurbishment infrastructure | -2.4% | Global, particularly acute in emerging markets | Medium term (2-4 years) |
| Safety-driven regulatory delays | -1.8% | Global, most severe in Europe and emerging markets | Short term (≤ 2 years) |
| Sparse domestic demand in Europe limits reuse economics | -1.2% | Europe, with spillover effects globally | Long term (≥ 4 years) |
| Spaceport environmental/community opposition | -0.9% | Global, concentrated in developed nations | Medium term (2-4 years) |
| Source: Mordor Intelligence | |||
Up-Front Capex and Refurbishment Infrastructure
High-volume reuse programs require specialized test bays, non-destructive evaluation labs, and cryogenic propellant handling cells, all of which push initial facility spending into the hundreds of millions of USD. Cash burn peaks years before flight revenue, challenging newcomers’ balance sheets. Mature players are mitigating this through vertically integrated engine shops and modular hangars that streamline inspection cycles, yet the barrier remains formidable for regions with fledgling launch markets.
Safety-Driven Regulatory Delays
Certification bodies built around expendable launch norms are still adapting licensing protocols for stages that land on drone ships, undergo hot-fire tests, and return to service within days. Environmental impact statements and neighborhood sound-level reviews lengthen approval timelines, particularly at new coastal spaceports. Smaller firms often lack the compliance staff required to manage multi-agency consultations, slowing their path to first flight and tilting near-term market share toward established incumbents.
*Our forecasts treat driver/restraint impacts as directional, not additive. The impact forecasts reflect baseline growth, mix effects, and variable interactions.
Segment Analysis
By Type: Partial Reuse Anchors Today’s Fleet
Partially reusable boosters generated 93.80% of 2025 revenue, confirming that recovering the first stage captures most of a launch vehicle’s cost base. Reusability milestones-40 flights per Falcon 9 core, for example, support routine reflights with minor hardware swaps.[2]Source: Isaacson, “SpaceX Falcon 9 Economics,” inverse.com The reusable launch vehicles market is thus dominated by operators that have optimized booster turnarounds to fewer than two weeks. Fully reusable architectures, however, are registering the highest CAGR of 11.17% as technology demonstrators progress toward returning upper stages intact. Once thermal shielding and propellant management hurdles are solved, end-to-end reuse may bring marginal launch costs close to propellant costs alone.
Second-generation programs funded in 2025 underscore investor appetite: one fully reusable startup secured USD 260 million and booked a 2026 orbital debut. Established players are flight-testing belly-flop re-entry profiles and in-air stage grabs to shave turnaround times. As mass-production lines mature, the reusable launch vehicles market will likely see the cost curve bend further in favor of full reuse over partial schemes.


By Configuration: Two-Stage-to-Orbit Retains the Sweet Spot
Two-stage-to-orbit (TSTO) systems held an 88.90% share in 2025 and are growing at the highest CAGR of 8.17% through 2031, reflecting a balance between aerodynamic margins and propulsion flexibility. First-stage return consumes modest payload mass while upper stages remain expendable or are queued for future recovery trials. Companies experimenting with advanced aerospike engines and lightweight composites illustrate the appeal-simple ground operations and a small vehicle count-yet must demonstrate that re-entry loads and propellant reserves do not erode commercial economics.
Expansion of engine thrust-to-weight ratios and the adoption of high-efficiency closed-cycle designs could narrow the performance gap by the end of the decade.[3]Source: Contest Technical Briefs, “Practical SSTO Concept,” techbriefs.com If SSTO prototypes validate durable heat-shield tiles and rapid refuel-and-go procedures, the reusable launch vehicles market could witness a second wave of architectural disruption.
By Payload Class: Heavy Missions Accelerate
Constellation batches and government surveillance spacecraft, along with medium-class launches, accounted for 61.10% of 2025 lift revenue. Vehicle portfolios are optimized within this range, resulting in a healthy launch cadence. Yet heavy cargo weighing more than 20,000 kg is advancing at a 9.13% CAGR as broadband operators consolidate satellites into larger, more capable buses and as space-station modules shift from multi-launch assembly to single-ship deliveries. Heavy-lift boosters expected online by 2027 promise reusable launch vehicles market-size gains alongside mission architectures that leapfrog in-orbit construction.
Reusable designs scaling toward 150-250 tons to LEO will widen competitive moats for firms that mass-produce methane engines and stainless-steel tanks. Early booking of demonstration payloads signals that heavy-lift reuse may transition from prototype to commercial service within the forecast period.
By End User: Commercial Demand Outpaces Institutional Programs
Commercial operators generated 73.90% of 2025 revenue and are poised for a 8.21% CAGR as vertical integration blurs lines between launch supply and space-based services. Coupling broadband networks or earth-observation revenue streams with captive launch fleets secures cash flow and hardware utilization. Governments still account for robust baseline demand through crewed ISS rotations, scientific probes, and defense payloads. However, fixed-price contracts and open competitions mean public agencies increasingly leverage the same reusable platforms, driving private growth.
Emerging national space programs in Asia and the Middle East are sourcing rides on commercial boosters to sidestep the high capital costs of indigenous vehicles, reinforcing the commercial segment’s pull in the reusable launch vehicles market.
By Mission: Human Spaceflight Gains Momentum
Satellite deployment commanded 72.05% of sales in 2025, yet human spaceflight are expanding at a 9.17% CAGR. Suborbital flights priced below USD 500,000 per seat and new orbital hotel concepts underpin recurring non-governmental human spaceflight demand. Planned fleets of Delta-class winged craft aim for weekly operations by 2026, illustrating how dedicated vehicles can coexist with cargo-centric rockets. Should safety records remain strong, tourism-related lift requirements could transition from niche to mainstream by 2030.
Cargo resupply and in-space manufacturing remain steady, while lunar logistics and deep-space transportation are emergent niches that stand to benefit from large fully reusable ships set to debut later in the decade.
Geography Analysis
North America controlled 83.61% of 2025 revenue, anchored by mature launch pads, vertically integrated engine lines, and multi-billion-USD government launch contracts. Operators headquartered in the region accounted for over half of global orbital flights, securing market leadership through demonstrable reflight statistics and rapid pad turnaround capabilities. Export control rules channel allied military missions back to US providers, reinforcing a domestic backlog that sustains factory utilization.
Asia-Pacific will be the fastest-growing geography at a 17.77% CAGR. Chinese commercial firms flight-tested booster landings in 2025, pairing domestic mega-constellation plans with coastal spaceport build-outs. India’s Next Generation Launch Vehicle program adopts recover-and-reuse plans, while private startups leverage cost-effective supply chains to build methane engines domestically. Japan, South Korea, and Australia are investing in equatorial launch pads and propellant depots, anticipating regional customer demand for low-inclination orbits.
Europe’s uptake of reusability is slower. Sparse institutional launch volumes and reliance on a single heavy-lift program constrain economies of scale needed to justify dedicated refurbishment facilities. New entrants pursuing mini-launchers with fold-out heat shields illustrate technical innovation, yet limited domestic payload pipelines hinder the economics of reuse. Policy efforts, including ESA’s reusability campaigns and public-private co-funding of test stands, aim to narrow the gap, but meaningful share gains may slip beyond 2030.

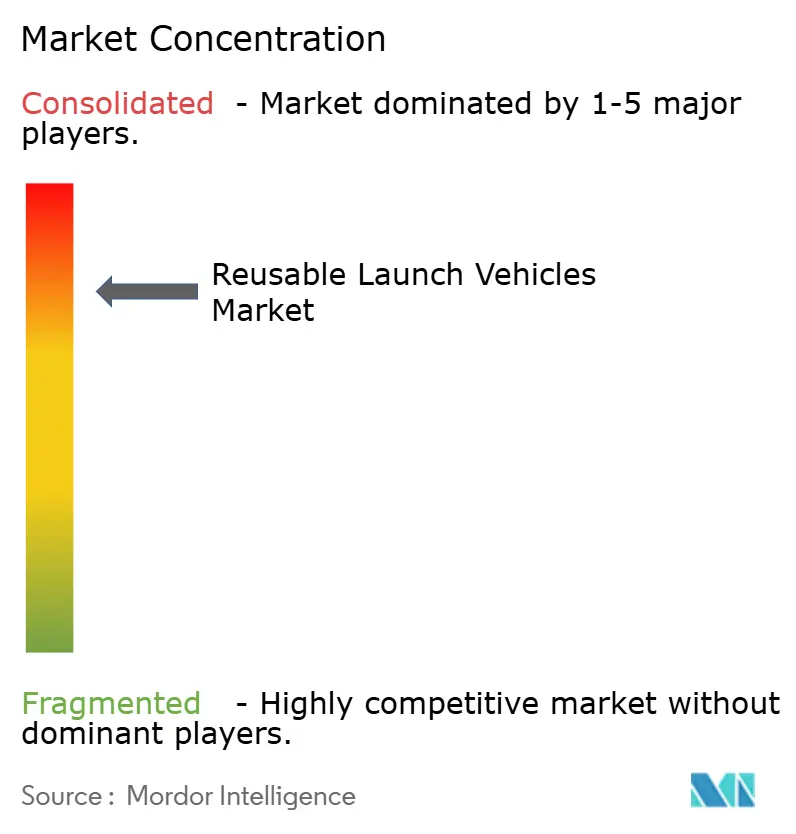
Competitive Landscape
Reusable launch services are presently concentrated, with one operator completing more than 130 orbital flights in 2024 and achieving up to 40 reuses per core. Proprietary engine supply, integrated satellite factories, and autonomous drone-ship recovery create a cost moat that newcomers must overcome. Rival heavy-lift boosters achieved their maiden orbital insertions and quickly secured national security certification, ending the single-provider era for classified payloads and opening a multibillion-dollar bidding pool.
Strategic moves emphasize vertical integration: a new USD 200 million engine plant in Alabama feeds two separate vehicle lines. At the same time, a Gulf Coast company, Gigabay, aims to roll out a booster each day by 2028. Partnerships between rocket startups and automotive manufacturing groups aim to adopt lean production methods, lowering unit costs and increasing flight cadence. Funding patterns show venture capital gravitating toward differentiated technologies, single-piece regeneratively cooled nozzles, full-flow staged-combustion engines, and propellant-agnostic avionics that promise step-change improvements in refurbishment cycles.
Capacity constraints remain the near-term bottleneck. Aggregate demand for constellation launches, lunar cargo, and space tourism exceeds projected supply through at least 2028, giving incumbent providers strong pricing power even as new entrants ramp up. Regulatory familiarity, proven landing-telemetry, and fleet logistics experience create intangible barriers that complement scale advantage. However, breakthroughs in additive-manufactured engines or rapid propellant densification could level the field for challengers by the next decade.
Reusable Launch Vehicles Industry Leaders
Space Exploration Technologies Corp.
Blue Origin Enterprises, L.P.
ArianeGroup SAS
United Launch Alliance, LLC
Rocket Lab USA, Inc.
- *Disclaimer: Major Players sorted in no particular order

Recent Industry Developments
- February 2026: China advanced its reusable spaceflight roadmap with the launch of a reusable experimental spacecraft aboard a Long March-2F rocket from the Jiuquan Satellite Launch.
- February 2026: The CMSA conducted an integrated flight test of its next-generation Mengzhou crew capsule in combination with the Long March-10 (CZ-10) reusable launch vehicles. It marked China’s first publicly demonstrated integration of lunar-class crew hardware with a reusable heavy-lift architecture.
- March 2025: The US Space Systems Command’s Assured Access to Space (AATS) organization certified United Launch Alliance’s Vulcan launch system for National Security Space Launch missions. ULA is now eligible to launch NSSL missions after meeting 52 criteria, including 180 tasks, 2 flight demonstrations, and 114 audits.


Global Reusable Launch Vehicles Market Report Scope
A space launch system designed to recover all or part of itself after deploying a satellite into orbit is termed a reusable launch vehicle (RLV). The primary objective of an RLV is to reduce the launch costs of satellites by recovering exhausted critical systems and components. To provide a comprehensive perspective, the study includes a detailed analysis of annual satellite launches and the launch-vehicle models used for orbital deployment. The study also considers the ongoing R&D efforts divested by the market players to develop new RLV variants.
The reusable launch vehicles market is segmented by type, configuration, payload class, end user, mission, and geography. By type, the market is segmented into partially reusable and fully reusable. By configuration, the market is segmented into single-stage-to-orbit, two-stage-to-orbit, and multi-stage. By payload class, the market is segmented into small, medium, and heavy. By end user, the market is segmented into commercial and defense and governments. By mission, the market is segmented into satellite deployment, cargo resupply and in-space logistics, and human spaceflight. The report also covers the market sizes and forecasts for the reusable launch vehicles market in major countries across different regions. For each segment, the market size is provided in terms of value (USD).
| Partially Reusable |
| Fully Reusable |
| Single-Stage-to-Orbit (SSTO) |
| Two-Stage-to-Orbit (TSTO) |
| Multi-Stage (Booster-only reuse) |
| Small (Less than 2,000 kg) |
| Medium (2,000 kg to 20,000 kg) |
| Heavy (More than 20,000 kg) |
| Commercial |
| Defense and Governments |
| Satellite Deployment |
| Cargo Resupply and In-Space Logistics |
| Human Spaceflight |
| North America | United States |
| Canada | |
| Europe | United Kingdom |
| France | |
| Germany | |
| Russia | |
| Rest of Europe | |
| Asia-Pacific | China |
| Japan | |
| India | |
| Australia | |
| South Korea | |
| Rest of Asia-Pacific | |
| Rest of the World | Middle East |
| Africa | |
| South America |
| By Type | Partially Reusable | |
| Fully Reusable | ||
| By Configuration | Single-Stage-to-Orbit (SSTO) | |
| Two-Stage-to-Orbit (TSTO) | ||
| Multi-Stage (Booster-only reuse) | ||
| By Payload Class | Small (Less than 2,000 kg) | |
| Medium (2,000 kg to 20,000 kg) | ||
| Heavy (More than 20,000 kg) | ||
| By End User | Commercial | |
| Defense and Governments | ||
| By Mission | Satellite Deployment | |
| Cargo Resupply and In-Space Logistics | ||
| Human Spaceflight | ||
| By Geography | North America | United States |
| Canada | ||
| Europe | United Kingdom | |
| France | ||
| Germany | ||
| Russia | ||
| Rest of Europe | ||
| Asia-Pacific | China | |
| Japan | ||
| India | ||
| Australia | ||
| South Korea | ||
| Rest of Asia-Pacific | ||
| Rest of the World | Middle East | |
| Africa | ||
| South America | ||


Key Questions Answered in the Report
How large is the reusable launch vehicles market today?
The reusable launch vehicles market reached USD 6.43 billion in 2026 and is projected to expand to USD 9.45 billion by 2031, expanding at a 7.99% CAGR.
Which segment of the reusable launch vehicles market is growing the fastest?
Fully reusable vehicles represent the fastest-growing type, advancing at an 11.17% CAGR through 2031.
Why is Asia-Pacific considering a high-growth region?
China’s commercial rocket initiatives and India’s Next Generation Launch Vehicle program drive a 17.77% CAGR for Asia-Pacific, the highest regional rate.
What role do government contracts play in market growth?
Multi-year national security launch awards worth USD 13.7 billion provide stable revenue that underwrites ongoing investment in reusable systems.
What is the chief barrier for new entrants?
High up-front capital for launch pads, engine production and refurbishment infrastructure remains the principal obstacle to market entry.
Page last updated on:


