
Market Overview
| Study Period | 2020 - 2031 |
|---|---|
| Market Size (2026) | USD 60.22 Billion |
| Market Size (2031) | USD 75.16 Billion |
| Growth Rate (2026 - 2031) | 4.53 % |
| Fastest Growing Market | Asia-Pacific |
| Largest Market | North America |
| Market Concentration | Medium |
Major Players *Disclaimer: Major Players sorted in no particular order Image © Mordor Intelligence. Reuse requires attribution under CC BY 4.0. | |
Sanitaryware Market Analysis by Mordor Intelligence
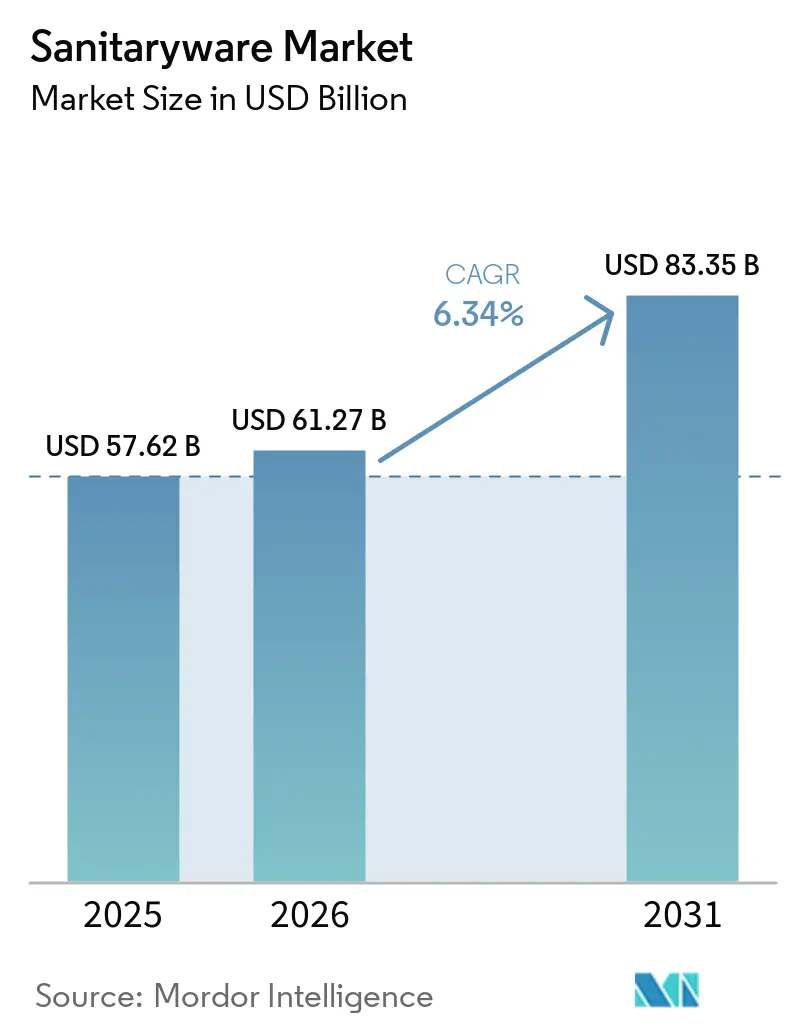
The sanitaryware market size is expected to grow from USD 57.62 billion in 2025 to USD 60.22 billion in 2026 and is forecast to reach USD 75.16 billion by 2031 at 4.53% CAGR over 2026-2031. Rising urban populations, large infrastructure projects in emerging regions, and premium bathroom upgrades in mature economies combined to lift unit demand while supporting higher average selling prices. Water-efficient and smart fixtures gain traction as regulators tighten flow-rate rules and consumers seek convenience, driving manufacturers to embed IoT connectivity and antimicrobial glazing in core lines. The Middle East & Africa shows the strongest regional trajectory on the back of USD 1.5 trillion worth of mega-projects, while Asia-Pacific retains the largest regional foothold as housing starts and renovation cycles continue at scale. Margin resilience hinges on vertical integration in raw materials, energy-saving kiln technologies, and omnichannel distribution that blends direct-to-consumer platforms with project-based partnerships.
Key Report Takeaways
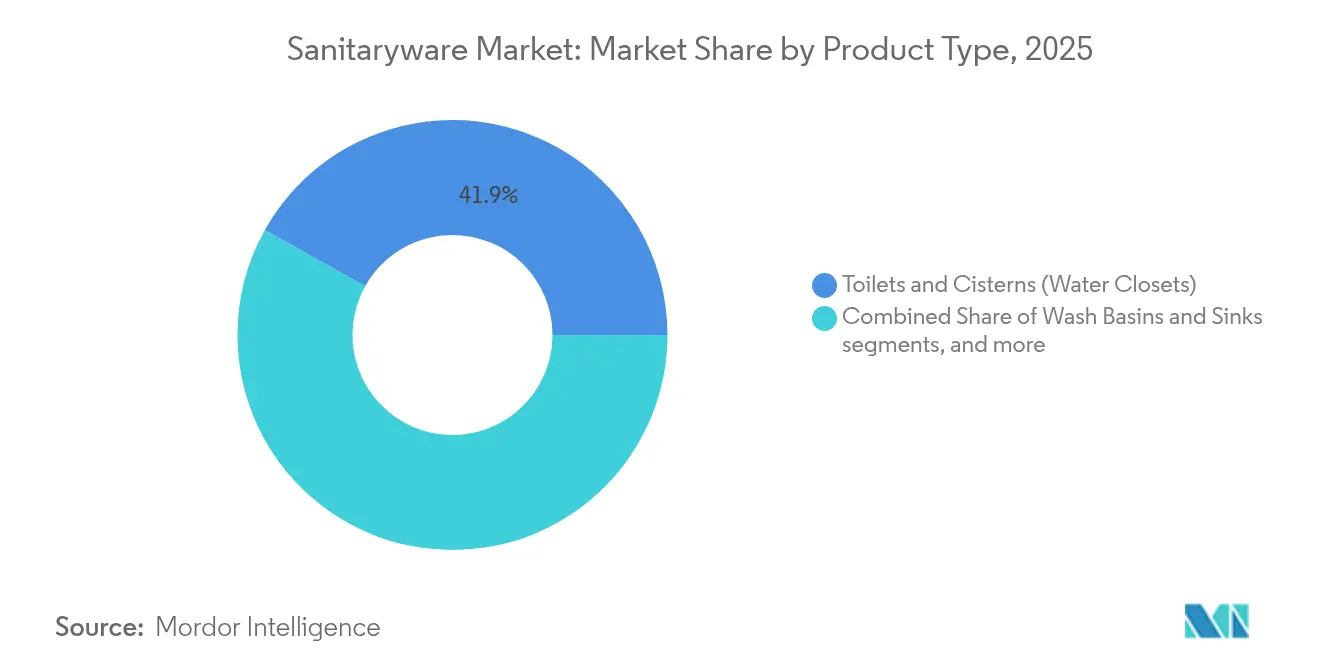
- By product type, toilets and cisterns led with 41.89% of the sanitaryware market share in 2025, while wash basins and sinks are projected to rise at a 6.71% CAGR through 2031.
- By material, ceramic products accounted for 77.05% of the sanitaryware market size in 2025, and composites are expected to expand at a 6.45% CAGR over the same horizon.
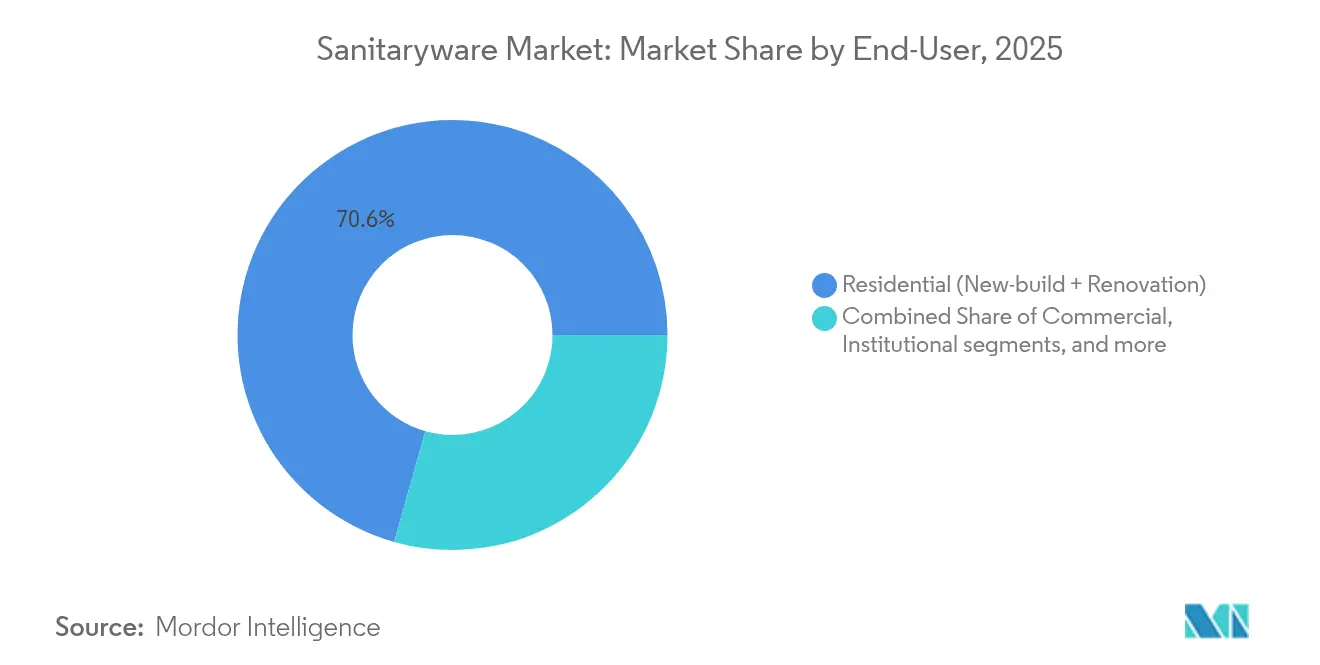
- By end-user, residential applications held 70.62% revenue share in 2025; the institutional segment demonstrates the highest forecast growth at 6.82% CAGR to 2031.
- By distribution channel, retail captured 75.2% of the sanitaryware market size in 2025, whereas project-driven B2B channels are set to advance at a 6.76% CAGR.
- By geography, Asia-Pacific commanded 39.72% of the sanitaryware market share in 2025, while the Middle East & Africa is pacing for a 6.95% CAGR through 2031.
Note: Market size and forecast figures in this report are generated using Mordor Intelligence’s proprietary estimation framework, updated with the latest available data and insights as of 2026.
Global Sanitaryware Market Trends and Insights
Drivers Impact Analysis*
| Driver | (~) % Impact on CAGR Forecast | Geographic Relevance | Impact Timeline |
|---|---|---|---|
| Premium and water-efficient product uptake | +1.2% | Global, led by North America and the European Union | Medium term (2-4 years) |
| Modular, space-saving prefabricated bathroom pods | +0.8% | Asia-Pacific core, spill-over to the Middle East & Africa | Long term (≥ 4 years) |
| E-commerce-led direct-to-consumer expansion | +0.9% | Global, with strong traction in North America and Europe | Short term (≤ 2 years) |
| Renovation surge in mature economies | +1.1% | North America and the European Union | Medium term (2-4 years) |
| Rapid urbanization and residential construction | +1.3% | Asia-Pacific and Middle East & Africa | Long term (≥ 4 years) |
| Smart, antimicrobial ceramic-coating advances | +0.7% | Global, premium segment focus | Medium term (2-4 years) |
| Source: Mordor Intelligence | |||


Premium and Water-Efficient Product Uptake
Growing emphasis on water conservation and wellness drives a rapid pivot toward premium fixtures across the sanitaryware market. TOTO’s 2025 WASHLET S5 showcases tankless heating that reduces energy use by 38%, verifying how design advances can meet sustainability goals while commanding higher price points. A 2024 Houzz survey of 1,247 U.S. homeowners found 41% installing specialty toilet features, including 23% with bidet seats and 19% with self-cleaning functionality [1]Houzz Research, “2024 U.S. Houzz & Home Study,” houzz.com. Regulatory frameworks such as WaterSense labeling and regional drought policies encourage builders to specify low-flow toilets and faucets, thereby accelerating premium substitution. IoT-enabled smart toilets help facilities teams monitor usage and predict maintenance, cutting life-cycle costs for institutional buyers. Higher margins on technologically advanced models compensate for slower volume growth in price-sensitive segments, supporting overall profitability across the sanitaryware market.
Modular, Space-Saving Prefabricated Bathroom Pods
Developers in high-density cities require faster project cycles, making prefabricated pods an attractive alternative that embeds sanitaryware in fully finished modules. Asia-Pacific construction firms have deployed standardized bathroom pods at scale to shorten on-site labor time, address skilled-trade shortages, and improve defect rates. Mega-developments such as Saudi Arabia’s NEOM integrate industrialized construction techniques, creating opportunities for suppliers that can deliver pod-optimized toilets, basins, and plumbing assemblies. Factory-controlled environments also enable stricter quality checks and facilitate advanced coatings that are harder to apply consistently in field settings. The shift forces sanitaryware producers to design collections compatible with modular frames, reshaping supply chains and broadening after-sales service requirements across the sanitaryware market.
E-Commerce-Led Direct-to-Consumer Expansion
As homeowners research and purchase fixtures online, the sanitaryware market experiences significant channel disruption. Augmented‐reality tools let users visualize basins and vanities at home, reducing reliance on in-store showrooms. Brands like LIXIL and Roca are scaling proprietary web stores that integrate installation support and smart-fixture apps, capturing higher margins and valuable consumer data. Contractors increasingly turn to digital procurement for standardized SKUs, streamlining logistics on smaller jobs. Hybrid models still dominate large commercial projects, but the underlying growth in direct-to-consumer sales shifts pricing power toward manufacturers and enlarges the addressable market.
Renovation Surge in Mature Economies
An aging housing stock in the United States and Western Europe sparks robust bathroom remodel activity, prompting homeowners to invest in performance upgrades rather than new homes. U.S. median spends reached USD 15,000 per bathroom project in 2024, with 24% of homeowners undertaking upgrades each year. Comfort-height toilets, walk-in tubs, and grab bars align with universal-design principles as populations age. Energy-efficient retrofits further drive demand for water-conserving fixtures and smart controls, helping achieve broader decarbonization targets. Renovation cycles sustain aftermarket revenue streams, balancing cyclical new construction demand within the sanitaryware market.
Restraints Impact Analysis*
| Restraint | (≈) % Impact on CAGR Forecast | Geographic Relevance | Impact Timeline |
|---|---|---|---|
| Volatile energy and raw-material prices | -0.9% | Global, with an acute impact on Europe and Asia | Short term (≤ 2 years) |
| Stringent kiln-emission and wastewater rules | -0.6% | North America and the European Union | Medium term (2-4 years) |
| Plumbing labor shortages are delaying installs | -0.8% | North America and the European Union | Short term (≤ 2 years) |
| Circular-economy refurbishment pressure | -0.4% | European Union, with global diffusion | Long term (≥ 4 years) |
| Source: Mordor Intelligence | |||
Volatile Energy and Raw-Material Prices (Clay, Zircon)
Zircon sand provides critical opacity in ceramic glazes and accounts for over half of global zircon output dedicated to ceramics, leaving producers exposed to supply swings and price spikes. Natural gas costs for tunnel kilns soared across Europe in 2024, amplifying operating expenses and squeezing margins. Smaller regional manufacturers often lack hedging tools or long-term contracts, raising the risk of production stoppages. Vertical integration and recycled-material substitution offer partial relief but require capital outlays and technological know-how. Persistent volatility could accelerate consolidation as financially stronger firms secure raw-material pipelines in the sanitaryware market.
Stringent Kiln-Emission and Wastewater Regulations
The U.S. EPA’s Subpart KKKKK and Europe’s Carbon Border Adjustment Mechanism impose tighter limits on particulate matter, HF, and carbon emissions from ceramic production lines. Compliance demands upgraded baghouse filters, continuous monitoring systems, and kiln profiling software, translating into higher capital and operating costs. Producers like Geberit leveraged early investments to cut CO₂ intensity by 63.2% since 2015, gaining a competitive edge in tenders that weigh sustainability credentials [2] Geberit Group, “Sustainability Report 2025,” geberit.com. Firms unable to meet thresholds face potential fines or import levies, reducing global competitiveness and hampering growth across the sanitaryware market.
*Our forecasts treat driver/restraint impacts as directional, not additive. The impact forecasts reflect baseline growth, mix effects, and variable interactions.
Segment Analysis
By Product Type: Toilets Hold Sway, Basins Propel Growth
Toilets and cisterns accounted for 41.89% of the sanitaryware market share in 2025 as their essential nature secures baseline demand in every build class. Wash basins and sinks register the highest 6.71% CAGR through 2031, reflecting consumer desire for statement pieces and hygienic touch-free sensor taps that elevate everyday routines. Accelerating design iterations, thin-rimmed basins, matte finishes, and rimless toilets drive up average selling prices and reinforce brand differentiation. Bathtubs approach maturity in North America and Europe, yet gain ground in Southeast Asia, where rising disposable incomes foster spa-like bathroom aspirations. Smart toilet penetration further widens revenue streams through app-based analytics subscriptions, adding service income to core hardware sales within the sanitaryware market.
Smart toilets equip instantaneous water heaters and occupancy sensors that cut standby losses, turning energy savings into a tangible selling proposition. Urinals benefit from hybrid flush valves that use just 0.5 L per cycle, fulfilling stringent building-code mandates. Bidet seats, once a niche in Western homes, gain mainstream acceptance post-pandemic as hygiene narratives take hold. Accessory categories such as ceramic soap dispensers and matching toilet brush holders help brands capture full-suite contracts, especially in hospitality and multifamily housing. Consistent product refresh cycles keep the sanitaryware market dynamic and innovation-driven.


By Material: Ceramic Dominance, Composites Accelerating
Ceramic sanitary ware retained 77.05% share of the market in 2025 and remains the reference standard due to cost efficiency, mechanical strength, and a well-developed global supplier base. Solid-surface and engineered mineral composites grow 6.45% CAGR as architects seek seamless, color-integrated fixtures that can be repaired on-site, an attribute prized in luxury hospitality. High-pressure cast ceramic allows sharper lines that echo minimalist architectural trends, closing the aesthetic gap with composites. Pressed metal and stainless-steel stay relevant for high-abuse public washrooms where vandal resistance prevails over design. Recycled-content glazes and vitrified waste aggregates emerge in line with circular-economy directives, narrowing environmental performance differentials and broadening material choice in the sanitaryware market.
Composite adoption remains cost-sensitive, yet project budgets in premium multifamily and boutique hotels support the premium. Manufacturers highlight life-cycle cost savings through scratch repair kits and lower weight, which reduces transport emissions. Acrylic continues to dominate shower bases but faces competition from thin-profile porcelain-enamel steel pans that boast better recyclability. Material R&D efforts concentrate on antibacterial nanoparticles and low temperature sintering that curbs kiln energy use. These advances deepen supply-chain resilience while fostering brand narratives anchored in sustainability.
By End-User: Residential Bulk, Institutional Momentum
Residential projects made up 70.62% of the sanitaryware market size in 2025, reflecting continual replacement cycles and base-level demand for new housing. Institutional settings, healthcare facilities, schools, and public buildings lead future expansion at 6.82% CAGR as governments channel stimulus funds into modernization and hygienic upgrades. Hospitals specify rimless toilets and touch-free basins to curb pathogen transmission, while schools mandate durable, low-flow fixtures to meet sustainability goals. Accessibility retrofits generate demand for comfort-height toilets and sensor faucets, aligning with demographic aging. Commercial real estate remains steady as offices reconfigure spaces for hybrid work, integrating gender-neutral restrooms and occupancy analytics in the sanitaryware market.
Revenue per unit tends to be higher in institutional projects because of stringent performance specs and extended warranty clauses. Extended maintenance contracts tied to smart-sensor data provide an annuity stream, cushioning cyclicality. Warranty and service packages cover replacement parts and predictive maintenance software, fostering brand stickiness. Housing affordability initiatives in emerging markets balance premium growth with entry-level volume, keeping production lines optimized for both ends of the price spectrum.
By Distribution Channel: Retail Scale, Project Adhesion
Retail claimed 75.2% of the sanitaryware market size in 2025 through big-box outlets, specialist showrooms, and fast-growing e-commerce portals that aggregate SKUs for consumers and small contractors. Project-based B2B procurement outpaces overall growth at 6.76% CAGR because large developers prefer bundled contracts that minimize coordination costs. Online marketplaces feature augmented-reality tools and rating systems that influence purchase decisions, pushing brands to refine digital content and last-mile delivery. Exclusive brand stores focus on curated experiences and IoT demos, inspiring upgrades and cross-selling opportunities. Wholesale distributors pivot to value-added logistics, project staging, and just-in-time drops that suit fragmented construction timelines.
Channel overlap raises potential conflict, but tiered pricing and unique SKUs help protect trade margins. Manufacturers deploy omnichannel strategies, ensuring presence across physical and digital touchpoints. Direct-to-consumer fulfillment warehouses shorten lead times and enhance post-purchase service, vital for smart-fixture onboarding. The evolution in channel architecture brings richer data flows, enabling dynamic forecasting and inventory optimization across the sanitaryware market.
Geography Analysis
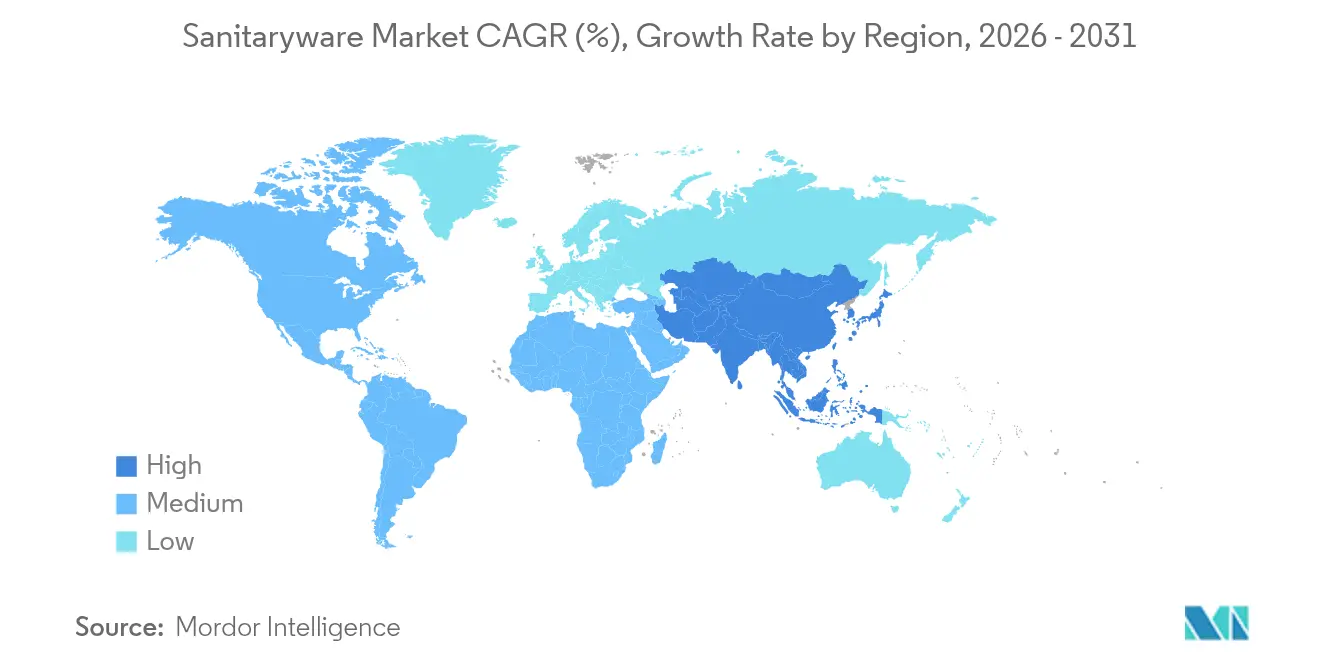
Asia-Pacific retained 39.72% of the sanitaryware market share in 2025, buoyed by vigorous residential projects in India, Indonesia, and Vietnam, along with robust renovation cycles in Japan and South Korea. China’s slowdown after 2024 tempered regional growth but did not offset gains elsewhere. Local manufacturers leverage proximity to cost-competitive raw materials and rising mid-tier consumption to sustain capacity utilization. Government housing schemes and urban redevelopment plans underpin a stable base-volume demand.
The Middle East & Africa region registers the fastest 6.95% CAGR through 2031 as giga-projects, NEOM, Red Sea Global, and Dubai 2040, mobilize thousands of residential and hospitality units, each demanding comprehensive bathroom packages. Prefabricated bathroom pods gain special traction given the harsh on-site conditions and skilled labor scarcity. Local content mandates encourage joint ventures, pushing global brands to establish warehousing and light assembly in Saudi Arabia and the UAE to accelerate delivery timelines within the sanitaryware market.
North America benefits from sustained renovation spending, spurred by an aging housing stock and record home-equity levels that fund bath remodels. Federal infrastructure spending filters into public facilities and affordable housing developments, boosting institutional demand. Europe remains subdued due to higher borrowing costs and cautious developer sentiment, yet pockets of resilience appear in Poland and Ireland, where public investment persists. Carbon regulations incentivize low-flow fixtures and recycled ceramic content, nudging product portfolios toward sustainability. Latin America and the rest of Africa present mixed dynamics tied to macro-economic volatility, but gradual urbanization and infrastructure commitments keep a floor under volume demand. The geographic mosaic necessitates calibration of product features, price points, and distribution models across the sanitaryware market.

Regulatory Landscape
Sanitaryware demand and product design are shaped by water-efficiency specifications, conformity assessment schemes, and manufacturing compliance rules across major regions. In the United Kingdom, a WC suite performance specification published on May 6, 2026 sets a 6-liter maximum flush volume and takes effect from May 6, 2027, tightening performance benchmarks for toilet suites sold into the market. India continues to update product specifications through the Bureau of Indian Standards (BIS), including IS 2556 (Part 16):2024 covering vitreous china washdown wall-mounted water closets, while Saudi Arabia requires compliance under SASO TR-BM Part 4, which calls for the Saudi Quality Mark or a Certificate of Conformity using ISO/IEC 17067 Type 3 conformity assessment for sanitary ware and related ceramic products.
China combines standard-setting and market-access controls that shape both domestic production and imports. GB/T 44460-2024 provides guidelines for quality grading of consumer sanitary fixtures and becomes effective March 1, 2025, which is likely to increase transparency and differentiation for compliant product lines. GB/T 11977-2025, implemented February 1, 2026, standardizes residential bathroom functions and dimensions, reinforcing the need for dimensionally compliant ranges. For certain categories, mandatory certification and testing requirements such as China Compulsory Certification (CCC) and ceramic radioactivity testing add time and cost to cross-border shipment readiness. In practice, compliance capability and documentation become recurring competitive levers.
Value Chain Analysis
The sanitaryware value chain starts with upstream mining and processing of ceramic inputs (kaolin, ball clay, feldspar, quartz) and glaze additives, leaving manufacturers exposed to shifts in raw-material availability and energy costs tied to kiln firing. Core production typically runs through slip preparation (ball milling), casting in molds, drying, glazing, and firing in kilns, with an end-to-end cycle of about 15 to 20 days. Yield, cycle time, and energy intensity make kiln capacity and process control key bottlenecks, while specialized glaze-chemistry skills can limit the pace of new finishes and performance coating ramps.
Downstream, products move through a split channel structure, with high-volume retail (including e-commerce) for residential replacement and specification-led B2B/project procurement for developers, contractors, and institutions. Compliance and certification can materially affect time-to-market, and certification backlogs, including BIS-linked pathways for certain products in India, can extend launch cycles by roughly 8 to 12 weeks. That timeline shift feeds into inventory planning and SKU rationalization. Recent capacity and process automation initiatives show how the value chain is evolving, for example CERA Sanitaryware reported debottlenecking at its Kadi, Gujarat facility in June 2025 by optimizing layout and automating glazing and modeling steps. The example points to how manufacturing automation is used to secure throughput and cost control while meeting tighter quality and regulatory requirements.
Competitive Landscape
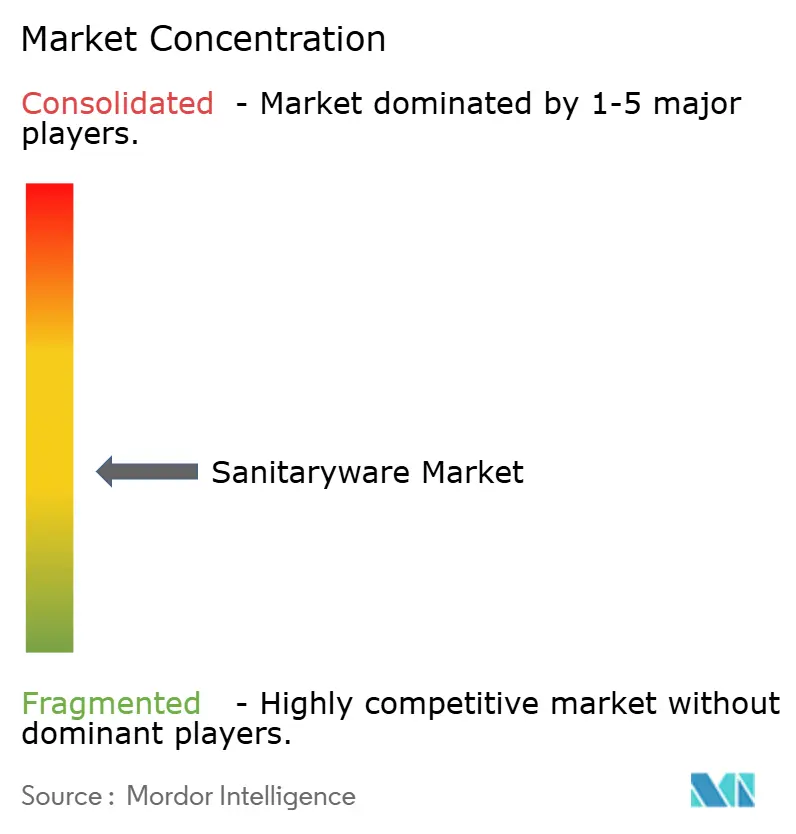
Global competition sits at a moderate concentration level with top multinationals controlling meaningful but not dominant shares. TOTO, Kohler, LIXIL, and Roca drive differentiation through smart technologies, proprietary glazing, and design collaborations. Regional companies such as RAK Ceramics and Hindware leverage localized manufacturing to counter freight costs and alignment with regional design preferences. Villeroy & Boch’s EUR 600 million (USD 704 million) acquisition of Ideal Standard in 2024 created a European heavyweight with 13,000 employees, expanding scale economics and cross-selling potential [3]Freshfields Bruckhaus Deringer, “Villeroy & Boch–Ideal Standard Deal Advisory,” freshfields.com. Innovation cycles accelerate as firms race to embed IoT chips and antimicrobial coatings while meeting stricter emission norms.
Strategic partnerships proliferate: Hansgrohe’s electrohydraulic shredding facility achieves 98% recycling of chrome-plated plastics, signaling commitment to circularity [4]Hub-4, “Hansgrohe Recycling Plant,” hub-4.com. TOTO’s 2025 suite integrates digitized maintenance, allowing property managers to track usage and water consumption, locking in after-sales software revenue. Meanwhile, challenger brands adopt direct-to-consumer tactics, offering transparent pricing and subscription services for filter replacements. Competitive intensity hinges on the ability to balance innovative investments with cost discipline amid raw-material volatility in the sanitaryware market.
Barriers to entry rise as environmental compliance and digital ecosystems demand capital and know-how. Global firms continue to scout for bolt-on acquisitions to boost regional presence and fill portfolio gaps, particularly in composites and smart hardware. Market share shifts therefore remain fluid, with technology adoption and sustainability commitments dictating future winners.
Sanitaryware Industry Leaders
TOTO Ltd.
LIXIL Corporation (incl. American Standard, GROHE)
Kohler Co.
Roca Sanitario S.A.
Geberit AG
- *Disclaimer: Major Players sorted in no particular order

Market Opportunities and Future Outlook
Ultra-low-flush and water-recycling product architectures remain a clear opportunity where regulation and buyer economics align, particularly as specifications tighten for WC suites and building projects seek measurable water savings. The United Kingdom WC suite performance specification published in May 2026 (with a 6-liter maximum flush volume effective from May 2027) provides a procurement anchor that favors manufacturers with compliant hydraulic platforms and validated performance testing. On the premium side, smart toilets and integrated bidet systems keep moving into mainstream assortments, supported by product innovation such as TOTO's WASHLET S5 (2025) and newer KBIS 2026 introductions, which sustains feature-driven differentiation in mature renovation markets.
Circular-economy repair, reuse, and take-back programs add a second opportunity lane that aligns with tightening emissions and waste rules in ceramic production and increasing buyer scrutiny of lifecycle impacts. Corporate investments are also shaping where manufacturers expand capacity and process capability. Kohler announced an INR 800 crore investment plan in January 2026 to expand manufacturing capacity at its Gujarat plant, and SCG Decor outlined a 2.5 billion THB 2026 capex budget in March 2026 that includes sanitaryware manufacturing efficiency upgrades through automation and digital systems. Together, these moves keep near-term priorities focused on energy-efficient, higher-yield production and supply assurance, while positioning brands to serve high-mix design requirements (rimless bowls, thin profiles, new finishes) with faster changeovers and fewer quality escapes across retail and project channels.
Recent Industry Developments
- April 2026: LIXIL reported its fiscal year 2026 results and highlighted a mix shift toward high-value-added products, including the standardization of its recycled low-carbon aluminum PremiAL across product lines. The update signals continued portfolio optimization around lower-carbon materials and cost resilience, which can influence specification decisions in projects that screen suppliers for sustainability credentials.
- August 2025: TOTO opened a USD 224 million manufacturing facility in Morrow, Georgia, increasing its US luxury one-piece toilet production capacity by 150%. The added capacity strengthens regional supply availability and shortens lead times for premium toilets and integrated bidet products in North America.
- May 2024: Kohler opened a one-million-square-foot manufacturing facility in Casa Grande, Arizona, to produce STERLING brand bath and shower fixtures and create 400 full-time jobs. The plant expands domestic production scale for core bathroom categories, supporting faster fulfillment and a tighter link between product development and US market demand.


Research Methodology Framework and Report Scope
Market Definition and Coverage
For this report, the sanitaryware market is defined as the revenue generated from the sale of bathroom and washroom fixtures used in residential, commercial, and institutional buildings, and it is measured at the manufacturer and channel level in nominal USD.
Scope exclusions: It does not count broader bathroom furniture, loose accessories, or installation-only labor unless it is bundled into the sanitaryware product sale.
Segmentation Overview
- By Product Type
- Toilets & Cisterns (Water Closets)
- Wash Basins & Sinks (incl. Pedestal Basins)
- Bathtubs & Whirlpool Tubs
- Urinals
- Bidets
- Other Products (such as ceramic soap trays, soap dispensers, etc.)
- By Material
- Ceramic
- Pressed Metal
- Acrylic & Plastics
- Solid Surface & Composite
- By End-User
- Residential (New-build and Renovation)
- Commercial (Hospitality, Offices, Retail)
- Institutional (Healthcare, Education, Public)
- By Distribution Channel
- B2C/Retail
- Multi-brand Stores
- Exclusive Brand Outlets
- Local Hardware Stores
- Online
- B2B/Project (developers, architects, interior designers, contractors, etc.)
- B2C/Retail
- By Geography
- North America
- United States
- Canada
- Mexico
- South America
- Brazil
- Argentina
- Chile
- Peru
- Rest of South America
- Europe
- United Kingdom
- Germany
- France
- Spain
- Italy
- BENELUX
- NORDICS
- Rest of Europe
- Asia-Pacific
- China
- India
- Japan
- South Korea
- Australia
- South-East Asia
- Rest of Asia-Pacific
- Middle East and Africa
- United Arab Emirates
- Saudi Arabia
- South Africa
- Nigeria
- Rest of Middle East and Africa
- North America
Data Sources, Market Sizing, and Validation
Desk Research
Desk work started with public construction and housing indicators, because sanitaryware demand tracks new builds and renovation cycles. We referenced sources such as the US Census Bureau (construction spending and housing starts), Eurostat (construction output), the World Bank (urbanization and related macro indicators), UN Comtrade (trade flows for relevant ceramic and metal product categories), and IEA data points where energy cost trends influence kiln-heavy production economics.
To anchor the supply side, we also reviewed company annual reports, investor presentations, and public announcements on capacity additions and product launches, along with materials from association and standards bodies that cover water-efficiency and performance requirements. In a few cases, paid subscriptions for company financials and an import-export shipment-level database were used to cross-check revenue pools and trade direction, especially when public disclosures were limited. These sources are illustrative only, and many other references were used for data collection, validation, and clarification during the research process.
Primary Interviews and Surveys
Primary work was used to test what desk research could not fully explain, mainly pricing movement, channel mix, and demand splits across residential, commercial, and institutional projects. We spoke with a mix of manufacturers, distributors, project-facing sellers, and specification-side experts across major regions, so regional building cycles and product preference shifts could be reflected in the final model.
Distribution of primary research fieldwork respondents
| Company type | Respondent position | Region |
|---|---|---|
| Top tier: 34% | CXOs: 20% | APAC: 42% |
| Mid tier: 46% | Functional/Unit leaders: 33% | EMEA: 33% |
| Smaller Players: 20% | Managers: 47% | Americas: 25% |
Market-Sizing & Forecasting
Sizing was built using a top-down approach where construction activity and renovation intensity are translated into a sanitaryware demand pool by region, then converted to value using observed product mix and average selling prices. To keep the totals realistic, results were corroborated with selective bottom-up checks, including a sampled roll-up of supplier revenues, channel checks on project pipelines, and ASP times volume sanity tests for core fixture categories.
Key inputs used in the model included housing completions and building permits, non-residential floor area additions, renovation share in mature markets, product mix shifts between toilets, basins, bathtubs, urinals, and bidets, and price movement linked to energy and raw material costs, particularly ceramic firing. Where direct volume signals were missing for smaller countries, we filled gaps using proxy indicators such as urban population additions and import-export intensity, and then re-tested those assumptions through interviews. Forecasts were produced using scenario analysis with variable-led assumptions, where base, high, and low cases were aligned to expected construction cycles, retrofit demand, and adoption of water-efficient and smart fixtures.
Data Validation & Update Cycle
Validation was done through triangulation across independent signals, followed by targeted variance checks before final sign-off. We compared modeled totals against trade direction, construction indicators, and company-reported revenue trends, then investigated outliers that did not match known building cycles or price moves.
A second analyst review is applied to assumptions, calculations, and unit consistency, and we re-contact sources when a key input moves materially or when a region shows an unusual deviation from expected patterns. Reports are refreshed annually, with interim updates when major events affect demand or pricing, and a final pre-delivery pass is completed so clients receive the latest updated view.
Mordor Intelligence's Sanitaryware Market Estimate Compared With Other Published Estimates
Published market sizes for sanitaryware can vary because the category line is not drawn the same way across studies, and because pricing, channel coverage, and base-year timing are handled differently. Differences also show up when some estimates rely more heavily on production or trade proxies without checking the end-use mix in buildings.
The table shows a tight cluster near the low 60s in 2026 for the baseline, while other figures often swing based on what is counted as sanitaryware and how prices are carried forward across years. The table points to the biggest gap driver, which is scope, and in Mordor Intelligence's model, bathtubs and whirlpool tubs, bidets, and urinals are included alongside toilets and wash basins, and values are kept in nominal USD with current-year price normalization rather than constant-price series.
Benchmark comparison
| Source | Market Size | Gaps in Research Methodology |
|---|---|---|
| Mordor Intelligence | USD 61.27 B (2026) | |
| Trade Journal A | USD 58.40 B (2024) | Uses an earlier base year and appears to apply a slower price progression, which can understate value when ceramic energy costs and freight are rising, and the scope is not always clear on bathtubs and bidets. |
| Industry Newsletter B | USD 60.50 B (2025) | Reports a different year and tends to treat channel pricing more uniformly across regions, which can miss premiumization effects in North America and higher project-led mix in parts of EMEA. |
Taken together, the spread is mostly explained by year alignment, product boundary choices, and how pricing is rolled forward across regions. By tying the value build-up to building activity, product mix, and cross-checked price movement, the estimate stays traceable to inputs that can be re-checked and updated as conditions change.


Key Questions Answered in the Report
What is the current global value of the sanitaryware market?
The sanitaryware market size stands at USD 60.22 billion in 2026 and is projected to reach USD 75.16 billion by 2031.
Which product category grows fastest within global sanitaryware demand?
Wash basins and sinks lead growth at a 4.53% CAGR through 2031, driven by design upgrades and premium material adoption.
Which region shows the strongest outlook for sanitaryware sales?
Middle East & Africa exhibits the fastest 6.95% CAGR owing to large-scale developments such as Saudi ArabiaÕs NEOM.
How are smart technologies influencing sanitaryware purchases?
IoT-enabled toilets and basins enable usage monitoring and predictive maintenance, adding service revenue and supporting premium pricing.
What challenges threaten sanitaryware manufacturers' margins?
Input-cost volatility in energy, clay, and zircon, along with stricter emission regulations and skilled labor shortages, weigh on profitability.
Why is prefabrication important for sanitaryware suppliers?
Bathroom pods cut on-site labor and ensure quality, making them essential for high-density urban projects and regions facing skilled-trade deficits.
Page last updated on:


 Your data is secure and never sold or shared.


