United States Commercial Bathroom Products Market Size and Share
Market Overview
| Study Period | 2021 - 2031 |
|---|---|
| Forecast Data Period | 2026 - 2031 |
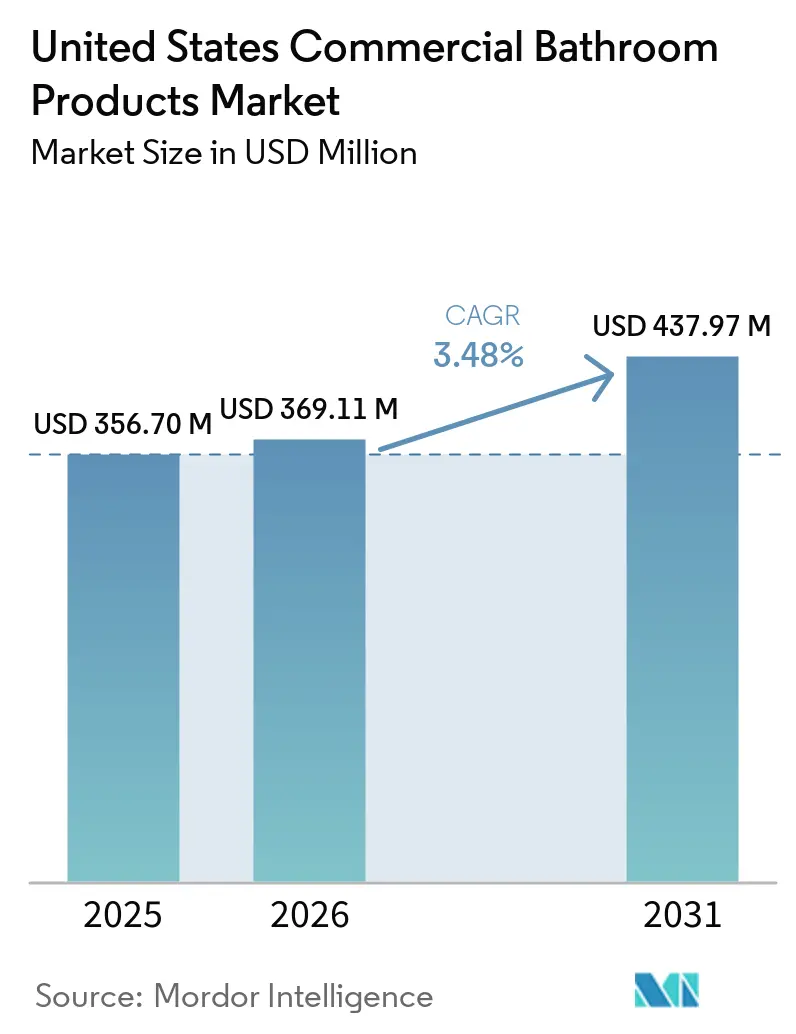
| Base Year Market Size (2025) | USD 356.70 Million |
| Market Size (2026) | USD 369.11 Million |
| Market Size (2031) | USD 437.97 Million |
| Growth Rate (2026 - 2031) | 3.48% CAGR |
| Market Concentration | Medium |
Major Players *Disclaimer: Major Players sorted in no particular order Image © Mordor Intelligence. Reuse requires attribution under CC BY 4.0. | |
United States Commercial Bathroom Products Market Analysis by Mordor Intelligence
The United States commercial bathroom products market size was valued at USD 356.7 million in 2025 and estimated to grow from USD 369.1 million in 2026 to reach USD 438 million by 2031, at a CAGR of 3.5% during the forecast period (2026-2031). Nonresidential construction is expanding on the back of data center megaprojects and healthcare facilities, which improves procurement visibility for high-spec fixtures in large campuses. Post-pandemic hygiene expectations, together with EPA WaterSense Version 2.0 and LEED v5, are elevating low-flow and touchless products from optional upgrades to standard specifications across many commercial projects [1]U.S. Environmental Protection Agency, “WaterSense Specifications and Product Certification,” U.S. Environmental Protection Agency, epa.gov. Procurement cycles are also being reshaped by IoT-enabled monitoring that shortens maintenance response times in airports, hospitals, and schools while enabling predictive schedules. At the same time, 50% tariffs on certain imported metals enacted in 2025 have kept input prices volatile, which tightens bid margins and requires careful pass-through pricing in the United States commercial bathroom products market. Persistent labor shortages create installation bottlenecks that give an advantage to prefabrication, standardized assemblies, and sensor platforms that reduce field workload.
Key Report Takeaways
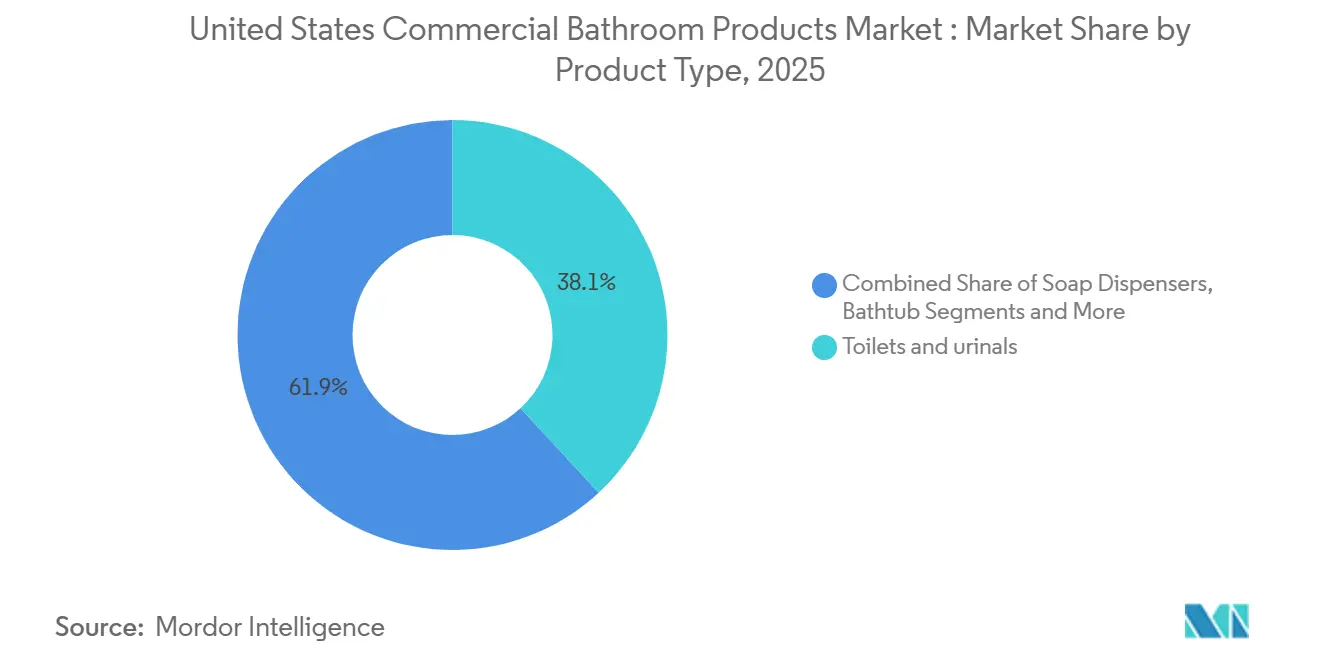
- By product type, toilets and urinals led with 38.16% revenue share in 2025 in the United States commercial bathroom products market, while soap dispensers are projected to record the fastest growth at a 5.0% CAGR through 2031.
- By price or quality tier, the standard or economy tier accounted for 35.25% in 2025 in the United States commercial bathroom products market, while premium fixtures are set to grow at a 5.0% CAGR through 2031.
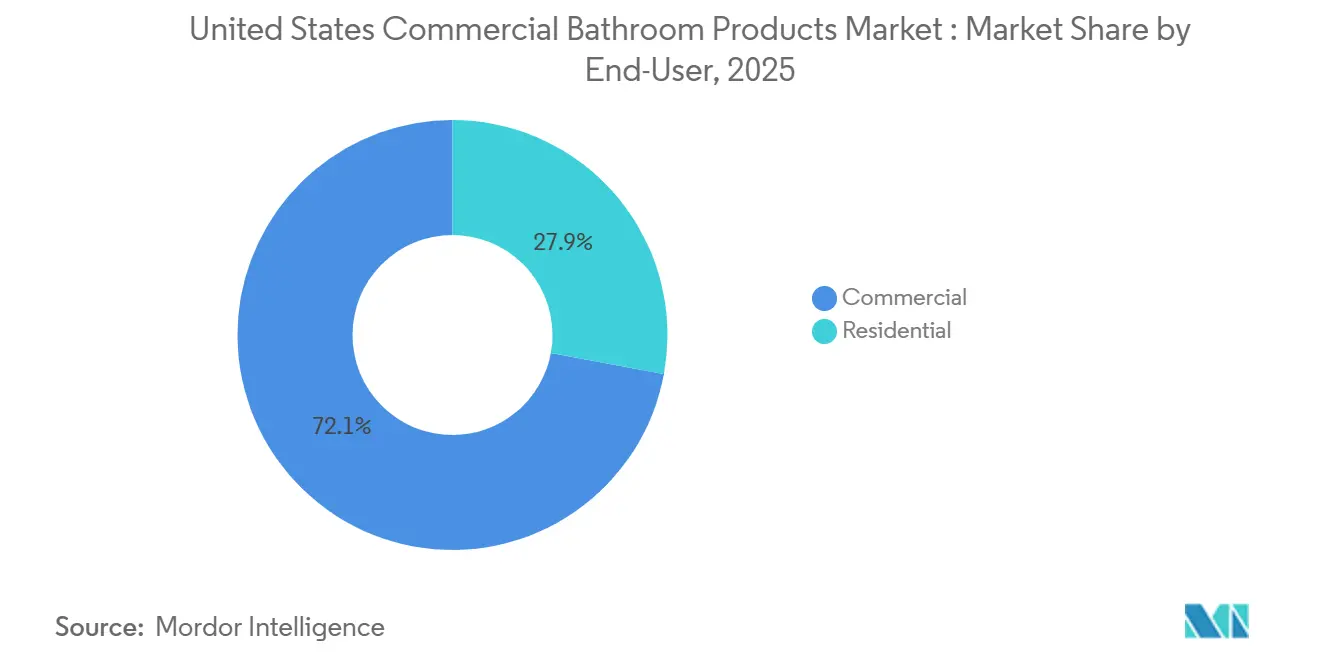
- By end-user, commercial applications commanded 72.15% of demand in 2025 in the United States commercial bathroom products market, while residential retrofits are expected to expand at a 4.4% CAGR through 2031.
- By distribution channel, business-to-business project sales held 68.36% in 2025 in the United States commercial bathroom products market, while business-to-consumer retail and e-commerce channels are poised for a 5.3% CAGR through 2031.
- By geography, the Northeast accounted for 32.25% in 2025 in the United States commercial bathroom products market, and the Southwest is projected to be the fastest-growing region at a 4.8% CAGR from 2026 to 2031.
Note: Market size and forecast figures in this report are generated using Mordor Intelligence’s proprietary estimation framework, updated with the latest available data and insights as of January 2026.
United States Commercial Bathroom Products Market Trends and Insights
Drivers Impact Analysis*
| Driver | (~) % Impact on CAGR Forecast | Geographic Relevance | Impact Timeline |
|---|---|---|---|
| Construction spending in nonresidential end-markets sustains fixture demand | +1.2% | National, with early gains in Southeast healthcare, Southwest data centers, and Northeast adaptive reuse | Medium term (2-4 years) |
| Codes, WaterSense, and LEED push low-flow and efficient fixtures in commercial projects | +0.9% | National under EPA, accelerated in CA, NY, OR, WA | Long term (≥ 4 years) |
| End-user hygiene expectations drive touchless faucets, flushometers, and dispensers retrofits | +0.8% | National, with intensity in airports, healthcare, and K-12 schools | Medium term (2-4 years) |
| Facility ESG targets and utility incentives accelerate high-efficiency replacements | +0.6% | National, led by portfolios pursuing LEED/WELL in urban markets | Long term (≥ 4 years) |
| IoT-connected smart restrooms enable predictive maintenance and lower lifecycle costs | +0.4% | National, the earliest adoption in large-format facilities | Medium term (2-4 years) |
| Legionella and ASHRAE-188 compliance elevates TMVs, automated flushing, and water safety | +0.5% | National in healthcare, strict in NY, NJ, CA, MI, IL, VA | Short term (≤ 2 years) |
| Source: Mordor Intelligence | |||


Construction Spending in Nonresidential End Markets
Nonresidential construction starts reached USD 80.3 billion in January 2026, the highest January on record and a 53.3% year-over-year increase, supported by USD 26.3 billion in megaprojects of USD 1 billion or more. The surge was led by offices that include data centers, which hit a single-month starts peak, and by hospitals and clinics that advanced alongside demographic demand for care. Forecasts indicate that data center investment will continue to grow while traditional office activity remains constrained by elevated vacancy and hybrid work dynamics through 2027 [2]American Institute of Architects, “AIA Consensus Construction Forecast,” American Institute of Architects, aia.org. Healthcare construction is expected to remain resilient, and medical outpatient building occupancy reached 92.7% as landlords gained pricing power, which sustains bid pipelines for healthcare-grade fixtures and water safety systems. These patterns shape procurement in the United States commercial bathroom products market as data centers favor standardized, repeatable bathroom modules to compress schedules, while healthcare and education prioritize ADA accessibility and Legionella risk mitigation through thermostatic mixing valves and automated flushing [3]Centers for Medicare & Medicaid Services, “Water Management Program Expectations Referencing ASHRAE 188,” Centers for Medicare & Medicaid Services, cms.gov.
Codes, WaterSense, and LEED Drive Efficient Fixtures
EPA finalized the Draft Version 2.0 WaterSense specification for private lavatory faucets in December 2024, tightening the maximum flow to 1.2 gpm, with an effective date about 12 months from publication. States including California, Colorado, New York, Oregon, Washington, Hawaii, and Maine already enforce 1.2 gpm, together covering 24.2% of the United States population, which codifies a retrofit opportunity in regions still using higher-flow products. For public lavatory faucets, EPA’s June 2024 notice proposed a 0.4 gpm to 0.35 gpm ceiling, building on product data that show a large installed base already operating at low flows. LEED v5 transitions water reductions from optional credits to baseline requirements, with submetering and performance tracking expected to push owners toward 1.28 gpf toilets and 0.35–0.4 gpm public faucets to satisfy compliance thresholds. The prior LEED v4.1 framework recorded an 11% water-use reduction across certified buildings, and the tighter v5 standard raises the bar for the United States commercial bathroom products market.
End-User Hygiene Expectations Accelerate Touchless Retrofits
Touchless operation has moved from preference to expectation in high-traffic settings such as airports, hospitals, and schools, which accelerates retrofits that replace manual faucets and flush valves with sensors that reduce contact points and water run time. Facility managers increasingly integrate soap and towel dispensers with restroom monitoring platforms to reduce in-use stockouts and to maintain consistent service levels during peak traffic. IoT sensors linked to a CMMS enable condition-based cleaning that focuses labor where usage thresholds are exceeded, which cuts emergency callouts and improves restroom uptime in labor-constrained operations. Post-pandemic guidance from health authorities favors touchpoint minimization in public assembly spaces, and water-contact materials compliant with NSF/ANSI 61 remain standard across new commercial installations. Together, these shifts are pushing sensor-equipped faucets, flushometers, and dispensers deeper into the specification lists that drive the United States commercial bathroom products market.
IoT-Connected Smart Restrooms Lower Lifecycle Cost
IoT restroom systems monitor consumables, occupancy, temperature, humidity, and leaks, and they connect through LoRaWAN, BLE, or WiFi gateways to cloud platforms that trigger automated work orders. Facilities that link sensors to a CMMS can maintain more than 99% supply availability and can target janitorial work to restrooms that cross usage or threshold alerts, which reduces waste and improves service consistency. Automated work-order creation removes manual steps, which accelerates response times and reduces the number of patrons affected by service issues during peak periods. TOTO’s ECOPOWER faucets and valves generate micro-hydroelectric power with each use and connect to the KOLO Smart Monitoring System, which gives managers live visibility into usage heatmaps and maintenance history. Zurn’s AquaSense system reports water consumption, cycle counts, battery status, and flush-to-wash ratios to benchmark hygiene program performance across locations, which underscores a shift to data-driven restroom operations in the United States commercial bathroom products market. Facilities that deploy these platforms report fast payback periods that are reinforced by lower supply waste, fewer emergency interventions, and longer fixture uptime.
Restraints Impact Analysis*
| Restraint | (~) % Impact on CAGR Forecast | Geographic Relevance | Impact Timeline |
|---|---|---|---|
| Skilled labor shortages and contractor capacity constraints delay installations | -1.1% | National, acute in high-growth metros and large data center programs | Short term (≤ 2 years) |
| Raw material price volatility for copper, brass, and steel pressures margins | -0.9% | National, amplified by 2025 import tariffs | Short term (≤ 2 years) |
| Ultra-low-flow drainline carry issues increase callbacks and design complexity | -0.3% | Retrofit-heavy regions with older building stock | Medium term (2-4 years) |
| Code fragmentation across IPC, UPC, and local amendments raises costs | -0.2% | National, with pain points for multi-state contractors and distributors | Long term (≥ 4 years) |
| Source: Mordor Intelligence | |||
Skilled Labor Shortages and Contractor Capacity Constraints Delay Installations
The construction sector needs an estimated 349,000 net new workers in 2026 to meet demand, and that requirement grows further in 2027, which constrains capacity for plumbing and mechanical installations [4]Associated Builders and Contractors, “2026 Construction Workforce Forecast,” Associated Builders and Contractors, abc.org. Contractors report persistent staffing challenges and schedule delays, and many firms cite worker shortages among both their own staff and their subcontractors. Foreign-born workers account for a meaningful share of the construction labor force, and enforcement actions can tighten local availability, which introduces project-level risks when schedules hinge on specialized trades. Extended timelines have become common as labor availability tightens, and builders report longer build cycles as permitting, procurement, and installation windows lengthen. These conditions favor prefabrication, standardized bathroom pods, and digital coordination that reduce the number of field hours per installed fixture in the United States commercial bathroom products market.
Raw Material Price Volatility Pressures Margins and Bid Discipline
The producer price index for materials and services used in nonresidential construction increased 3.3% from December 2024 to December 2025 as aluminum mill shapes rose 30.5%, steel mill products rose 17%, and copper and brass mill shapes rose 11.8% in the wake of 2025 import tariffs. Copper wire and cable prices jumped 22.3% year over year in December 2025, signaling broad inflation pressures on copper-intensive plumbing components. The cumulative increase in nonresidential input prices since 2020 has outpaced bid-price growth, which squeezes contractor margins and raises the risk of budget overruns if contracts lack escalation clauses. Elevated tariffs and price uncertainty complicate forward bids and encourage owners to evaluate alternatives and lifecycle cost tradeoffs as they specify premium water-saving fixtures. These pressures have reinforced the case for standardized SKUs and value engineering that preserve performance while reducing exposure to high-volatility alloys in the United States commercial bathroom products market.
*Our forecasts treat driver/restraint impacts as directional, not additive. The impact forecasts reflect baseline growth, mix effects, and variable interactions.
Segment Analysis
By Product Type: Soap Dispensers Lead Touchless Hygiene Wave
Toilets and urinals held the largest share at 38.16% of 2025 revenue, which reflects minimum fixture counts embedded in plumbing codes and stable demand in high-occupancy facilities that dominate the United States commercial bathroom products market. Replacement cycles in airports, stadiums, hospitals, and schools benefit from both high daily use and increased hygiene expectations that favor sensor-activated flush valves in place of manual systems. Flow standard tightening under WaterSense Version 2.0 and state-level 1.2 gpm thresholds for private lavatory faucets reinforce low-flow adoption across paired fixtures and fittings in new construction as well as tenant improvements. Designers and contractors continue to standardize on compatible components to simplify submittals, which drives bundled specifications that match flushometers, faucets, and supply kits for each restroom type in the United States commercial bathroom products market. These patterns keep core categories like toilets and urinals at the center of project bills of materials while making space for higher-value add-ons that extend performance and visibility through connected features.
Soap dispensers will be the fastest-growing product category at a 5.0% CAGR through 2031 as touchless operation and smart monitoring become common in modernized restrooms. Facilities that connect dispensers to restroom dashboards gain early refill alerts and usage analytics that help avoid stockouts and redirect cleaning teams to locations with actual need. Touchless faucets that pair with low-flow aerators at 0.35–0.5 gpm and smart soap systems improve hand hygiene programs, and low-energy electronics or energy-harvesting designs reduce battery service burden for staff. In healthcare and education buildings, integrated monitoring supports compliance efforts that require documented service levels and consistent hand-hygiene support in high-traffic restrooms. Together, these upgrades pull accessory lines into core specification packages and expand their role in the United States commercial bathroom products industry.


By Price/Quality Tier: Premium Fixtures Capitalize on LEED Mandate Shift
The standard or economy tier captured 35.25% share in 2025, anchored by budget-sensitive renovations, municipal procurement rules, and owners who prioritize upfront cost. Premium-tier fixtures are projected to grow at a 5.0% CAGR through 2031 as LEED v5 makes water reductions a baseline and not just a credit pathway, which increases the need for sub-1.28 gpf toilets and 0.35–0.4 gpm public lavatory faucets with sensors. EPA WaterSense labeling remains a procurement standard that simplifies rebate eligibility and supports performance verification at commissioning. This combination of code tightening and ESG-linked portfolio strategies is drawing more owners toward connected, low-flow systems with verifiable outcomes across water and maintenance.
Premium fixtures differentiate through corrosion-resistant metals, durable finishes, vandal-resistant aerators, and electronics that support usage tracking, leak alerts, and remote calibration. Facilities that standardize on one premium stack across faucets, flush valves, and dispensers reduce part variety and speed repairs, which improves uptime in high-demand locations. Submetering and cloud dashboards make savings visible in real time, which aligns with LEED v5’s push to measure and improve performance across portfolios. These elements underline why premium units are gaining share within the United States commercial bathroom products market, even in an environment of tight labor and volatile input costs. Broader adoption of smart fixtures also deepens vendor partnerships because post-install support and analytics insights become part of ongoing operations.
By End-User: Commercial Dominance Reflects Fixture Density and Compliance Mandates
Commercial applications represented 72.15% of demand in 2025, which reflects higher fixture densities and stricter compliance frameworks across airports, healthcare, education, retail, and public assembly. Healthcare facilities must maintain water management programs that reference ASHRAE 188 standards, which raises the specification bar for thermostatic mixing valves, automated flushing, and temperature monitoring at critical control points. Schools, stadiums, and terminals also favor touchless systems that minimize hand-contact points and manage water run times at scale. These end-markets depend on durable, high-cycle components and sensor systems that maintain hygiene and reduce downtime, which concentrates demand in the United States commercial bathroom products market.
The residential segment will grow fastest at a 4.4% CAGR through 2031, driven by retrofit activity in older homes and expanded availability of WaterSense rebates that lower the total cost of ownership. DIY-friendly touchless faucets and battery-powered dispensers lower installation barriers for small businesses and homeowners who want to improve hygiene and conserve water without hardwiring. Utility incentives support the replacement of 3.5 gpf legacy toilets with 1.28 gpf WaterSense models, which underscores steady pull-through even outside large projects. As awareness grows and products become easier to install, residential demand strengthens while commercial remains the backbone of the United States commercial bathroom products industry.
By Distribution Channel: B2B Project Sales Dominate; E-Commerce Drives B2C Acceleration
Business-to-business project sales held 68.36% in 2025 because architect and engineer specifications lock in products during design, and contractors procure in volume through distributor networks or direct from manufacturers. Large projects like hospitals and terminals favor standardized SKUs, factory-direct support, and submittal packages, which sustain B2B scale in the United States commercial bathroom products market. Design libraries and BIM assets further entrench selected systems during the bid phase because alternates require new reviews that lengthen schedules.
Business-to-consumer channels will grow at a 5.3% CAGR through 2031 as small businesses and homeowners buy touchless faucets and ADA-aligned upgrades via retail and e-commerce platforms. Online catalogs and clear installation guides draw price-sensitive buyers, while brand showrooms help customers specify complete suites for coordinated aesthetics in higher-end projects. State and local code adoption cycles and permitting practices continue to favor professional installation in commercial buildings, which keeps B2B channels central to large projects. Over time, connected fixture ecosystems create opportunities for hybrid models where owners buy hardware through distribution but subscribe to cloud monitoring direct from manufacturers.
Geography Analysis
The Northeast held 32.25% in 2025, supported by dense urban infrastructure, older building stock, and water-safety requirements that enforce frequent testing and documented water management plans. New York City will escalate Legionella sampling from quarterly to monthly in May 2026, which encourages systematic upgrades in cooling towers and domestic hot water controls in adjacent restrooms. Healthcare and education pipelines remain steady in major metros, and higher compliance standards favor touchless fixtures and thermostatic mixing valves that improve control and documentation. Harsh winters and legacy drainline constraints can complicate ultra-low-flow retrofits, which leads many owners to pair high-efficiency toilets with pressure-assist and piping improvements during renovations.
The Southeast accounts for a significant share anchored by population growth, tourism infrastructure, and healthcare expansions in markets such as Florida and Georgia. Airports, hotels, and theme parks pursue touchless retrofits and smart restroom monitoring to improve uptime during peak seasons, which supports premium categories. Multi-site operators benefit from more uniform model code use across many Southeastern states, which helps standardize specifications and consolidate SKUs for distribution. Industrial growth and military-related institutional work add a steady B2B pull for core fixtures, valves, and accessories across high-traffic restrooms.
The Southwest is projected to be the fastest-growing region at a 4.8% CAGR from 2026 to 2031, as data center and in-migration-driven development expand the installed base for connected, low-flow fixtures. Code adoption in leading metros supports current technologies, and plumbing right-sizing efforts help align low-flow performance with modern building use patterns. On the West Coast, California’s 1.2 gpm private faucet standard and strong water efficiency codes continue to push premium specifications, and portfolios that pursue LEED and similar frameworks sustain momentum for low-flow and connected products. Across these regions, migration patterns and high-compliance markets shape a two-speed profile in the United States commercial bathroom products market, where water efficiency, hygiene, and monitoring lead growth.
Competitive Landscape
The United States commercial bathroom products market is moderately concentrated, with the top five manufacturers holding 60–65% combined share, led by Kohler, American Standard, TOTO USA, Sloan Valve, and Zurn Elkay. Diversified portfolios help large brands win one-stop specifications across faucets, toilets, urinals, sinks, and coordinated systems. Category specialists use focused innovation in flushometers, sensor calibration, and hand-hygiene systems to defend niche leadership. Spec wins form upstream during design development when reps provide BIM content, submittal data, and AIA-accredited education that ties product choices to code and certification outcomes. In a labor-constrained market, manufacturers that support prefabrication, standardized assemblies, and rapid submittal support create switching costs that favor incumbents.
Two technology vectors stand out. First, connected fixtures that integrate with restroom monitoring platforms are shifting plumbing from mechanical-only to software-visible systems that improve operations and reporting. Second, water-safety solutions that bundle thermostatic mixing, automated flushing, and temperature monitoring align with ASHRAE-188-informed programs in healthcare and high-risk occupancies. Input price volatility and tariffs are compressing margins, which makes supply chain agility and careful alloy selection a competitive advantage for fixture makers and distributors. Players who help owners navigate rebate programs and document performance under WaterSense and LEED maintain a consultative edge across the specification cycle.
Recent moves reinforce these themes. Sloan introduced a 0.75 gpf pressure-assisted toilet designed for high efficiency with strong drainline performance, expanding options for new light-commercial installations. TOTO connected ECOPOWER faucets and flush valves to the KOLO Smart Monitoring System to deliver usage and maintenance analytics without external power, which reduces battery servicing in high-use locations. Zurn’s AquaSense suite exposes telemetry on water consumption and hygiene indicators, making performance visible for hospitals and schools with reporting needs. American Standard expanded a plumber rebate program that supports WaterSense-labeled installations and strengthens trade relationships, which aligns incentives across the channel. These strategic steps deepen ties to code compliance, ESG reporting, and operational savings that are shaping the United States commercial bathroom products market.
United States Commercial Bathroom Products Industry Leaders
Kohler Co.
American Standard (LIXIL)
Sloan Valve Company
Zurn Elkay Water Solutions
TOTO USA
- *Disclaimer: Major Players sorted in no particular order

Recent Industry Developments
- April 2026: Topeka, Kansas, adopted the 2024 editions of the Uniform Plumbing Code and Uniform Mechanical Code, reducing needed local amendments and aligning city practice with current model standards.
- November 2025: LIXIL’s American Standard brand announced an enhanced Plumber Rebate Program to support WaterSense-labeled product installations across commercial and residential settings.
- December 2024: EPA finalized WaterSense Version 2.0 for private lavatory faucets, lowering the maximum allowable flow to 1.2 gpm with an effective date about 12 months from publication.
- August 2024: Sloan Valve Company introduced a 0.75 gpf pressure-assisted toilet using Flushmate’s 503UH system, achieving long drainline carry performance for light-commercial applications.


United States Commercial Bathroom Products Market Report Scope
Bathroom products are ceramic plumbing fixtures such as sinks, lavatories, or toilet bowls. It is an essential element in enhancing the splendor of the bathroom. Bathroom products are available in different sizes and styles and offer various features.
The United States Commercial Bathroom Products Market Report is Segmented by Product Type (Toilets & Urinals, Soap Dispensers, Faucets & Shower Systems, Sinks/Washbasins, Bathtubs, Others), Price/Quality Tier (Standard/Economy, Premium, Luxury/High-End), End-User (Residential, Commercial), Distribution Channel (B2C/Retail [Multi-Brand Stores, Exclusive Brand Outlets, Online, Local Hardware Stores], B2B/Project), and Geography (Northeast, Southeast, Midwest, Southwest, West). The Market Forecasts are Provided in Terms of Value (USD).
| Toilets & urinals |
| Soap Dispensers |
| Faucets & shower systems |
| Sinks / washbasins |
| Bathtub |
| Others |
| Standard / economy |
| Premium |
| Luxury / high-end |
| Residential |
| Commercial |
| B2C/Retail Distribution Channel | Multi-Brand Stores |
| Exclusive Brand Outlets | |
| Online | |
| Local Hardware Stores | |
| B2B/Project |
| Northeast |
| Southeast |
| Midwest |
| Southwest |
| West |
| By Product Type | Toilets & urinals | |
| Soap Dispensers | ||
| Faucets & shower systems | ||
| Sinks / washbasins | ||
| Bathtub | ||
| Others | ||
| By Price / Quality Tier | Standard / economy | |
| Premium | ||
| Luxury / high-end | ||
| By End-User | Residential | |
| Commercial | ||
| By Distribution Channel | B2C/Retail Distribution Channel | Multi-Brand Stores |
| Exclusive Brand Outlets | ||
| Online | ||
| Local Hardware Stores | ||
| B2B/Project | ||
| By Geography | Northeast | |
| Southeast | ||
| Midwest | ||
| Southwest | ||
| West | ||


Key Questions Answered in the Report
What is the current size and growth outlook for the United States commercial bathroom products market?
The market was USD 356.7 million in 2025 and is expected to rise from USD 369.1 million in 2026 to USD 438 million by 2031 at a 3.5% CAGR.
Which product categories are leading, and which are growing fastest in the United States commercial bathroom products market?
Toilets and urinals led with 38.16% of 2025 revenue, while soap dispensers are projected to grow the fastest at a 5.0% CAGR through 2031.
How do regulations like WaterSense and LEED v5 affect specifications?
EPA WaterSense Version 2.0 tightens faucet flows to 1.2 gpm, and LEED v5 elevates water reductions to baseline requirements, which shifts specifications toward sub-1.28 gpf toilets and 0.35–0.4 gpm public faucets.
What end-users are driving demand in the United States commercial bathroom products market?
Commercial facilities accounted for 72.15% of demand in 2025, supported by healthcare, education, airports, and other high-traffic venues that favor touchless operation and compliance-ready systems.
Which regions offer the strongest opportunities ahead?
The Southwest is projected as the fastest-growing region at a 4.8% CAGR to 2031, while the Northeast held the largest 2025 share at 32.25%.
How are IoT and smart restrooms changing operations?
Connected faucets, valves, and dispensers with restroom monitoring platforms drive faster response times, better stock availability, and lower maintenance costs with quick paybacks.
Page last updated on:


