Market Overview
| Study Period | 2021 - 2031 |
|---|---|
| Forecast Data Period | 2026 - 2031 |
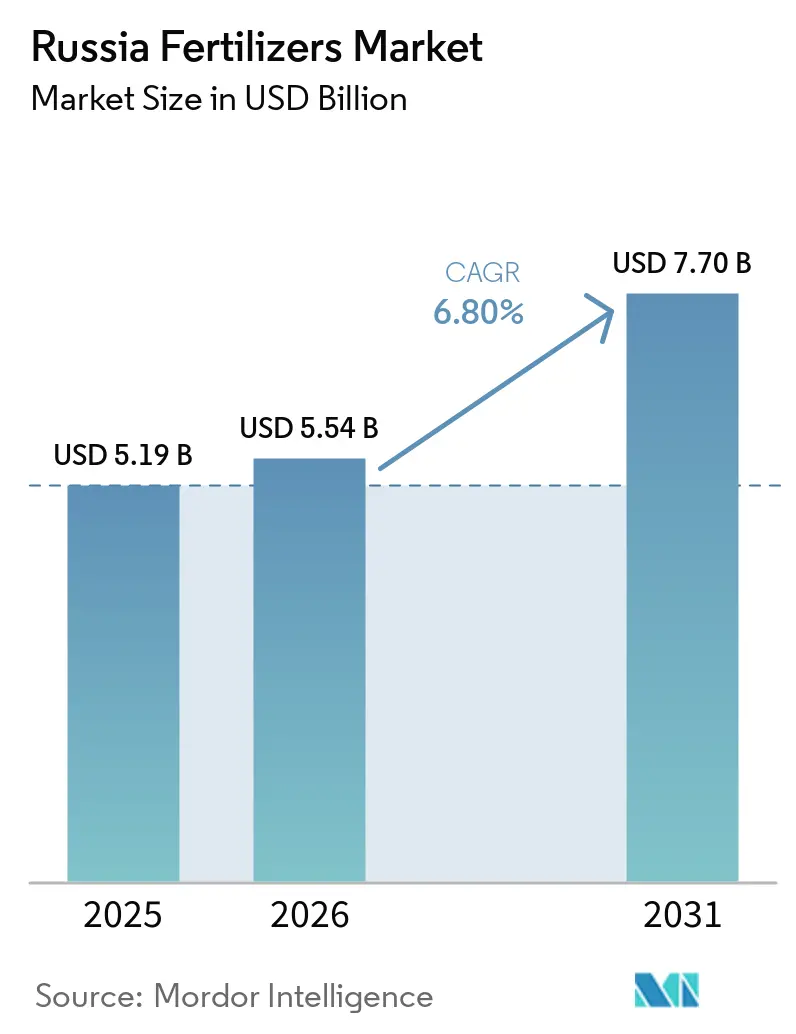
| Base Year Market Size (2025) | USD 5.19 Billion |
| Market Size (2026) | USD 5.54 Billion |
| Market Size (2031) | USD 7.70 Billion |
| Growth Rate (2026 - 2031) | 6.80% CAGR |
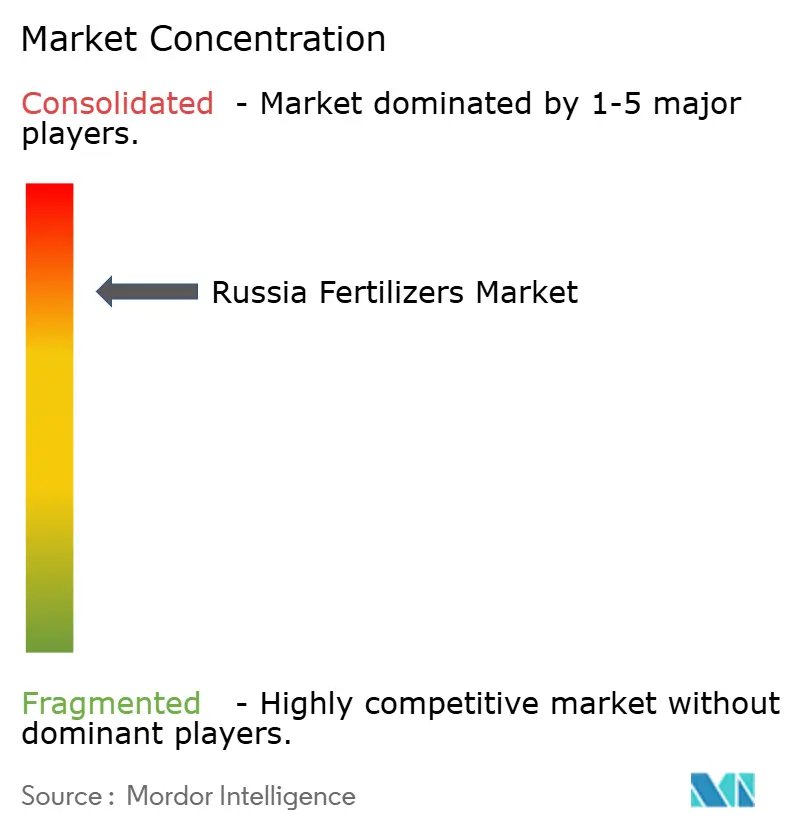
| Market Concentration | High |
Major Players *Disclaimer: Major Players sorted in no particular order Image © Mordor Intelligence. Reuse requires attribution under CC BY 4.0. | |
Russia Fertilizers Market Analysis by Mordor Intelligence
The Russia fertilizers market size is valued at USD 5.19 billion in 2025, estimated at USD 5.54 billion, and is forecast to reach USD 7.70 billion by 2031 at a CAGR of 6.80% over 2026-2031. Domestic crop nutrient demand and export-led production capacity continue to support the Russia fertilizers market, especially given the country's large grain acreage and strong position in global fertilizer trade. Russia accounted for nearly one-fifth of the global fertilizer trade, making its fertilizer market closely tied to international demand trends, trade flows, and export market dynamics. The country's grain harvest reached 144.6 million metric tons in 2025[1]Source: TASS Staff, “Russia's Grain Harvest Totaled 144.6 Mln Tons in 2025, Minister,” TASS, tass.com, marking the third-highest level in its history. This robust harvest has driven strong domestic fertilizer demand across major crop-producing regions, underscoring the critical role of nutrient inputs in sustaining agricultural productivity. Export destinations are increasingly shifting toward Brazil, India, and China, indicating a reorientation of Russia's trade relationships. Fertilizer exports are expanding, driven by the country's robust production base and global competitiveness. However, the market continues to face challenges, including logistics constraints, tariff pressures, payment complexities, and sulfur price volatility, which impact domestic operations and export performance.
Key Report Takeaways
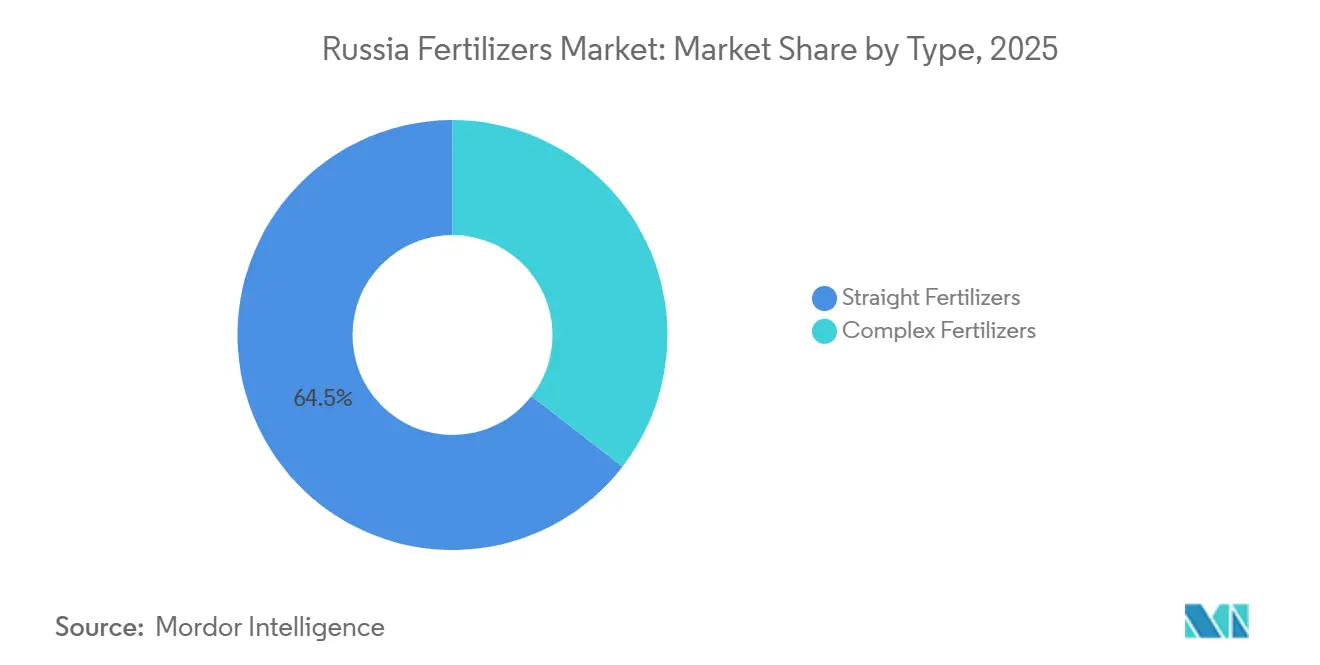
- By type, straight fertilizers held the largest Russia fertilizers market share at 64.5% in 2025, while Complex Fertilizers are the fastest-growing at a 7.4% CAGR through 2031.
- By form, conventional was the largest segment at 81.8% in 2025, while Specialty is the fastest-growing at an 8.1% CAGR through 2031.
- By application mode, soil accounted for the largest Russia fertilizers market size at 72.6% in 2025, while Fertigation is forecast to be the fastest-growing at an 8.5% CAGR through 2031.
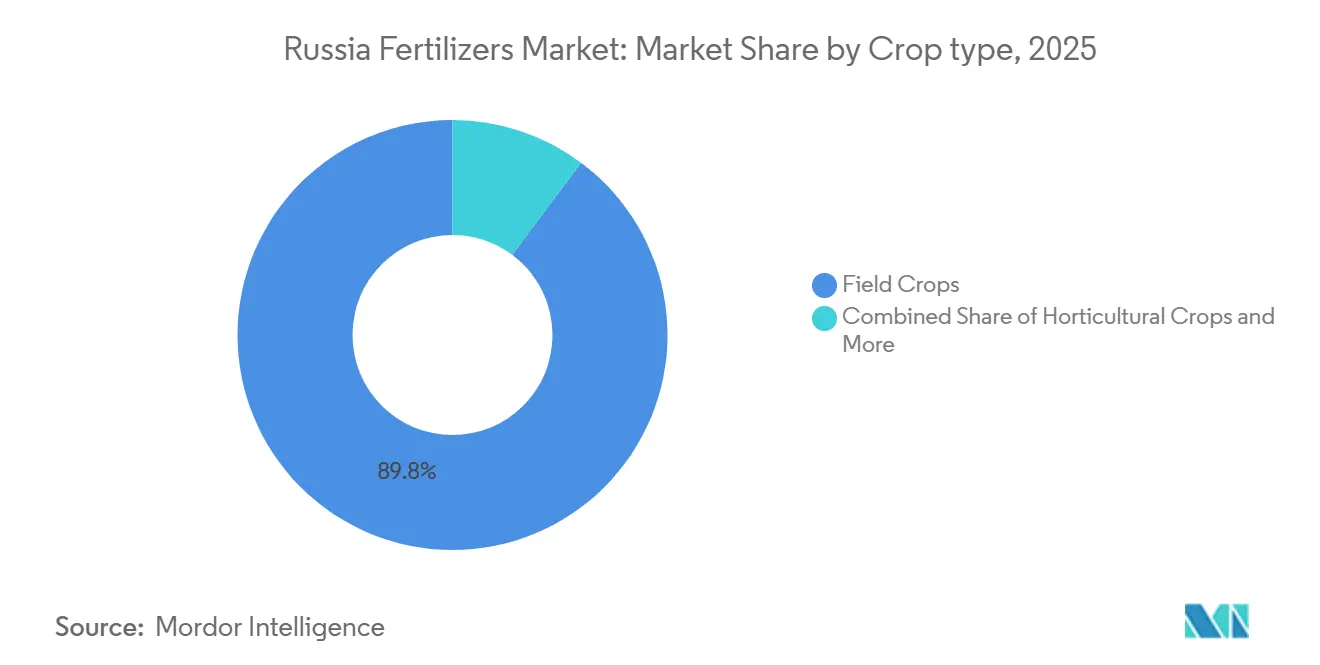
- By crop type, field crops represented the largest segment at 89.8% in 2025, while Horticultural Crops are projected to be the fastest-growing at a 7.9% CAGR through 2031.
Note: Market size and forecast figures in this report are generated using Mordor Intelligence’s proprietary estimation framework, updated with the latest available data and insights as of January 2026.
Russia Fertilizers Market Trends and Insights
Drivers Impact Analysis*
| Driver | (~) % Impact on CAGR Forecast | Geographic Relevance | Impact Timeline |
|---|---|---|---|
| Export realignment toward BRICS and Asia-Pacific buyers | +1.3% | Russia, Brazil, India, China, Africa, and Western Asia | Medium term (2-4 years) |
| Domestic feedstock advantage for nitrogen fertilizers | +1.2% | Russia, with export spillover into Asia and South America | Long term (≥ 4 years) |
| Higher yield cropping intensity in key grain regions | +0.8% | Russia, especially Krasnodar, Stavropol, Rostov, and the Volga region | Medium term (2-4 years) |
| Government export quotas supporting domestic supply stability | +0.7% | Russia, with indirect effect on EAEU trade balance | Short term (≤ 2 years) |
| Precision nutrient management in large scale grain farming | +0.6% | Russia, especially large southern grain belts | Medium term (2-4 years) |
| Eurasian Economic Union (EAEU) compliance incentivizing standardized product formulations | +0.5% | Russia and the broader EAEU region | Long term (≥ 4 years) |
| Source: Mordor Intelligence | |||


Export Realignment Toward BRICS and Asia-Pacific Buyers
The Russia fertilizers market has been reshaped by a clear export pivot toward BRICS and Asia-Pacific buyers. BRICS countries accounted for 50% of all Russian fertilizer exports in 2025, up from nearly one-third in 2019, underscoring how quickly the buyer base shifted after 2022. Brazil, India, and China have emerged as key destinations for Russian fertilizer exports, reflecting a strategic reorientation of trade flows toward major agricultural economies. This shift is helping offset reduced sales to traditional European markets while fostering longer-term bilateral supply relationships with large food-producing nations. The Agriculture Ministry said in June 2026 that it is encouraging partners to sign 3-year supply contracts, indicating that the Russia fertilizer market is moving from short-term redirection toward longer-term commercial lock-in[2]Source: Izvestia Staff, “Give Me Grain, the Harvest in Russia in 2025 Will Exceed Last Year's,” Izvestia, iz.ru.
Domestic Feedstock Advantage for Nitrogen Fertilizers
Low-cost feedstock remains one of the strongest structural supports for the Russia fertilizers market. The draft links Russian nitrogen competitiveness to the country’s domestic gas advantage, which continues to shield producers from some of the pressure from freight premiums and trade restrictions. That cost position helped Uralchem more than double its shipments to APEC economies since 2022, reaching 6.5 million metric tons in 2025. The result is that the Russian fertilizer market keeps a workable floor under nitrogen production even when destination-market pricing becomes more aggressive. This advantage also means Russian nitrogen producers are likely to retain commercial leverage against higher-cost competitors during the forecast period.
High Yield Cropping Intensity in Key Grain Regions
The Russia fertilizers market is also being supported by rising nutrient use across the grain belt. Grain output reached 144.6 million metric tons in 2025, up from more than 130 million metric tons in 2024, which strengthened the need for a dependable fertilizer supply across major farm regions. Wheat yields improved to 31.7 centners per hectare in 2025 from 27.8 centners per hectare in 2024, and the Ministry of Agriculture tied those gains to better seeds, modern fertilizers, and stronger plant protection practices. That pattern matters because it shows fertilizer use is being pushed more by yield intensity than by simple area expansion. For the Russia fertilizers market, this supports stronger demand for balanced blends, specialty grades, and micronutrient additions over time.
Government Export Quotas Supporting Domestic Supply Stability
The Russian quota system continues to stabilize the Russia fertilizers market at home. The government set an export quota of 18.7 million metric tons for December 2025 through May 2026, including 10.6 million metric tons for nitrogen fertilizers and 8 million metric tons for complex fertilizers. A separate quota of nearly 20 million metric tons covered June through November 2025, showing how regularly the state has used this tool to manage supply[3]Source: AKM Staff, “The Cabinet of Ministers Extended Quotas for the Export of Fertilizers Until November 30,” AKM, akm.ru. These rolling limits reduce the risk that export surges will drain product away from local planting seasons. In the Russia fertilizers market, this gives domestic growers greater confidence in product availability and supports farm planning before spring and autumn demand peaks.
Restraints Impact Analysis*
| Restraint | (~) % Impact on CAGR Forecast | Geographic Relevance | Impact Timeline |
|---|---|---|---|
| Logistics friction across black sea and rail corridors | -0.8% | Russia, Europe, and South America trade routes | Short term (≤ 2 years) |
| Payment and insurance constraints on cross border trade | -0.6% | Russia, Europe, and global shipping channels | Medium term (2-4 years) |
| Tariff pressure in core export destinations | -0.5% | Russia and Europe, with spillover into substitute markets | Medium term (2-4 years) |
| Sulfur and other input volatility for phosphate chains | -0.3% | Russia and phosphate-producing clusters | Short term (≤ 2 years) |
| Source: Mordor Intelligence | |||
Logistics Friction Across Black Sea and Rail Corridors
Logistics remains one of the clearest operating limits for the Russia fertilizers market. The draft notes that Black Sea port disruptions and rail routing constraints have increased freight lead times and working capital requirements for exporters. In May 2026, nitrogen fertilizer rail exports fell 8% year on year to 1.4 million metric tons, while potash rail exports rose 10% to 1.2 million metric tons, and phosphate and complex shipments held steady at 1.2 million metric tons, showing how corridor stress can distort the product mix rather than simply cut total volume. Port Alliance still shipped 933,400 metric tons of mineral fertilizers to Brazilian buyers in the first 5 months of 2026, which shows that firms with stronger infrastructure remain better placed in the Russia fertilizers market. The North-South Corridor offers a useful alternative path, but its capacity still falls short of the scale the Russian fertilizers market needs for a wider rerouting effort.
Payment and Insurance Constraints on Cross-Border Trade
Payment and insurance issues continue to slow the Russian fertilizer market, even as product demand remains firm. Food security exemptions have enabled fertilizer exports in many cases, but they have not resolved the operational problems associated with correspondent banking, letters of credit, and marine cover. Skuld noted the sanctions climate in 2025, and Reuters reported in March 2026 that Russian producers could not quickly scale exports in response to Middle East supply disruptions because financial and commercial plumbing remained constrained. These issues force buyers and sellers to use slower and more costly settlement structures. In the Russia fertilizers market, this reduces speed, adds friction to new customer onboarding, and weakens some of the benefits created by Russia’s production scale.
*Our forecasts treat driver/restraint impacts as directional, not additive. The impact forecasts reflect baseline growth, mix effects, and variable interactions.
Segment Analysis
By Type: Straight Fertilizers Anchors, Complex Grades Gaining Momentum
Straight Fertilizers held 64.5% of the Russia fertilizers market share in 2025, which made them the largest product type by a wide margin. Their dominance reflects the heavy use of urea, ammonium nitrate, and DAP across Russia’s large grain and oilseed areas. Within this group, nitrogenous grades account for the highest absolute volumes, and Acron’s liquid Urea Ammonium Nitrate (UAN) output rose 1.7 times in 2025 to 1.4 million metric tons after the Ammonia-3 revamp at Veliky Novgorod. Potassic grades remain tied to a narrower supply base, which keeps that part of the Russia fertilizers market structurally more concentrated.
Complex Fertilizers will grow at a 7.4% CAGR through 2031, making them the fastest-expanding segment in the Russia fertilizers market. Large farms are moving toward NPK blends because balanced nutrient delivery is more efficient in a single field pass. Secondary macronutrients and micronutrients still represent smaller volumes, but they offer better pricing and better fit with tailored crop programs. The draft also links product standardization requirements under the Eurasian Economic Union (EAEU) framework to a stronger position for larger suppliers, because they can manage registration and documentation more easily. As a result, the Russia fertilizers market is shifting from simple tonnage growth toward a richer mix of higher-value formulations.


By Form: Conventional Dominance, Specialty Supports Value Growth
Conventional form accounted for 81.8% share of the Russia fertilizers market size in 2025, which shows how strongly the market still depends on large-scale field application. Bulk granular products remain the practical choice across millions of hectares because they fit existing farm equipment and seasonal work patterns. Conventional grades such as prilled urea, ammonium nitrate, and granular DAP also support Russia’s export position in large commodity markets. PhosAgro launched granular ammonium sulfate production at its Krasnodar facility in 2025, which added a sulfur-enriched conventional product aimed at domestic grain demand. That keeps conventional products at the center of the Russia fertilizers market even as growth starts to shift elsewhere.
Specialty form will grow at 8.1% CAGR through 2031, which makes it the fastest-growing form segment in the Russia fertilizers market. Controlled-release, slow-release, liquid, and water-soluble products are benefiting from both precision grain farming and intensive horticulture. These grades command better unit margins and respond more closely to targeted nutrient management systems. They are also being pulled by fertigation, greenhouse expansion, and higher-value crop systems near urban centers. This means the Russia fertilizers market is likely to post stronger value growth in specialty products than in bulk conventional fertilizers over time.
By Application Mode: Soil Dominance Remains Strong, Fertigation Builds the Fastest Growth Path
Soil application held 72.6% of the Russia fertilizers market in 2025, which reflects the operating logic of large-scale grain farming. Pre-sowing and topdressing through broad-acre equipment remain the normal approach across Russia’s major crop regions. This keeps the Russia fertilizers market anchored in bulk nutrient delivery rather than highly targeted application methods. Foliar remains the smallest segment and is used more often in greenhouse, horticultural, and selected precision grain systems. The large gap between soil and foliar use indicates that the Russian fertilizer market remains heavily weighted toward conventional field nutrition.
Fertigation will grow at a 8.5% CAGR through 2031, the highest rate among all application modes in the Russia fertilizers market. Growth is being driven by the expansion of drip irrigation in southern fruit and vegetable belts and by greenhouse projects that require continuous nutrient delivery. The draft also ties this shift to the Ministry of Agriculture’s focus on intensifying oilseed, fruit, and vegetable production. Acron’s planned urea expansion to 2.5 million metric tons per year at Veliky Novgorod includes water-soluble output that directly targets the fertigation channel. The result is a clear directional shift in the Russia fertilizers market, even though soil application will remain dominant by volume.
By Crop Type: Field Crops Hold Scale, Horticulture Opens a Higher-Value Channel
Field Crops captured 89.8% of the Russia fertilizers market by crop type in 2025, making it the primary source of fertilizer demand across the market. Wheat, barley, corn, and sunflower dominated national output and sat behind Russia’s 144.6 million metric ton grain and oilseed harvest in 2025. Field crop systems use large volumes of nitrogen and NPK blends, but at a lower per-hectare cost intensity than more intensive crop systems. That gives the Russia fertilizers market a very strong volume base while also limiting average selling price growth in the largest crop category. This segment remains essential because it underpins both domestic demand stability and the scale economics of fertilizer supply.
Horticultural Crops will grow at a 7.9% CAGR through 2031, making them the fastest-growing crop segment in the Russia fertilizers market. This part of the demand benefits from greenhouse expansion, soft-fruit cultivation, and broader food self-sufficiency goals. It also matters because per-hectare fertilizer spending in horticultural systems can be 5 times to 10 times higher than in field crop systems. That spending profile gives specialty and complex fertilizer makers a more valuable outlet than standard grain applications. Turf and Ornamental remains small, but the Russia fertilizers market could see some gradual support there from urban greening and municipal landscape programs.
Geography Analysis
The Central Federal District is the largest fertilizer-consuming region in the Russian fertilizers market. This is driven by the highly productive Black Earth farming areas and intensive grain cultivation systems. Strong wheat production, high fertilizer application intensity, and proximity to major distribution networks have enabled the region to maintain its leading position. The Southern Federal District and North Caucasian Federal District are also significant demand centers due to their focus on commercial wheat and oilseed production. These regions are increasingly adopting specialty and complex fertilizers as growers aim to enhance yields, nutrient efficiency, and crop quality.
The Volga Federal District is another key contributor to the Russian fertilizers market, supported by extensive cultivation of grains, sugar beets, and sunflowers. Fertilizer application intensity in this region is lower compared to the Central and Southern regions, as sunflower production typically requires fewer nutrient inputs than wheat. This disparity presents a growth opportunity, as improvements in fertilizer application practices and regional support programs could boost nutrient usage and drive demand. Initiatives to support fertilizer purchases are also projected to promote broader adoption across key agricultural areas.
The Northwestern Federal District primarily serves as Russia's main fertilizer production hub rather than a major consumption center. The region hosts significant production facilities and plays a vital role in supporting national fertilizer supply and export activities. Potash production is concentrated in the Ural Federal District, while the Siberian and Far Eastern Federal Districts exhibit relatively low fertilizer application rates due to logistical challenges and limited distribution infrastructure. However, as agricultural development in these regions progresses, they represent a substantial long-term growth opportunity for the Russian fertilizers market and could significantly contribute to future demand growth.
Competitive Landscape
The Russia fertilizers market is highly concentrated, with PhosAgro Group, EuroChem Group AG, and Acron Group leading as the primary producers. This concentration is attributed to the capital-intensive nature of fertilizer production and the strong vertical integration of major companies across raw material sourcing, chemical processing, manufacturing, and logistics. Uralchem Group, TogliattiAzot, and KuibyshevAzot PJSC also hold significant market positions, leveraging established production assets and long-standing relationships across both domestic and export channels. The scale and operational reach of these companies allow them to remain competitive despite fluctuating trade conditions and evolving market demands.
Leading companies are strategically focused on expanding production capabilities and strengthening their presence in higher-value fertilizer categories. PhosAgro Group, EuroChem Group AG, Acron Group, and Uralchem Group are actively investing in capacity expansion, product diversification, and efficiency improvements to solidify their market positions. Increasing interest in specialty fertilizers, water-soluble products, and solutions compatible with precision agriculture is driving producers to expand their product portfolios beyond conventional fertilizers. This trend reflects the growing demand for nutrient efficiency, crop-specific formulations, and advanced agronomic solutions within Russian agriculture.
Beyond the leading producers, companies such as Shchekinoazot, Rossosh Mineral Fertilizers, Minudobreniya JSC, Azot Group, KazAzot, and Belaruskali primarily cater to regional markets or specific product segments. International players, including Yara International ASA, ICL Group Ltd., and CF Industries Holdings, Inc., maintain a presence in the market through specialized products and technical expertise. The most significant growth opportunity in the Russia fertilizers market lies in specialty fertilizers, micronutrient formulations, and fertigation-compatible products. Adoption of these products is increasing alongside the rise of precision agriculture practices, with no single supplier yet dominating this segment.
Russia Fertilizers Industry Leaders
Yara International ASA
PhosAgro Group
Uralchem Group
Acron Group
EuroChem Group AG
- *Disclaimer: Major Players sorted in no particular order

Recent Industry Developments
- June 2026: EuroChem Group AG confirmed that its Kingisepp expansion project in Russia's Leningrad Region remains on schedule for a third quarter 2026 startup, adding new ammonia and urea production capacity and strengthening supply in the Russia fertilizers market.
- June 2026: Acron Group completed a USD 142 million modernization project at its Ammonia-3 unit in Veliky Novgorod, increasing ammonia production capacity to 830,000 tons annually and strengthening production efficiency in the Russia fertilizers market through lower natural gas consumption and higher output.
- December 2025: Uralchem Group entered a joint venture agreement with India Potash Ltd. and Rashtriya Chemicals and Fertilisers Ltd. to establish a urea production facility in Russia, strengthening long term fertilizer supply security and reinforcing Russia’s position as a strategic fertilizer production hub.


Russia Fertilizers Market Report Scope
The fertilizers market comprises products that supply essential nutrients to crops to improve soil fertility, enhance plant growth, increase agricultural productivity, and support crop quality across field, horticultural, and specialty farming systems.
The Russia Fertilizers Market Report is Segmented by Type (Straight and Complex), by Form (Conventional and Specialty), by Application Mode (Fertigation, Foliar, and Soil), and by Crop Type (Field Crops, Horticultural Crops, and Turf and Ornamental). The Report Offers Market Size in Both Market Value in USD and Market Volume in Metric Tons.
By Product Type
| Complex Fertilizers | ||
| Straight Fertilizers | Micronutrients | Boron |
| Copper | ||
| Iron | ||
| Manganese | ||
| Molybdenum | ||
| Zinc | ||
| Others | ||
| Nitrogenous | Ammonium Nitrate | |
| Anhydrous Ammonia | ||
| Urea | ||
| Others | ||
| Phosphatic | Muriate of Potash | |
| Di-ammonium Phosphate (DAP) | ||
| Mono Ammonium Phosphate (MAP) | ||
| Single Super Phosphate (SSP) | ||
| Triple Superphosphate (TSP) | ||
| Others | ||
| Potassic | Muriate of Potash (MoP) | |
| Sulphate of Potash (SoP) | ||
| Others | ||
| Secondary Macronutrients | Calcium | |
| Magnesium | ||
| Sulfur | ||
By Form
| Conventional | |
| Speciality | Controlled-Release Fertilizer (CRF) |
| Liquid Fertilizer | |
| Slow-Release Fertilizer (SRF) | |
| Water Soluble |
By Application
| Fertigation |
| Foliar |
| Soil |
By Crop Type
| Field Crops |
| Horticultural Crops |
| Turf and Ornamental Crops |
| By Product Type | Complex Fertilizers | ||
| Straight Fertilizers | Micronutrients | Boron | |
| Copper | |||
| Iron | |||
| Manganese | |||
| Molybdenum | |||
| Zinc | |||
| Others | |||
| Nitrogenous | Ammonium Nitrate | ||
| Anhydrous Ammonia | |||
| Urea | |||
| Others | |||
| Phosphatic | Muriate of Potash | ||
| Di-ammonium Phosphate (DAP) | |||
| Mono Ammonium Phosphate (MAP) | |||
| Single Super Phosphate (SSP) | |||
| Triple Superphosphate (TSP) | |||
| Others | |||
| Potassic | Muriate of Potash (MoP) | ||
| Sulphate of Potash (SoP) | |||
| Others | |||
| Secondary Macronutrients | Calcium | ||
| Magnesium | |||
| Sulfur | |||
| By Form | Conventional | ||
| Speciality | Controlled-Release Fertilizer (CRF) | ||
| Liquid Fertilizer | |||
| Slow-Release Fertilizer (SRF) | |||
| Water Soluble | |||
| By Application | Fertigation | ||
| Foliar | |||
| Soil | |||
| By Crop Type | Field Crops | ||
| Horticultural Crops | |||
| Turf and Ornamental Crops | |||


Market Definition
- MARKET ESTIMATION LEVEL - Market Estimations for various types of fertilizers has been done at the product-level and not at the nutrient-level.
- NUTRIENT TYPES COVERED - Primary Nutrients: N, P and K, Secondary Macronutrients: Ca, Mg and S, Micronutients: Zn, Mn, Cu, Fe, Mo, B, and Others
- AVERAGE NUTRIENT APPLICATION RATE - This refers to the average volume of nutrient consumed per hectare of farmland in each country.
- CROP TYPES COVERED - Field Crops: Cereals, Pulses, Oilseeds, and Fiber Crops Horticulture: Fruits, Vegetables, Plantation Crops and Spices, Turf Grass and Ornamentals
| Keyword | Definition |
|---|---|
| Fertilizer | Chemical substance applied to crops to ensure nutritional requirements, available in various forms such as granules, powders, liquid, water soluble, etc. |
| Specialty Fertilizer | Used for enhanced efficiency and nutrient availability applied through soil, foliar, and fertigation. Includes CRF, SRF, liquid fertilizer, and water soluble fertilizers. |
| Controlled-Release Fertilizers (CRF) | Coated with materials such as polymer, polymer-sulfur, and other materials such as resins to ensure nutrient availability to the crop for its entire life cycle. |
| Slow-Release Fertilizers (SRF) | Coated with materials such as sulfur, neem, etc., to ensure nutrient availability to the crop for a longer period. |
| Foliar Fertilizers | Consist of both liquid and water soluble fertilizers applied through foliar application. |
| Water-Soluble Fertilizers | Available in various forms including liquid, powder, etc., used in foliar and fertigation mode of fertilizer application. |
| Fertigation | Fertilizers applied through different irrigation systems such as drip irrigation, micro irrigation, sprinkler irrigation, etc. |
| Anhydrous Ammonia | Used as fertilizer, directly injected into the soil, available in gaseous liquid form. |
| Single Super Phosphate (SSP) | Phosphorus fertilizer containing only phosphorus which has lesser than or equal to 35%. |
| Triple Super Phosphate (TSP) | Phosphorus fertilizer containing only phosphorus greater than 35%. |
| Enhanced Efficiency Fertilizers | Fertilizers coated or treated with additional layers of various ingredients to make it more efficient compared to other fertilizers. |
| Conventional Fertilizer | Fertilizers applied to crops through traditional methods including broadcasting, row placement, ploughing soil placement, etc. |
| Chelated Micronutrients | Micronutrient fertilizers coated with chelating agents such as EDTA, EDDHA, DTPA, HEDTA, etc. |
| Liquid Fertilizers | Available in liquid form, majorly used for application of fertilizers to crops through foliar and fertigation. |


Research Methodology
Mordor Intelligence follows a four-step methodology in all our reports.
- Step-1: IDENTIFY KEY VARIABLES: In order to build a robust forecasting methodology, the variables and factors identified in Step-1 are tested against available historical market numbers. Through an iterative process, the variables required for market forecast are set and the model is built on the basis of these variables.
- Step-2: Build a Market Model: Market-size estimations for the forecast years are in nominal terms. Inflation is not a part of the pricing, and the average selling price (ASP) is kept constant throughout the forecast period for each country.
- Step-3: Validate and Finalize: In this important step, all market numbers, variables and analyst calls are validated through an extensive network of primary research experts from the market studied. The respondents are selected across levels and functions to generate a holistic picture of the market studied.
- Step-4: Research Outputs: Syndicated Reports, Custom Consulting Assignments, Databases & Subscription Platforms


