Market Overview
| Study Period | 2019 - 2031 |
|---|---|
| Forecast Data Period | 2026 - 2031 |
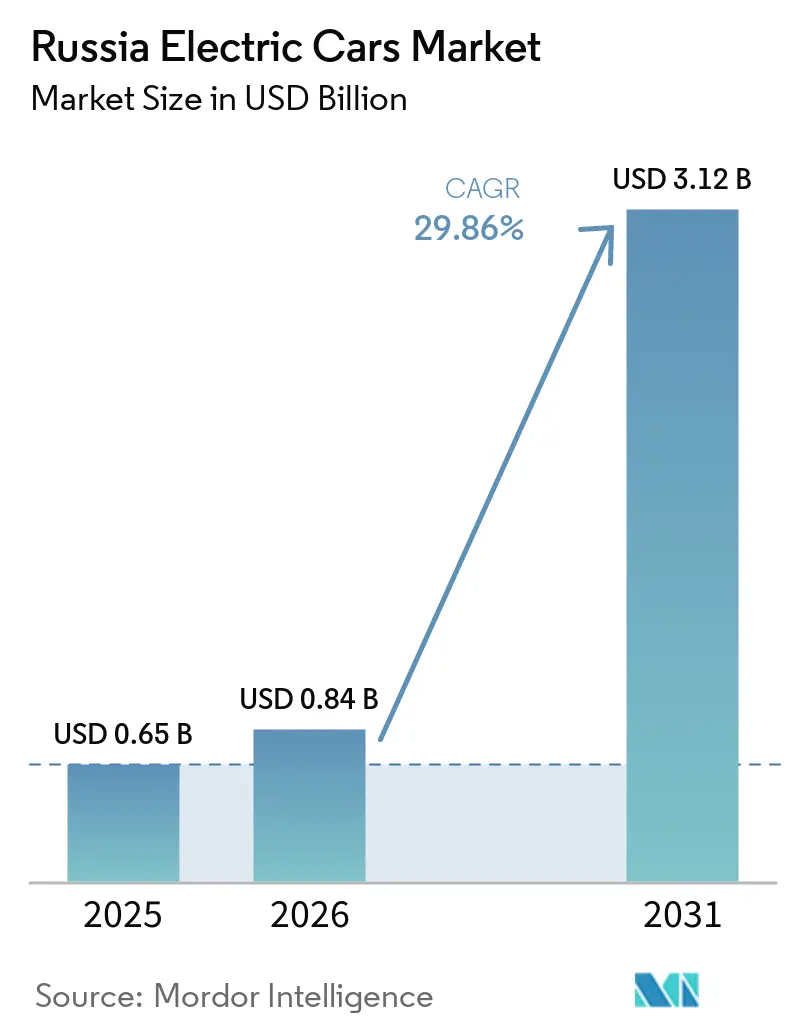
| Base Year Market Size (2025) | USD 0.65 Billion |
| Market Size (2026) | USD 0.84 Billion |
| Market Size (2031) | USD 3.12 Billion |
| Growth Rate (2026 - 2031) | 29.86% CAGR |
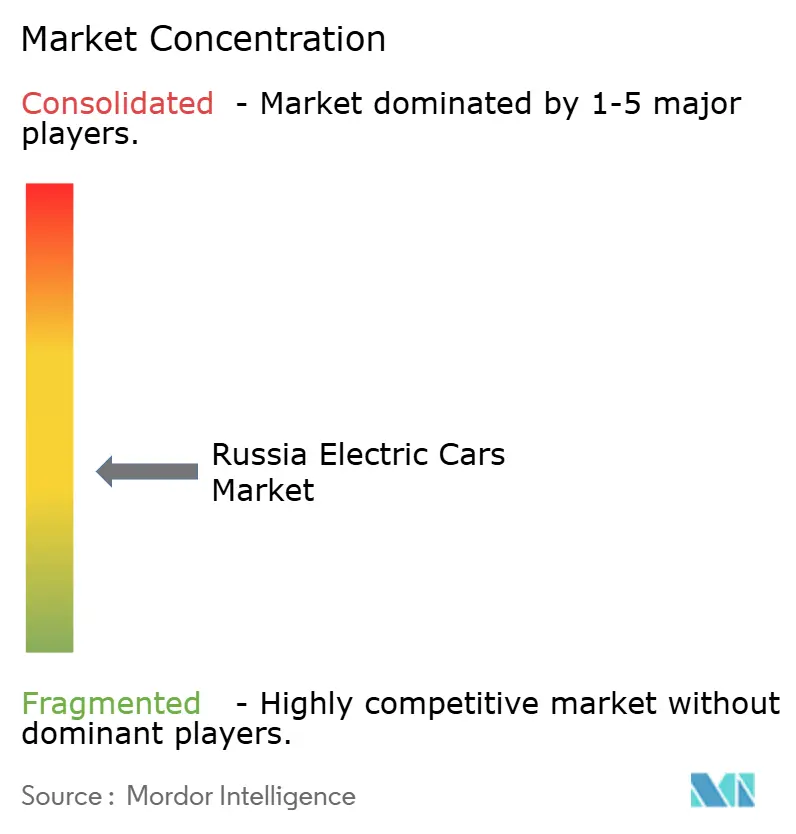
| Market Concentration | Medium |
Major Players *Disclaimer: Major Players sorted in no particular order Image © Mordor Intelligence. Reuse requires attribution under CC BY 4.0. | |
Russia Electric Cars Market Analysis by Mordor Intelligence
The Russian electric car market was valued at USD 0.65 billion in 2025 and estimated to grow from USD 0.84 billion in 2026 to reach USD 3.12 billion by 2031, at a CAGR of 29.86% during the forecast period (2026-2031). This sharp expansion follows Western sanctions that squeezed internal-combustion imports and created an opening for Chinese battery-electric and plug-in hybrid models, which now make up a notable share of unit sales. Federal subsidies that waive import duty through 2030, together with Rosatom’s 4 GWh battery gigafactory launched in December 2025, illustrate Moscow’s intention to localize high-value components and secure supply autonomy [1]“Rosatom Launches Kaliningrad Li-Ion Gigafactory,” Rosatom Press Office, rosatom.ru. Falling global lithium-ion pack prices in 2024 further support affordability and drive volume growth. Meanwhile, rising recycling fees on imported EVs and stricter credit conditions temper demand in price-sensitive regions, underscoring the importance of domestic assembly and lower-cost chemistry.
Key Report Takeaways
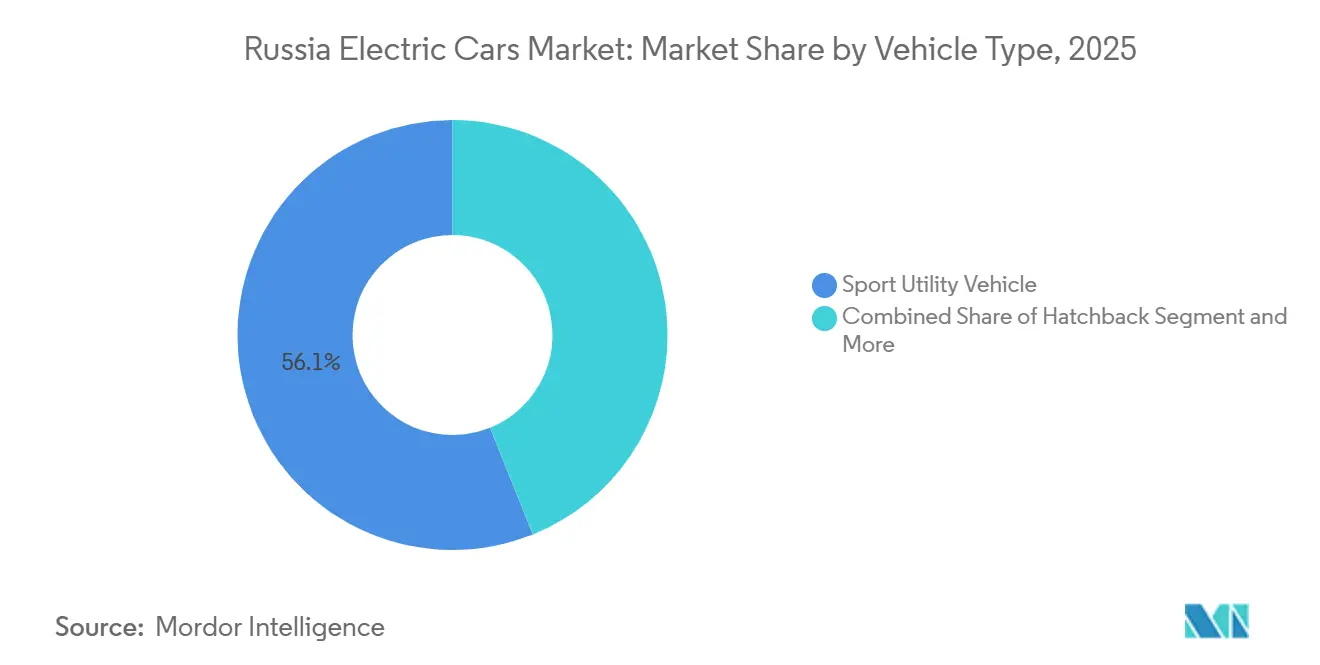
- By vehicle type, sport utility vehicles held 56.11% share in 2025, while multi-purpose vehicles are projected to rise with 31.65% CAGR through 2031.
- By fuel category, battery electric vehicles accounted for a 63.25% share of the Russian electric car market size in 2025 and are projected to advance at a 31.15% CAGR to 2031.
- By battery chemistry, nickel manganese cobalt held 60.03% of the Russian electric car market share in 2025; solid-state variants are poised to rise at a 38.24% CAGR through 2031.
- By drive type, front-wheel drive held 49.24% of the Russian electric car market share in 2025, while all-wheel drive is expected to post a 32.58% CAGR between 2026 and 2031.
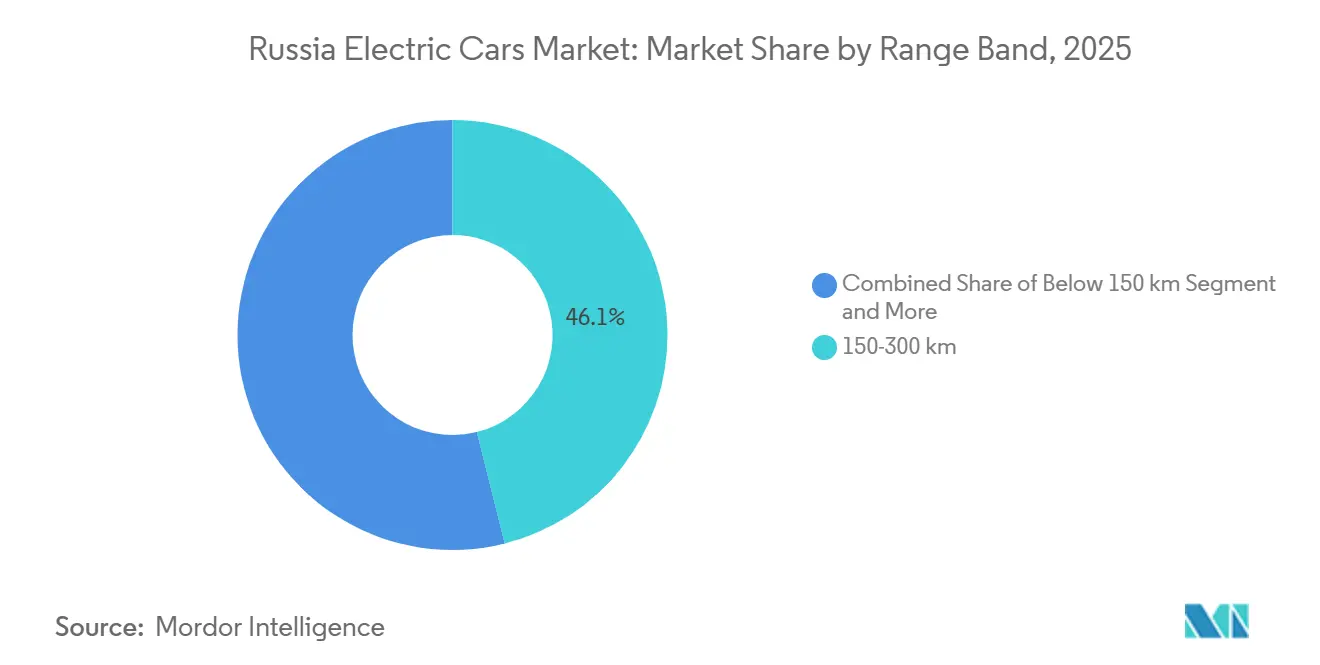
- By range band, electric cars of 150-300 km range held 46.12% market share in 2025, while 300-500 km band will expand at a 33.17% CAGR by 2031.
- By price band, the USD 20,000-50,000 segment held 53.44% share in 2025, while the economy cars priced ≤ USD 20,000 are projected to rise with a 32.87% CAGR to 2031.
- By geography, the Central federal district captured 49.12% of sales in 2025, whereas the Far Eastern district is forecast to expand at a 32.11% CAGR to 2031.
Note: Market size and forecast figures in this report are generated using Mordor Intelligence’s proprietary estimation framework, updated with the latest available data and insights as of 2026.
Russia Electric Cars Market Trends and Insights
Drivers Impact Analysis*
| Driver | (~) % Impact on CAGR Forecast | Geographic Relevance | Impact Timeline |
|---|---|---|---|
| Sanctions Triggered ICE Import Squeeze | +7.3% | Nationwide, the highest is in the Central and Far Eastern districts | Short term (≤ 2 years) |
| Global Lithium-ion Cost Decline | +6.1% | Global, passed through on Chinese imports | Short term (≤ 2 years) |
| Federal Subsidies and Import Duty | +5.2% | Nationwide, strongest in Central and Northwestern districts | Medium term (2–4 years) |
| Domestic Battery Cell Industrialization | +4.8% | Nationwide; first production in Kaliningrad | Long term (≥ 4 years) |
| OEM Localization Quotas | +4.2% | Nationwide, early gains in Central assembly hubs | Medium term (2–4 years) |
| Abundant Low Carbon Electricity | +3.5% | Strongest where nuclear and hydro dominate (Central, Northwestern, Siberian, Far Eastern) | Long term (≥ 4 years) |
| Source: Mordor Intelligence | |||


Sanctions-Triggered ICE Import Squeeze Redirecting Demand to EVs
After Europe and the United States withdrew in recent years, Chinese shipments experienced significant growth. This increase was primarily driven by Chinese OEMs redirecting their excess capacity, with electric vehicles (EVs) playing a key role. However, exports later faced a sharp decline due to rising recycling fees and stricter credit conditions. Despite these challenges, EVs eligible for subsidies managed to strengthen their market presence. Imports of used EVs also grew, avoiding duties but raising concerns about warranty coverage. Moscow is focusing on localization mandates to reduce reliance on external sources, but technological limitations in cell chemistry indicate that achieving complete self-sufficiency will take considerable time.
Global Li-ion Cost Decline Below USD 80/kWh Milestone
In 2024, battery pack prices experienced a significant decline, with Chinese LFP cells becoming notably more affordable. This reduction substantially lowered retail EV prices, making them more accessible to consumers. If prices continue to decrease, the lifetime costs of EVs could align with those of internal-combustion vehicles. Automakers like Geely, BYD, and Chery are already producing vehicles with cost-efficient battery packs, enabling them to compete directly with traditional gasoline sedans. The economy segment remains highly sensitive to price changes, with even small reductions in battery costs leading to noticeable decreases in retail prices. If lithium carbonate rebounds in 2026, lower local refining costs could cushion price swings and keep entry-level models competitive.
Federal Subsidies and Zero-Import Duty Extension to 2030
With zero import duties and purchase grants, the price gap between electric vehicles (EVs) and gasoline cars narrows, particularly for more affordable models [2]“Zero-Import Duty Extension for Electric Vehicles,” Government of Russia, government.ru. Seizing this opportunity, Chinese OEMs import semi-knock-down kits ahead of impending localization thresholds. Meanwhile, Motorinvest, leveraging a long-term Special Investment Contract, intensifies its focus on domestic content. An increase in recycling fees pushes assemblers towards local plants, ensuring they retain access to subsidies. Adhering to GOST R safety standards extends lead times but shields official channels from gray-market competition. As subsidies begin to wane in the coming years, reduced pack costs and a local cell supply must continue to uphold affordability.
Domestic Battery-Cell Industrialization Roadmap
Rosatom’s 4 GWh Kaliningrad line sources lithium hydroxide from Irkutsk and cathode precursors via Norilsk Nickel, carving a path to supply autonomy. Phase-one output can equip roughly 55,000 mid-size EVs per year, and LFP lines are scheduled for 2027. Export-control barriers lengthen equipment lead times by up to 12 months, yet localization reduces currency risk and aims for significant domestic pack pricing by 2027. Brands meeting a notable share of local-value rules gain priority in municipal fleet tenders, reinforcing demand for Russian cells.
Restraints Impact Analysis*
| Restraint | (~) % Impact on CAGR Forecast | Geographic Relevance | Impact Timeline |
|---|---|---|---|
| Sparse Public Charging Infrastructure | -4.7% | Volga, Southern, North Caucasus, Siberian districts | Medium term (2–4 years) |
| High Upfront EV Prices | -3.9% | Nationwide, sharpest in rural areas | Short term (≤ 2 years) |
| Critical Component Import Hurdles | -3.2% | Nationwide, impacts all OEMs reliant on Western or dual-use equipment | Long term (≥ 4 years) |
| Cold Climate Range Degradation | -2.8% | Siberian, Ural, Far Eastern, and Northwestern districts | Medium term (2–4 years) |
| Source: Mordor Intelligence | |||
Sparse Public Charging Outside Moscow–St Petersburg Corridor
Russia had only 6,500 public chargers by October 2025, with a major share located in Central and Northwestern districts. With each hosting a limited number of chargers, the Volga and Southern regions face significant network gaps. These gaps, particularly along key corridors, deter a substantial portion of potential buyers. To achieve the ambitious long-term targets, installations must grow significantly each year. However, securing grid-connection approval can be a lengthy process. Fast chargers, which require a high power rating, depend on a three-phase supply. This supply is often hard to come by in many rural areas, leading to additional transformer upgrade costs. While subsidies assist with hardware costs, they fall short on grid reinforcement. This shortfall dampens investment from private operators and inadvertently strengthens the barriers to adoption.
High Upfront Purchase Price vs. Petrol Equivalents
In 2024, median sticker prices for electric vehicles (EVs) were significantly higher than their gasoline counterparts. Purchase subsidies are available only to buyers who scrap an older vehicle, leaving out first-time buyers and households with two cars. Following a 2024 rate hike by the Central Bank, pushing its key rate to 21%, auto-loan APRs surged further, leading to payback periods extending beyond five years[3]“Key Rate Decision December 2024,” Central Bank of Russia, cbr.ru. Public fast-charging costs reduce the operating-cost advantage for users without access to home charging. Uncertainties cloud resale values in the used market, where the absence of standardized battery-health diagnostics amplifies perceived risks for budget-conscious buyers.
*Our forecasts treat driver/restraint impacts as directional, not additive. The impact forecasts reflect baseline growth, mix effects, and variable interactions.
Segment Analysis
By Vehicle Type: SUV Dominance Meets MPV Surge
Sport Utility Vehicles (SUVs) commanded 56.11% of Russia's electric car market share in 2025, yet multi-purpose vehicles (MPVs) are projected to grow 31.65% annually through 2031, the fastest among body styles. The popularity of MPVs reflects demand for flexible cargo layouts and third-row seating as charging infrastructure extends to secondary cities. Motorinvest’s i-VAN, introduced with a LFP pack and 400-km range, targets ride-hailing and last-mile delivery operators that value volume over off-road capability. Sedans and hatchbacks together hold the remaining share, with sedans offering aerodynamics that prolong highway range and hatchbacks serving subsidy-eligible entry buyers.
SUV momentum has moderated as falling battery costs make MPVs and hatchbacks more affordable. Geely’s Zeekr X and BYD’s Song Plus AWD variants deliver sub-5-second acceleration that resonates with younger urbanites, yet such performance adds little utility in daily commuter traffic. AvtoVAZ’s limited e-Largus output illustrates how supply-chain constraints can cap domestic OEM share despite localization incentives.


By Fuel Category: BEV Leadership Across Metrics
Battery electric vehicles (BEVs) captured 63.25% of the Russian electric car market size in 2025 and are set to expand at a 31.15% CAGR through 2031. Subsidy rules that favor zero-emission drivetrains, combined with lower charging costs, underpin BEV momentum. Plug-in hybrids appeal in sparsely charged regions because onboard combustion engines offer range insurance, yet they face a significant price penalty after incentives. Motorinvest’s i-Jet premium series hybrid illustrates this gap and is being sold in limited numbers. Conventional hybrids lose ground as gray-market Toyota inflows dry up and Chinese OEMs prioritize BEVs to leverage their battery-supply dominance.
Total-cost-of-ownership math strengthens BEV economics: charging a 60 kWh pack at residential rates costs more compared to gasoline for the same 400-km distance. Congestion-charge exemptions planned for Moscow and St Petersburg from 2026 will exclude hybrids, adding a regulatory tailwind to BEVs. BYD’s Seagull is poised to broaden addressable demand in the economy band, moving the center of gravity further toward pure-electric models.
By Battery Chemistry: NMC Incumbency vs LFP Cost Advantage
Nickel manganese cobalt (NMC) accounted for 60.03% of installations in 2025, driven by energy density requirements in long-range SUVs. Solid-state chemistry, however, is forecast to outpace the market at a 38.24% CAGR through 2031 as pack-level cost savings become decisive in the economy and mid-price bands. Motorinvest’s i-Joy and i-VAN use LFP packs sourced from CATL, trading marginally lower energy density for longer cycle life. Rosatom’s initial NMC focus exploits domestic nickel and cobalt supply, yet plans to add LFP lines by 2027, acknowledging shifting demand.
Solid-state batteries promise >400 Wh/kg densities and sub-10-minute fast charging, but will not see meaningful Russian volume until at least 2028. Cold-climate performance also shapes chemistry choices: LFP loses additional range below –10 °C, forcing Siberian fleets to favor NMC despite higher cost. Geely’s dual-chemistry strategy lets buyers balance budget and winter resilience, underscoring the segment’s nuanced requirements.
By Drive Type: FWD Affordability Competes With AWD Traction
Front-wheel drive (FWD) held a 49.24% share in 2025, prized for simplicity and lower cost. All-wheel drive (AWD), however, is forecast to climb at a 32.58% CAGR through 2031, reflecting demand for winter traction across Siberia, the Urals, and the Far East. While the dual-motor AWD option involves a higher cost and results in some battery efficiency reduction, its benefits, such as torque vectoring and enhanced stability, appeal to safety-focused consumers. Meanwhile, the rear-wheel drive continues to cater to a select premium audience.
Motorinvest’s FWD i-Pro achieves competitive range and pricing by avoiding the weight penalty of a second motor, while BYD’s Tang AWD touts 400-hp performance to lure ex-German luxury owners. For municipal fleets, KAMAZ opts for rear-drive layouts in buses to ease maintenance, demonstrating that application dictates drivetrain priority more than consumer fashion.
By Range Band: Mid-Range Practicality vs Long-Range Aspiration
Vehicles rated 300–500 km are forecast to grow 33.17% annually to 2031, surpassing the 150–300 km cohort that owned a 46.12% share in 2025. The sub-150 km micro-EV niche remains small, while premium models above 500 km linger outside subsidy eligibility. Cold-weather derating compresses real-world range; hence, a nominal 400-km rating becomes 200–300 km in Siberian winters. Thermal pre-conditioning and heat-pump HVAC can claw back 10–15% of the loss, but infrastructure gaps still make 300–500 km the pragmatic sweet spot for most buyers.
Motorinvest’s 511-km i-Sky straddles two bands, targeting single-stop Moscow-to-Nizhny Novgorod trips. As solid-state batteries mature post-2027, above 500 km models could break into the mass market, yet today’s demand centers squarely on mid-range practicality.
By Price Band: Economy Segment Democratization
The economy band (≤ USD 20,000) is expected to rise 32.87% annually through 2031, narrowing the affordability gap with petrol cars. Subsidies reduce Motorinvest’s i-Pro net price in the upper-economy territory, while BYD’s Seagull could fall after incentives upon Uzbekistan JV launch in late 2025. The mid-price band (USD 20,000–50,000) still holds 53.44% share, reflecting the bulk of Chinese crossovers.
Rosatom aims to significantly reduce local cell costs in the coming years, enabling more affordable sticker prices without subsidies, thereby strengthening the position of the economy segment. Premium cars above USD 50,000 remain a niche dominated by gray-market Teslas and high-trim Chinese flagships, hindered by warranty voids and payment-settlement barriers.
Geography Analysis
The Central federal district secured 49.12% of Russia's electric car market share in 2025, buoyed by Moscow’s significant number of public chargers, congestion-charge exemptions, and higher household incomes. Northwestern gains manufacturing tailwinds from Rosatom’s Kaliningrad gigafactory, which trims logistics for local assemblers and may spark a supplier cluster. The Volga district lags in infrastructure yet hosts AvtoVAZ and KAMAZ plants positioned to scale localization once domestic cell supply stabilizes. Ural adoption is restrained by cold-weather range loss, tempering demand despite industrial fleet potential.
Vladivostok's rail-port gateway, which significantly reduces import lead times by up to two weeks, has driven the Far East to achieve an impressive 32.11% CAGR. This development has resulted in a substantial influx of used EVs into the region, further solidifying its growth momentum. However, in Siberia, the adoption of EVs remains constrained due to the limited availability of charging infrastructure, forcing residents to rely heavily on home or depot charging solutions.
In the Southern and North Caucasus districts, the combination of milder winters and increasing tourism-driven fleet demand has contributed to low but steadily accelerating EV volumes. Federal plans to install 72,000 chargers by 2030 have the potential to reshape regional market shares, provided that permitting delays are addressed and necessary grid upgrades are implemented in more remote districts to support the growing demand for EV infrastructure.
Competitive Landscape
In the fragmented Russian electric car market, Chinese brands dominate with a significant share of unit sales, but no individual brand holds a commanding position. AvtoVAZ, hindered by production challenges that affected the rollout of its e-Largus, experienced a notable decline in its market presence. Meanwhile, Motorinvest’s Evolute family, supported by substantial government backing, has emerged as a key player in the market.
Key strategies focus on localization and advancements in heat-management technology. Geely and Chery are planning assembly plants in Kaluga and Tatarstan, aiming to strengthen their production capabilities and leverage partnerships with local firms. While Rosatom’s cell plant enhances supply security for domestic OEMs, reliance on imported components remains a challenge.
Technology differentiation is led by heat-pump HVAC: KAMAZ’s 15-kW system trims winter range loss significantly, a feature premium passenger cars are likely to adopt as component costs fall. Enforcement of GOST R safety standards creates an artificial moat for licensed importers, yet parallel channels continue to siphon price-sensitive Far Eastern demand.
Russia Electric Cars Industry Leaders
Great Wall Motor Company Limited
Chery Automobile Co. Ltd.
AvtoVAZ (JSC)
Tesla Inc.
BYD Company Limited
- *Disclaimer: Major Players sorted in no particular order

Recent Industry Developments
- April 2025: Kaliningrad’s Avtotor launched the Eonyx compact EV line under a special investment contract, targeting 50,000-unit annual capacity.
- July 2024: Motorinvest debuted the i-SPACE series hybrid with 178 hp, expanding Evolute to six models while keeping price points below RUB 4 million (~USD 0.04 million).
- May 2024: JSC Moskvich completed transition to full-cycle production, assembling the Moskvich 3e electric crossover and Moskvich 6 sedan at its Moscow plant.


Russia Electric Cars Market Report Scope
The scope includes segmentation by vehicle type (hatchback, sedan, multi-purpose vehicle, and sport utility vehicle), fuel category (battery electric vehicles, plug-in hybrid electric vehicles, and hybrid electric vehicles), battery chemistry (nickel manganese cobalt, lithium iron phosphate, and solid-state (pre-commercial)), drive type (front-wheel drive, rear-wheel drive, and all-wheel drive), range band (below 150 km, 150-300 km, 300-500 km, and above 500 km), and price band (≤ USD 20,000, USD 20,000-50,000, and above USD 50,000. The analysis also covers regional-level segmentation, including Central, Northwestern, Volga, Ural, Siberian, Far Eastern, Southern, and North Caucasus. Market size and growth forecasts are presented by value in USD and by volume in units.
By Vehicle Type
| Hatchback |
| Sedan |
| Multi-Purpose Vehicle |
| Sport Utility Vehicle |
By Fuel Category
| Battery Electric Vehicles (BEV) |
| Plug-in Hybrid Electric Vehicles (PHEV) |
| Hybrid Electric Vehicles (HEV) |
By Battery Chemistry
| Nickel Manganese Cobalt (NMC) |
| Lithium Iron Phosphate (LFP) |
| Solid-State (pre-commercial) |
By Drive Type
| Front-Wheel Drive |
| Rear-Wheel Drive |
| All-Wheel Drive |
By Range Band
| Below 150 km |
| 150-300 km |
| 300-500 km |
| Above 500 km |
By Price Band
| ≤ USD 20,000 (Economy) |
| USD 20,000-50,000 (Mid) |
| Above USD 50,000 (Premium) |
By Geography
| Central |
| Northwestern |
| Volga |
| Ural |
| Siberian |
| Far Eastern |
| Southern |
| North Caucasus |
| By Vehicle Type | Hatchback |
| Sedan | |
| Multi-Purpose Vehicle | |
| Sport Utility Vehicle | |
| By Fuel Category | Battery Electric Vehicles (BEV) |
| Plug-in Hybrid Electric Vehicles (PHEV) | |
| Hybrid Electric Vehicles (HEV) | |
| By Battery Chemistry | Nickel Manganese Cobalt (NMC) |
| Lithium Iron Phosphate (LFP) | |
| Solid-State (pre-commercial) | |
| By Drive Type | Front-Wheel Drive |
| Rear-Wheel Drive | |
| All-Wheel Drive | |
| By Range Band | Below 150 km |
| 150-300 km | |
| 300-500 km | |
| Above 500 km | |
| By Price Band | ≤ USD 20,000 (Economy) |
| USD 20,000-50,000 (Mid) | |
| Above USD 50,000 (Premium) | |
| By Geography | Central |
| Northwestern | |
| Volga | |
| Ural | |
| Siberian | |
| Far Eastern | |
| Southern | |
| North Caucasus |


Market Definition
- Vehicle Type - The category includes passenger cars.
- Vehicle Body Type - This include various body types such as Hatchbacks, Sedans, Sports Utility Vehicles, and Multi-purpose Vehicles.
- Fuel Category - The category exclusively covers electric propulsion systems, including various types such as HEV (Hybrid Electric Vehicles), PHEV (Plug-in Hybrid Electric Vehicles), BEV (Battery Electric Vehicles), and FCEV (Fuel Cell Electric Vehicles).
| Keyword | Definition |
|---|---|
| Electric Vehicle (EV) | A vehicle which uses one or more electric motors for propulsion. Includes cars, buses, and trucks. This term includes all-electric vehicles or battery electric vehicles and plug-in hybrid electric vehicles. |
| BEV | A BEV relies completely on a battery and a motor for propulsion. The battery in the vehicle must be charged by plugging it into an outlet or public charging station. BEVs do not have an ICE and hence are pollution-free. They have a low cost of operation and reduced engine noise as compared to conventional fuel engines. However, they have a shorter range and higher prices than their equivalent gasoline models. |
| PEV | A plug-in electric vehicle is an electric vehicle that can be externally charged and generally includes all-electric vehicles as well as plug-in hybrids. |
| Plug-in Hybrid EV | A vehicle that can be powered either by an ICE or an electric motor. In contrast to normal hybrid EVs, they can be charged externally. |
| Internal combustion engine | An engine in which the burning of fuels occurs in a confined space called a combustion chamber. Usually run with gasoline/petrol or diesel. |
| Hybrid EV | A vehicle powered by an ICE in combination with one or more electric motors that use energy stored in batteries. These are continually recharged with power from the ICE and regenerative braking. |
| Commercial Vehicles | Commercial vehicles are motorized road vehicles designed for transporting people or goods. The category includes light commercial vehicles (LCVs) and medium and heavy-duty vehicles (M&HCV). |
| Passenger Vehicles | Passenger cars are electric motor– or engine-driven vehicles with at least four wheels. These vehicles are used for the transport of passengers and comprise no more than eight seats in addition to the driver’s seat. |
| Light Commercial Vehicles | Commercial vehicles that weigh less than 6,000 lb (Class 1) and in the range of 6,001–10,000 lb (Class 2) are covered under this category. |
| M&HDT | Commercial vehicles that weigh in the range of 10,001–14,000 lb (Class 3), 14,001–16,000 lb (Class 4), 16,001–19,500 lb (Class 5), 19,501–26,000 lb (Class 6), 26,001–33,000 lb (Class 7) and above 33,001 lb (Class 8) are covered under this category. |
| Bus | A mode of transportation that typically refers to a large vehicle designed to carry passengers over long distances. This includes transit bus, school bus, shuttle bus, and trolleybuses. |
| Diesel | It includes vehicles that use diesel as their primary fuel. A diesel engine vehicle have a compression-ignited injection system rather than the spark-ignited system used by most gasoline vehicles. In such vehicles, fuel is injected into the combustion chamber and ignited by the high temperature achieved when gas is greatly compressed. |
| Gasoline | It includes vehicles that use gas/petrol as their primary fuel. A gasoline car typically uses a spark-ignited internal combustion engine. In such vehicles, fuel is injected into either the intake manifold or the combustion chamber, where it is combined with air, and the air/fuel mixture is ignited by the spark from a spark plug. |
| LPG | It includes vehicles that use LPG as their primary fuel. Both dedicated and bi-fuel LPG vehicles are considered under the scope of the study. |
| CNG | It includes vehicles that use CNG as their primary fuel. These are vehicles that operate like gasoline-powered vehicles with spark-ignited internal combustion engines. |
| HEV | All the electric vehicles that use batteries and an internal combustion engine (ICE) as their primary source for propulsion are considered under this category. HEVs generally use a diesel-electric powertrain and are also known as hybrid diesel-electric vehicles. An HEV converts the vehicle momentum (kinetic energy) into electricity that recharges the battery when the vehicle slows down or stops. The battery of HEV cannot be charged using plug-in devices. |
| PHEV | PHEVs are powered by a battery as well as an ICE. The battery can be charged through either regenerative breaking using the ICE or by plugging into some external charging source. PHEVs have a better range than BEVs but are comparatively less eco-friendly. |
| Hatchback | These are compact-sized cars with a hatch-type door provided at the rear end. |
| Sedan | These are usually two- or four-door passenger cars, with a separate area provided at the rear end for luggage. |
| SUV | Popularly known as SUVs, these cars come with four-wheel drive, and usually have high ground clearance. These cars can also be used as off-road vehicles. |
| MPV | These are multi-purpose vehicles (also called minivans) designed to carry a larger number of passengers. They carry between five and seven people and have room for luggage too. They are usually taller than the average family saloon car, to provide greater headroom and ease of access, and they are usually front-wheel drive. |


Research Methodology
Mordor Intelligence follows a four-step methodology in all its reports.
- Step-1: Identify Key Variables: To build a robust forecasting methodology, the variables and factors identified in Step-1 are tested against available historical market numbers. Through an iterative process, the variables required for market forecast are set and the model is built based on these variables.
- Step-2: Build a Market Model: Market-size estimations for the historical and forecast years have been provided in revenue and volume terms. Market revenue is calculated by multiplying the sales volume with their respective average selling price (ASP). While estimating ASP factors like average inflation, market demand shift, manufacturing cost, technological advancement, and varying consumer preference, among others have been taken into account.
- Step-3: Validate and Finalize: In this important step, all market numbers, variables, and analyst calls are validated through an extensive network of primary research experts from the market studied. The respondents are selected across levels and functions to generate a holistic picture of the market studied.
- Step-4: Research Outputs: Syndicated Reports, Custom Consulting Assignments, Databases & Subscription Platforms.


