Debt Collection Software Market Size and Share
Market Overview
| Study Period | 2020 - 2031 |
|---|---|
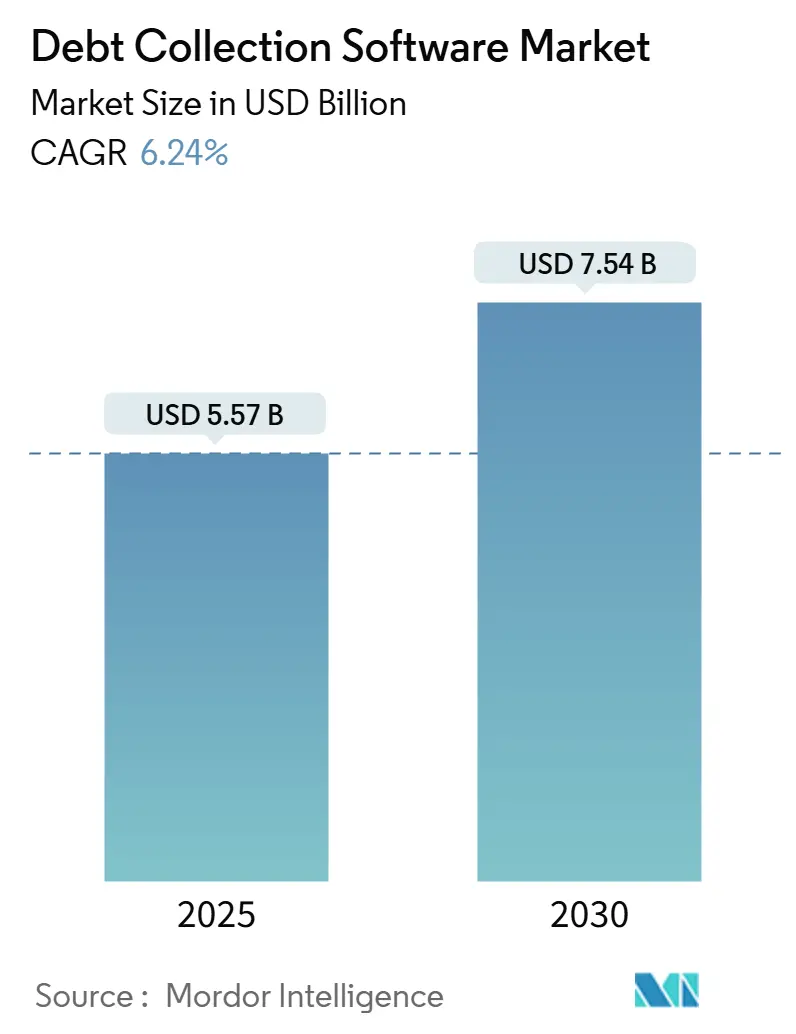
| Market Size (2026) | USD 5.57 Billion |
| Market Size (2031) | USD 7.54 Billion |
| Growth Rate (2026 - 2031) | 6.24% CAGR |
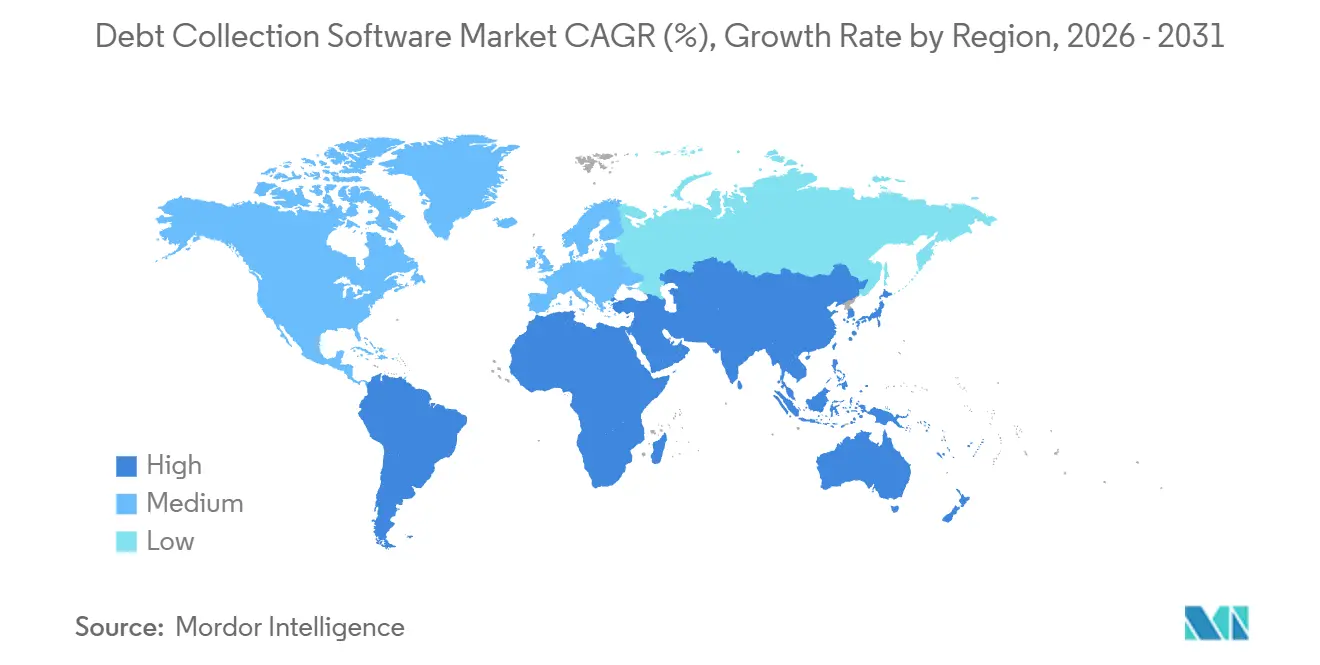
| Fastest Growing Market | Africa |
| Largest Market | North America |
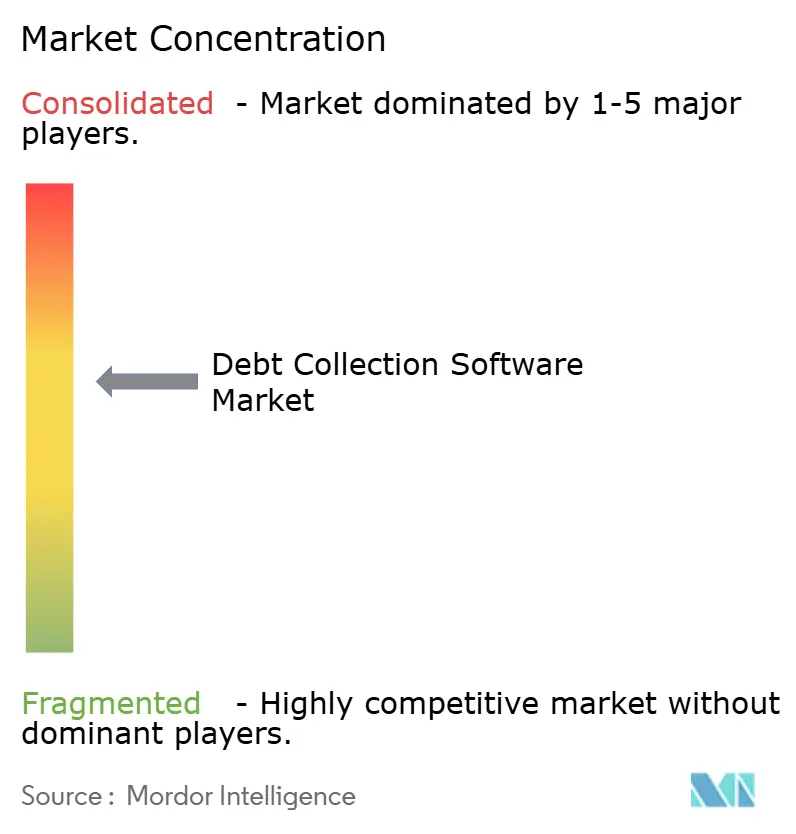
| Market Concentration | Medium |
Major Players *Disclaimer: Major Players sorted in no particular order Image © Mordor Intelligence. Reuse requires attribution under CC BY 4.0. | |
Debt Collection Software Market Analysis by Mordor Intelligence
The debt collection software market is valued at USD 5.57 billion in 2026 and is forecast to reach USD 7.54 billion in 2031, expanding at a 6.24% CAGR. This growth trajectory reflects surging buy-now-pay-later balances, rising digital-payment delinquencies among gig-economy workers, and the steady rollout of collections application programming interfaces across core-banking modernization programs. Creditors routed more than USD 1 trillion in receivables through modern cloud platforms in 2025, while the United States household debt service ratio climbed to a multi-year high, keeping default pressures elevated across consumer credit, healthcare bills, and utility accounts. Vendors that embed artificial intelligence-driven segmentation, real-time insolvency checks, and omnichannel orchestration are widening the performance gap versus legacy on-premises suites. At the same time, stricter contact-frequency rules under Regulation F and the European Union’s transparency mandate for automated scoring are lifting compliance requirements, raising the barrier to entry for smaller providers.
Key Report Takeaways
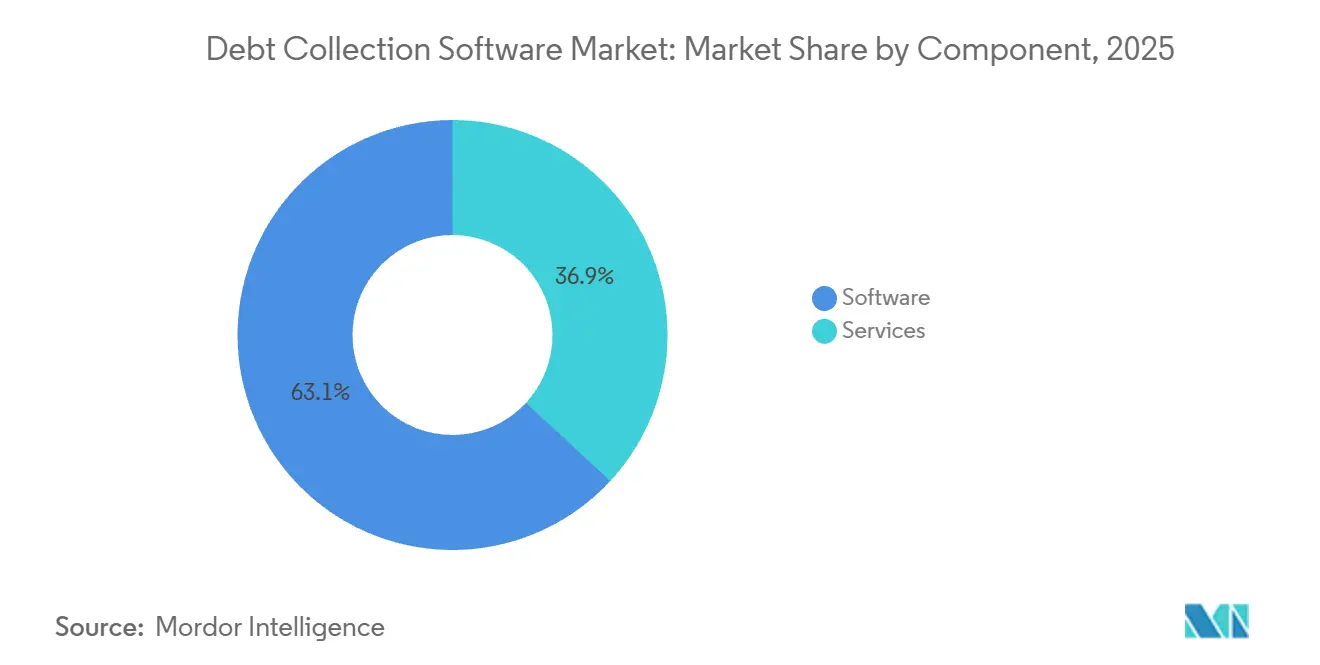
- By component, software held 63.12% of debt collection software market share in 2025, while services are projected to post an 8.18% CAGR through 2031.
- By deployment mode, cloud platforms commanded 71.46% of the debt collection software market size in 2025, and are on track for a 7.23% CAGR to 2031.
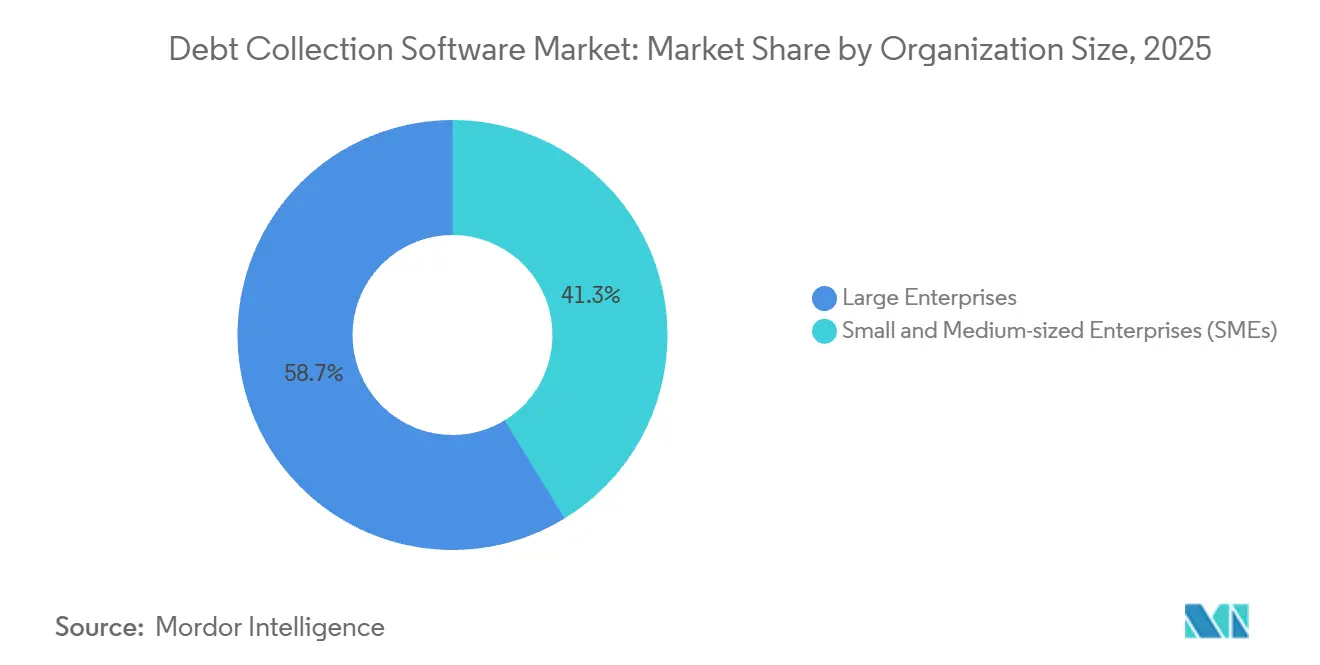
- By organization size, large enterprises led with 58.73% of debt collection software market share in 2025, whereas small and medium-sized enterprises are expected to advance at an 8.27% CAGR through 2031.
- By end-user industry, financial institutions accounted for 37.92% of the debt collection software market size in 2025, while the retail and e-commerce segment is projected to expand at an 8.29% CAGR through 2031.
- By geography, North America captured 34.51% of debt collection software market share in 2025, and Africa is forecast to register a 7.32% CAGR during the outlook period.
Note: Market size and forecast figures in this report are generated using Mordor Intelligence’s proprietary estimation framework, updated with the latest available data and insights as of January 2026.
Global Debt Collection Software Market Trends and Insights
Drivers Impact Analysis*
| Driver | (~) % Impact on CAGR Forecast | Geographic Relevance | Impact Timeline |
|---|---|---|---|
| Rising adoption of AI-powered predictive analytics among collection agencies | +1.2% | Global, led by North America and Europe | Medium term (2-4 years) |
| Growth in buy-now-pay-later portfolios driving account volume | +1.5% | North America, Europe, and urban Asia-Pacific | Short term (≤ 2 years) |
| Increasing digital payment delinquencies from gig-economy workers | +0.9% | North America, Western Europe, urban Asia-Pacific | Short term (≤ 2 years) |
| Integration of collection APIs into core-banking modernization programs | +1.1% | North America, Middle East, Asia-Pacific | Medium term (2-4 years) |
| Open banking-powered real-time insolvency checks reducing skip-tracing costs | +0.7% | Europe, with emerging adoption in Middle East and Latin America | Long term (≥ 4 years) |
| Decentralized identity wallets enabling consent-based outreach | +0.4% | Pilot stage in Europe and North America | Long term (≥ 4 years) |
| Source: Mordor Intelligence | |||


Rising Adoption of AI-Powered Predictive Analytics Among Collection Agencies
Creditors are replacing static segmentation with self-learning models that score portfolios based on propensity to pay, enabling the automated routing of high-yield accounts and lowering recovery costs per dollar collected. A major platform recorded 90% process automation and 79% payment rates in 2025, underscoring efficiency gains over manual workflows. Machine-learning engines ingest behavioral signals, payment histories, and real-time insolvency feeds to forecast roll rates and recommend optimal contact channels. Utilities that use predictive bankruptcy models reduce bad-debt expenses after identifying risk weeks earlier than rule-based systems. Dashboards visualize collection velocity, cash recovery, and agent productivity, allowing supervisors to adjust strategies daily. The competitive gap is widening, as vendors without embedded artificial intelligence struggle to meet the performance benchmarks of enterprises.
Growth in Buy-Now-Pay-Later Portfolios Driving Account Volume
Point-of-sale installment plans originated over USD 100 billion in 2024, but fragmented reporting led to duplicate borrowing and rising defaults. Merchants and fintech lenders now integrate buy-now-pay-later data feeds with their collection platforms to aggregate balances, detect over-extension, and negotiate early payment plans via mobile chatbots. Younger borrowers, who juggle multiple short-term obligations, trigger automated nudges at the first missed installment instead of the traditional 90-day cycle. In markets where buy-now-pay-later penetration among millennials tops 40%, specialized workflows align repayment schedules with wage frequency, reducing churn and preserving customer lifetime value. These capabilities enable the debt collection software market to capture sustained demand from retailers and e-commerce platforms seeking to reduce higher charge-off rates.
Increasing Digital Payment Delinquencies From Gig-Economy Workers
Irregular earnings among ride-sharing drivers, delivery couriers, and freelance professionals create volatile repayment patterns that outpace legacy credit-risk models. The New York Federal Reserve highlighted the rising delinquency rates among gig workers in 2025, prompting lenders to adopt real-time income-verification feeds.[1] Federal Reserve Bank of New York, “Household Debt and Credit Report Q3 2025,” NEWYORKFED.ORG Collection software now ingests open-banking transaction data to build dynamic affordability profiles and proposes flexible installment dates aligned with platform payout cycles. Artificial intelligence agents analyze spending sentiment and proactively suggest payment renegotiations, lowering involuntary defaults. Urban markets with dense gig workforces exhibit above-average adoption of these features, reinforcing regional contributions to the growth of the debt collection software market.
Integration of Collection APIs Into Core-Banking Modernization Programs
Financial institutions transitioning from monolithic cores to microservices architectures expose collections through secure application programming interfaces, enabling low-code composition of workflows across credit bureaus, customer relationship systems, and payment gateways. A Middle Eastern regulator issued guidelines in 2025, urging banks to onboard application programming interface (API)-compatible collections solutions to bolster resilience. One vendor’s microservices stack offers more than 1,700 application programming interfaces and slashes deployment from quarters to weeks. Adoption is strongest across the Gulf Cooperation Council, where regulatory mandates dovetail with fintech competition. This interoperability accelerates innovation and cements the debt collection software market as a central enabler of banking digital transformation.
Restraints Impact Analysis*
| Restraint | (~) % Impact on CAGR Forecast | Geographic Relevance | Impact Timeline |
|---|---|---|---|
| Data-privacy regulations limiting third-party data enrichment in the EU | -0.8% | Europe, with spillover to GDPR-style markets | Medium term (2-4 years) |
| High switching costs from legacy mainframe collection suites | -1.1% | North America, Europe, large Asia-Pacific institutions | Long term (≥ 4 years) |
| Rising consumer litigation driving stricter contact-frequency caps | -0.6% | North America, emerging Latin America | Short term (≤ 2 years) |
| Limited cloud connectivity in Sub-Saharan Africa constraining SaaS adoption | -0.5% | Sub-Saharan Africa except major metros | Long term (≥ 4 years) |
| Source: Mordor Intelligence | |||
Data-Privacy Regulations Limiting Third-Party Data Enrichment in the EU
A 2024 ruling by the Court of Justice of the European Union requires transparent explanations of automated scoring logic, restricting external behavioral data use without explicit consent. Platforms servicing European creditors must embed consent orchestration, audit trails, and explainable artificial intelligence modules, inflating development costs. Stricter data-processing contracts and heavier documentation extend sales cycles and slow feature rollouts. Those regulatory frictions temper the regional expansion pace of the debt collection software market.
High Switching Costs From Legacy Mainframe Collection Suites
Large banks running 1990s mainframe code face multi-year, multi-million-dollar migrations to cloud-native platforms, often operating dual systems during cutover to preserve uptime.[2]Utah State Government, “COBOL-to-Cloud Migration Case Study,” UTAH.GOV Decades-old custom rules and batch integrations complicate data extraction, while staff retraining demands additional investment. Although modern vendors provide out-of-the-box application programming interfaces, reported transitions still average 12 to 24 months. The inertia hampers the adoption of artificial intelligence features that rely on real-time data pipelines, thereby restraining the overall velocity of the debt collection software market among entrenched institutions.
*Our forecasts treat driver/restraint impacts as directional, not additive. The impact forecasts reflect baseline growth, mix effects, and variable interactions.
Segment Analysis
By Component: Services Scale Faster Than Licenses
Software retained a 63.12% share of the debt collection software market in 2025, as configurable rule engines and omnichannel orchestration remained essential for managing large portfolios. However, services are projected to outpace software with an 8.18% CAGR because creditors increasingly outsource model tuning, regulatory updates, and integration to specialists. A leading provider processed more than USD 1 trillion in receivables across 370 implementations and now sells managed services that retrain models and calibrate compliance rules quarterly.
Ongoing data-privacy changes, contact-frequency caps, and the proliferation of new repayment channels elevate the complexity of maintaining in-house expertise. Implementation partners deliver skip-tracing data hygiene, empathetic agent coaching, and vulnerability screening, ensuring rapid time-to-value. This evolution from perpetual licenses to subscription-plus-services bundles aligns vendor incentives with recovery outcomes and lowers capital outlay for smaller creditors, supporting broader market penetration of debt collection software.

By Deployment Mode: Cloud Platforms Ingest Real-Time Payment Streams
Cloud deployments held a 71.46% market share in 2025, reflecting the migration of utilities and telecom operators from on-premises mainframes to elastic software-as-a-service models that ingest smart meter telemetry, payment updates, and customer interaction logs without batch delays. One enterprise resource planning vendor links its receivables cloud with multi-bank connectors, enabling one-click settlements that reduce Days Sales Outstanding (DSO).
Seasonal spikes after holidays or extreme weather no longer require idle capacity provisioning, as cloud tenants scale computing on demand. Hybrid footprints persist among institutions bound by data-residency mandates, yet even they run analytic workloads in public clouds while retaining core ledgers on-premises. Infrastructure disparities moderate adoption, broadband coverage above 90% in North America supports near-ubiquitous cloud use, whereas intermittent connectivity limits software-as-a-service above 50% across Sub-Saharan Africa. Vendors respond with edge modules that cache workflows locally and synchronize during connectivity windows, extending the debt collection software market to bandwidth-constrained territories.
By Organization Size: Low-Code Platforms Unlock SME Demand
Large enterprises commanded 58.73% of the debt collection software market share in 2025 because multi-product portfolios, cross-border operations, and stringent audits necessitate enterprise-grade compliance. Small and medium-sized enterprises are forecast to expand at an 8.27% CAGR thanks to low-code configuration, transparent subscription pricing, and pre-integrations with popular accounting tools. A composable platform that ships over 80 prebuilt application programming interfaces enables regional lenders to tailor screens and approvals without specialized developers, thereby compressing launch times.
Digital factoring and accounts receivable automation experienced a 15% increase in 2025 as small businesses sought to reduce manual follow-ups. Modular design enables owners to start with payment reminders and add predictive scoring as volumes increase, thereby broadening the addressable market for debt collection software.
By End-User Industry: Retail Tackles Installment-Plan Defaults
Financial institutions generated 37.92% of demand in 2025, leveraging bureau integrations, fraud analytics, and regulator reporting within the debt collection software market. The retail and e-commerce segment leads growth at an 8.29% CAGR, as buy-now-pay-later defaults rise alongside increased digital wallet usage. Platforms aggregate loan feeds, detect cross-provider exposure, and negotiate payment plans through chat, preserving merchant-customer relationships.
Healthcare providers adopt empathetic outreach to comply with United States rules that bar medical debt from credit reports for 12 months, while utilities tap smart-meter data to trigger early arrears notifications. Telecom operators automate reminders via short message service to distinguish between forgetfulness and fraud. Government entities are digitizing tax arrears recovery through portals, such as the UAE’s Tanfeeth+ platform, mirroring the efficiencies of the private sector.[3]Dubai Courts, “Tanfeeth+ Digital Enforcement Platform,” DUBAICOURTS.GOV.AE Vertical-specific functionality supports heterogeneous demand and sustains expansion of the debt collection software market.
Geography Analysis
North America captured 34.51% of the debt collection software market share in 2025, driven by USD 17.9 trillion in household debt and strict enforcement of the Fair Debt Collection Practices Act, which compels end-to-end compliance orchestration. Regulation F caps outreach to seven attempts per week and mandates validation notices within five business days, prompting the use of embedded compliance engines. Platform launches, such as FIS Revenue Insight, blend predictive analytics with omnichannel outreach to meet these requirements. Canada and Mexico share similar statutes, driving demand for multi-jurisdictional modules.
Europe benefits from open-banking mandates that enable real-time checks for insolvency and payment initiation. Transparency rulings on automated scoring drive investments in explainable artificial intelligence, an area where vendors gain differentiation despite higher build costs. Energy arrears in the United Kingdom more than doubled between 2018 and 2023, pushing utilities toward vulnerability-aware segmentation.[4]Office of Gas and Electricity Markets, “Energy Debt Statistics,” OFGEM.GOV.UK
The Asia-Pacific region exhibits rapid digital payment uptake, led by India’s Unified Payments Interface, which has exceeded 10 billion monthly transactions. However, fragmented regulations across China, India, Japan, and Southeast Asia necessitate localized compliance layers. Africa is projected for a 7.32% CAGR as mobile-money ecosystems scale in Kenya and Nigeria, though rural cloud connectivity gaps limit software-as-a-service penetration. Vendors offset latency through edge caching, enabling microfinance institutions to participate in the debt collection software market. Middle Eastern growth accelerates under United Arab Emirates and Saudi Arabia mandates that formalize licensing and consumer-protection standards. Latin America faces 30–45-day payment delays on average, encouraging adoption of automated reminders and payment-plan negotiation tools.

Competitive Landscape
The debt collection software market exhibits moderate fragmentation, with enterprise resource planning giants, fintech natives, and regional specialists competing on the depth of artificial intelligence, compliance readiness, and deployment flexibility. Incumbents such as FIS, FICO, and Pegasystems cross-sell collections modules into existing banking relationships, while challengers like Intellect Design Arena and Nucleus Software compete on composability and rapid launch. Consolidation is active; Intrum’s acquisition of Ophelos layers machine-learning technology atop Europe’s largest debt database, and TrueAccord’s purchase of Sentry Credit extends digital-first capabilities to traditional agency accounts.
Feature differentiation centers on predictive propensity-to-pay models, omnichannel orchestration honoring consumer preferences, and plug-and-play compliance engines that update as rules evolve. Open banking connectivity, decentralized identity wallets, and generative artificial intelligence agents for conversational negotiation represent near-term innovation fronts. Smaller disruptors address the underserved small and medium-sized enterprise segment with all-in-one dashboards, compressing collection lifecycles from weeks to days.
Vendor roadmaps increasingly emphasize partnerships with credit-bureau data providers, payment gateways, and cloud hyperscalers to secure ecosystem reach. Providers that align subscription pricing with recovery outcomes and demonstrate interpretable artificial intelligence models are winning procurement contests, reinforcing a virtuous cycle of performance data that improves algorithms and cements their position in the debt collection software market.
Debt Collection Software Industry Leaders
Fidelity National Information Services Inc. (FIS)
CGI Inc.
Fair Isaac Corporation (FICO)
TransUnion LLC
Pegasystems Inc.
- *Disclaimer: Major Players sorted in no particular order

Recent Industry Developments
- December 2025: Transworld Systems Inc. acquired DebtNext to enhance technology-enabled revenue recovery solutions, integrating advanced analytics and automation across healthcare, loan servicing, and back-office outsourcing.
- May 2025: Ophelos agreed to join forces with Intrum, leveraging Intrum’s resources and Europe-wide debt dataset to scale artificial intelligence products.
- May 2025: TrueAccord announced plans to purchase Sentry Credit, extending its digital-first model to a broader client portfolio.
- February 2025: Fidelity National Information Services Inc. launched Revenue Insight, a predictive analytics platform tuned for Regulation F contact caps.


Research Methodology Framework and Report Scope
Market Definitions and Key Coverage
Our study defines the debt collection software market as the global revenue generated from packaged platforms and cloud services that automate delinquent account follow-up, omnichannel borrower outreach, compliance logging, dispute management, and analytics for first- and third-party recoveries across consumer and commercial credit portfolios. Solutions that ship as modules within broader loan-origination or enterprise resource-planning suites are captured only when offered and billed as standalone collections tools.
Scope Exclusion: Custom in-house scripts, basic dialers without payment workflows, and BPO fee income are outside this scope.
Segmentation Overview
- By Component
- Software
- Services
- By Deployment Mode
- Cloud-Based
- On-Premises
- By Organization Size
- Small and Medium-Sized Enterprises (SMEs)
- Large Enterprises
- By End-User Industry
- Financial Institutions (Banks and NBFCs)
- Collection Agencies
- Healthcare Providers
- Government and Public Sector
- Telecom and Utilities
- Retail and E-Commerce
- Other End-User Industries
- By Geography
- North America
- United States
- Canada
- Mexico
- South America
- Brazil
- Argentina
- Rest of South America
- Europe
- United Kingdom
- Germany
- France
- Spain
- Italy
- Rest of Europe
- Asia Pacific
- China
- India
- Japan
- Australia
- South Korea
- Rest of Asia-Pacific
- Middle East and Africa
- Middle East
- Saudi Arabia
- United Arab Emirates
- Turkey
- Rest of Middle East
- Africa
- South Africa
- Kenya
- Rest of Africa
- Middle East
- North America
Detailed Research Methodology and Data Validation
Primary Research
We interviewed product heads at leading platform providers, recovery managers within banks, fintech lenders in Asia-Pacific, and compliance consultants in Europe. Their insights validated cloud migration speeds, average seats per deployment, and regional price sensitivity, letting us calibrate conversion ratios that secondary data alone cannot surface.
Desk Research
Mordor analysts first assembled an evidence stack from open sources such as the Federal Reserve Consumer Credit data set, European Central Bank non-performing loan dashboards, FDCPA and GDPR regulatory circulars, U.S. Bureau of Labor Statistics wage series for collections agents, and trade filings at the Consumer Financial Protection Bureau. Annual reports, 10-Ks, and investor decks of listed vendors added pricing bands and deployment splits, while patent abstracts on Questel and deal announcements within Dow Jones Factiva flagged emerging AI features reshaping average selling prices.
These references anchor baseline installation counts, switching rates, and SaaS adoption curves.
Further context came from associations like ACA International and Finance & Leasing Association, plus customs shipment codes for on-premise servers. The list above is illustrative; many additional public and subscription sources were reviewed to test consistency and close data gaps.
Market-Sizing & Forecasting
A top-down spend pool was built from credit-portfolio volumes, delinquency rates, and weighted recovery-cycle counts; these were converted to software outlays using penetration and seat-pricing matrices before being further filtered through deployment-mix assumptions. Select bottom-up cross-checks, supplier revenue roll-ups, and sampled user-license multipliers aligned totals within an acceptable variance band. Key variables include: (1) global consumer debt stock, (2) non-performing loan ratios, (3) cloud versus on-premise share, (4) average subscription fee per collector seat, and (5) regulatory change frequency driving refresh cycles. Forecasts rely on multivariate regression blended with scenario analysis, where cloud uptake elasticity and AI pricing premiums steer CAGR trajectories.
Data Validation & Update Cycle
Modeled outputs pass three layers of analyst review; variance thresholds trigger re-runs, and anomalies are re-checked with respondents. We refresh every twelve months and issue interim updates when regulatory shifts or major M&A materially alter baselines. A final pre-publication sweep ensures clients receive the latest view.
Why Our Debt Collection Software Baseline Earns Trust
Published estimates diverge because firms frame the market differently, convert currencies on varied dates, and refresh at unequal tempos.
Key gap drivers often stem from whether adjacent accounts-receivable modules are bundled, how on-premise end-of-life revenues are treated, and the aggressiveness of cloud-premium escalators. Mordor's disciplined scope filters out peripheral AR tools, applies mid-year average exchange rates, and pairs price ladders with seat counts gathered directly from users, yielding a balanced number.
Benchmark comparison
| Market Size | Anonymized source | Primary gap driver |
|---|---|---|
| USD 5.24 B (2025) | Mordor Intelligence | - |
| USD 5.34 B (2024) | Global Consultancy A | Bundles AR automation and payment portals, inflating total |
| USD 4.80 B (2024) | Industry Publication B | Excludes cloud SaaS upsells, relies on older on-premise license data |
| USD 4.11 B (2024) | Regional Consultancy C | Limits geography to OECD and uses 2023 FX rates |
In sum, Mordor's transparent variable selection, annual refresh cadence, and dual-path modeling give decision-makers a dependable, reproducible baseline that avoids over- or under-statement while staying fully traceable to real-world signals.


Key Questions Answered in the Report
What is the projected value of the debt collection software market by 2031?
The debt collection software market is forecast to reach USD 7.54 billion in 2031.
Which component segment is expected to grow fastest during the forecast period?
Services are projected to expand at an 8.18% CAGR as creditors outsource analytics, integration, and compliance management.
Why are buy-now-pay-later defaults influencing software demand?
Rising installment-plan delinquencies require platforms that aggregate balances and negotiate early repayment, fueling adoption among retailers and fintech lenders.
How do data-privacy regulations affect European adoption?
The European Union mandate for explainable scoring and explicit consent raises development costs and lengthens sales cycles, moderating regional growth.
What advantages do cloud deployments offer over on-premises systems?
Cloud platforms ingest real-time payment data, scale elastically during delinquency spikes, and deliver automatic updates that shorten time-to-value.
Which geographic region is forecast to grow the fastest?
Africa is expected to register a 7.32% CAGR, supported by mobile-money ecosystems and improving cloud connectivity.
Page last updated on:


