Market Overview
| Study Period | 2018 - 2031 |
|---|---|
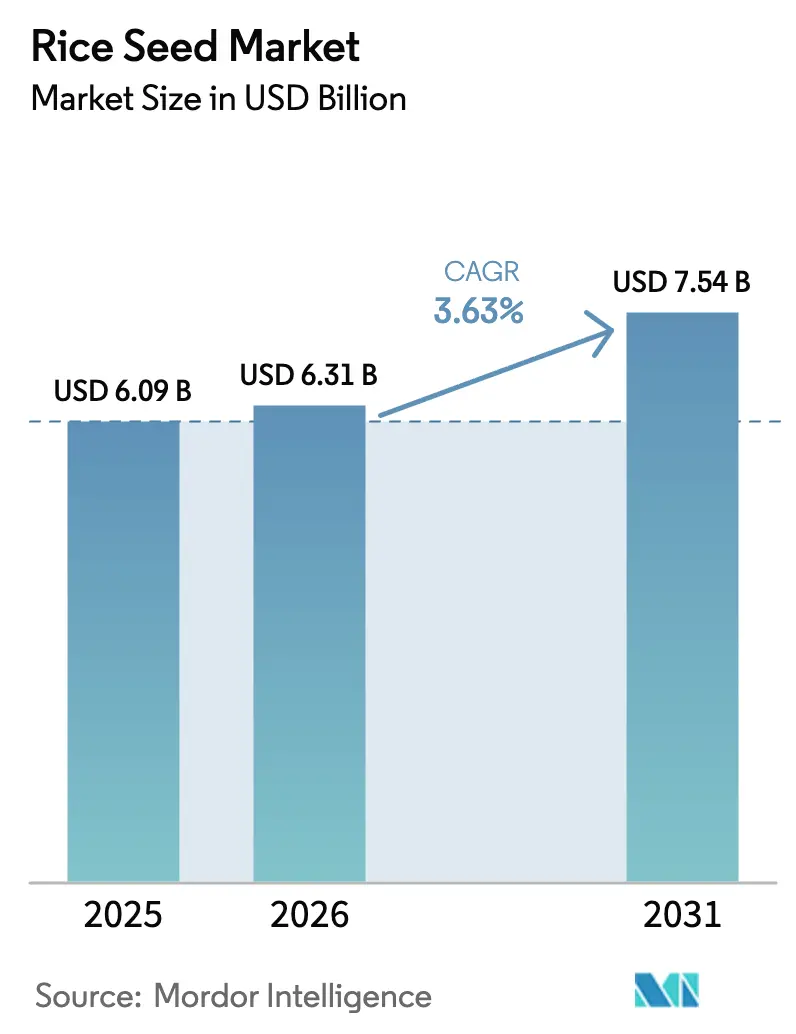
| Market Size (2026) | USD 6.31 Billion |
| Market Size (2031) | USD 7.54 Billion |
| Growth Rate (2026 - 2031) | 3.63% CAGR |
| Fastest Growing Market | North America |
| Largest Market | Asia-Pacific |
| Market Concentration | Low |
Major Players *Disclaimer: Major Players sorted in no particular order Image © Mordor Intelligence. Reuse requires attribution under CC BY 4.0. | |
Rice Seed Market Analysis by Mordor Intelligence
The rice seed market size is expected to grow from USD 6.09 billion in 2025 to USD 6.31 billion in 2026 and is forecast to reach USD 7.54 billion by 2031 at 3.63% CAGR over 2026-2031. This uptick is anchored in sustained government backing for varietal improvement, widening smallholder seed replacement, and heightened climate-resilience needs that collectively keep the rice seed market on a steady growth path. Asia-Pacific retains leadership through intensive farming systems that rely on routine seed renewal, while North America accelerates on the back of precision farming and premium grain categories. Platform-based advisory services, herbicide-tolerant traits, and two-line cytoplasmic male sterility (CMS) breakthroughs are reshaping competitive tactics as the rice seed market prioritizes productivity gains over acreage expansion. Counterfeit seed circulation and cost premiums on hybrids temper momentum, signaling a need for balanced technological and affordability strategies across the rice seed market[1]Source: Press Information Bureau, “National Food Security Mission Phase IV Guidelines,” PIB.GOV.IN.
Key Report Takeaways
- By breeding technology, Open Pollinated Varieties and Hybrid Derivatives held 64.15% of the rice seed market size in 2025, and form the fastest-growing subsegment with a projected 3.76% CAGR to 2031.
- By geography, Asia-Pacific captured 72.90% of the rice seed market share in 2025, while North America is advancing at a 5.46% CAGR through 2031.
Note: Market size and forecast figures in this report are generated using Mordor Intelligence’s proprietary estimation framework, updated with the latest available data and insights as of 2026.
Global Rice Seed Market Trends and Insights
Drivers Impact Analysis*
| Driver | (~) % Impact on CAGR Forecast | Geographic Relevance | Impact Timeline |
|---|---|---|---|
| Government pushes for hybrid seed self-sufficiency | +0.8% | Asia-Pacific core, spill-over to Africa | Medium term (2-4 years) |
| Accelerating adoption of herbicide-tolerant traits | +0.6% | Global, with early gains in North America and Europe | Short term (≤ 2 years) |
| Breakthroughs in two-line CMS breeding technology | +0.5% | Asia-Pacific, particularly China and India | Long term (≥ 4 years) |
| Climate-resilient varieties for drought-prone zones | +0.7% | Global, concentrated in Sub-Saharan Africa and South Asia | Medium term (2-4 years) |
| Digital seed-advice platforms boosting smallholder uptake | +0.4% | Asia-Pacific and Africa | Short term (≤ 2 years) |
| Rising demand for certified seed in Africa's import-substitution programs | +0.3% | Sub-Saharan Africa | Medium term (2-4 years) |
| Source: Mordor Intelligence | |||
Government Push for Hybrid Seed Self-Sufficiency
National food security targets are steering large capital outlays toward domestic hybrid seed production. China allotted USD 2.1 billion in 2024 to elevate hybrid rice seed self-sufficiency to 80% by 2028, stimulating local manufacturing capacity and lowering import reliance[2]Source: Ministry of Agriculture and Rural Affairs of China, “Hybrid Rice Development Strategy 2024-2028,” MOA.GOV.CN. India subsidizes up to 50% of hybrid seed costs, and the Philippines launched the Rice Competitiveness Enhancement Fund with USD 200 million allocated specifically for hybrid seed procurement and distribution. These initiatives create sustained demand for certified seed varieties while reducing reliance on imports, particularly benefiting domestic seed companies that can scale production rapidly. The strategic shift toward self-sufficiency also drives investment in breeding programs focused on locally adapted varieties, creating opportunities for regional players to compete with multinational corporations.
Accelerating Adoption of Herbicide-Tolerant Traits
Herbicide tolerance is transforming weed management economics, trimming labor outlays while boosting field cleanliness. Bayer's Liberty Link rice system gained regulatory approval in the United States in 2024, enabling farmers to apply glufosinate-based herbicides post-emergence without crop damage[3]Source: U.S. Environmental Protection Agency, “Registration of Liberty Link Rice System,” EPA.GOV. Farm trials reported 15-20% yield gains against red rice pressure, positioning herbicide-tolerant hybrids as a high-value differentiator across the rice seed market. Relaxed regulatory pathways in Europe and Brazil further smooth commercialization, expanding the addressable acreage for these traits.
Breakthroughs in Two-Line CMS Breeding Technology
Cytoplasmic Male Sterility breeding systems are revolutionizing hybrid rice development by simplifying seed production processes and reducing costs for seed companies. The technology eliminates the need for maintainer lines in hybrid seed production, enabling more efficient use of breeding resources and faster variety development cycles. Two-line systems also facilitate the incorporation of diverse genetic backgrounds, addressing concerns about genetic uniformity in commercial hybrids. Indian seed companies, including Kaveri Seeds and Nuziveedu Seeds, have licensed two-line technology platforms, with commercial releases planned for 2025, targeting the premium hybrid segment where farmers accept higher seed costs for superior performance.
Climate-Resilient Varieties for Drought-Prone Zones
Extreme weather variability is accelerating demand for rice varieties that maintain productivity under stress conditions, creating new market segments for specialized breeding programs. Heat tolerance traits gain prominence as temperatures rise, with varieties like IR64-Sub1 showing stable performance at temperatures exceeding 35°C during critical growth stages. Salt tolerance becomes increasingly valuable in coastal regions and areas affected by sea-level rise, with varieties developed through marker-assisted breeding showing commercial viability. These climate-smart varieties command premium pricing in affected regions, with farmers willing to pay 15-25% more for seed that reduces production risk, creating sustainable revenue streams for companies investing in stress-tolerance breeding programs.
Restraints Impact Analysis*
| Restraint | (~) % Impact on CAGR Forecast | Geographic Relevance | Impact Timeline |
|---|---|---|---|
| Rising counterfeit seed trade in informal channels | -0.4% | Asia-Pacific and Africa, concentrated in rural areas | Short term (≤ 2 years) |
| Hybrid seed cost premium amid soft paddy prices | -0.5% | Global, particularly affecting smallholder farmers | Medium term (2-4 years) |
| Regulatory uncertainty around gene-edited rice | -0.3% | Global, with varying regional impacts | Long term (≥ 4 years) |
| Narrow genetic base heightening disease-outbreak risk | -0.2% | Global, concentrated in monoculture systems | Long term (≥ 4 years) |
| Source: Mordor Intelligence | |||
Rising Counterfeit Seed Trade in Informal Channels
Counterfeit seed circulation undermines market growth by eroding farmer confidence in improved varieties and reducing legitimate seed company revenues. India's seed industry estimates that counterfeit products account for 25-30% of the informal market, with farmers often unaware they are purchasing substandard seed until harvest failures occur. Digital authentication systems and blockchain-based traceability are emerging as solutions, but implementation costs remain prohibitive for smaller seed companies serving price-sensitive markets.
Hybrid Seed Cost Premium Amid Soft Paddy Prices
The economic viability of hybrid seed adoption faces pressure from declining paddy prices and rising input costs, creating affordability constraints for smallholder farmers. Global rice prices declined in 2024 due to increased production and reduced export demand, squeezing farmer margins and reducing willingness to pay premiums for improved seed. The cost-benefit equation becomes particularly challenging in regions where yield advantages from hybrids are modest, typically 10-15% over local varieties, insufficient to justify the higher seed investment when output prices are depressed.
*Our forecasts treat driver/restraint impacts as directional, not additive. The impact forecasts reflect baseline growth, mix effects, and variable interactions.
Segment Analysis
By Breeding Technology: Conventional Methods Drive Market Stability
Open Pollinated Varieties and Hybrid Derivatives secured 64.15% of rice seed market share in 2025 and are forecast to post a 3.76% CAGR to 2031, underscoring their resilience among cost-conscious growers. This share equates to a good share of the rice seed market size, reflecting farmers’ preference for seed that can be replanted without licensing restrictions. Hybrid offerings, while smaller in absolute volumes, gather momentum via herbicide tolerance and Cytoplasmic Male Sterility (CMS) linked yield lifts. Two-line systems cut parental upkeep expenses and accelerate varietal rollouts, enhancing the value equation of hybrids for medium-scale farms.
Farmers in South and Southeast Asia continue to favor open-pollinated lines for budgetary reasons, but premium pockets in China and the United States pivot toward high-performance hybrids. Non-transgenic hybrids dominate initial volumes owing to smoother regulatory passage, while transgenic classes, led by herbicide-tolerant lines, catch up in markets with lenient biotech laws. Resistant hybrids targeting blast, bacterial blight, or brown planthopper compile a niche but rising demand. Taken together, the mix of conventional and advanced techniques provides a layered innovation ladder that secures steady growth across the rice seed market.


Geography Analysis
Asia-Pacific accounts for 72.90% of the rice seed market size in 2025. The region thrives on intensive double-cropping regimes and government subsidies that ease hybrid adoption, cementing its dominance in the rice seed market. China’s hybrid seed trajectory remains pivotal as new drought-tolerant lines extend acreage in arid provinces. India’s continued rollout of subsidized seed kits supports robust replacement cycles among its 140 million smallholders, while Southeast Asian exporters favor high-purity seed for premium overseas orders.
North America, spearheaded by the United States, is projected to log the fastest 5.46% CAGR. Precision agriculture investments aid optimal seed rate decisions, and specialty categories such as aromatic and organic rice enlarge returns per acre. Regulatory clarity around biotech traits accelerates herbicide-tolerant seed sales, reinforcing the high-yield segment within the rice seed market. Mexico’s consumption surge and Canada’s short-season breeding programs add incremental volumes.
Africa’s rice seed market climbs from a low base as countries shift toward import substitution. Nigeria and Ghana employ subsidy schemes that cut seed costs by up to 40%, catalyzing certified seed uptake. Bank-funded research collaborations target stress-tolerant and nutrient-rich cultivars, safeguarding future expansion. Elsewhere, South America maintains a stable demand led by Brazil and Argentina, Europe focuses on niche varieties adapted to Mediterranean climates, and the Middle East relies on limited local production augmented by imports.


Competitive Landscape
Multinational incumbents and agile regional breeders share a fragmented arena, with no single firm controlling double-digit global share. Syngenta Group, Corteva Inc., Advanta Seeds (UPL Ltd.), SL Agritech Corporation (SLAC), and Bayer AG leverage advanced trait portfolios and integrated digital platforms, enhancing customer stickiness through advisory services. Regional champions such as Kaveri Seeds and Nuziveedu Seeds excel in locally adapted germplasm and last-mile distribution, allowing them to shield share against larger rivals in price-sensitive belts.
Digitalization is fast becoming a standard differentiator. Corteva’s RiceSelect platform marries weather feeds with varietal recommendations, documenting 12% yield lifts and reinforcing customer loyalty. International Rice Research Institute patents on stress-tolerance traits feed both public and licensed pipelines, enabling rapid dissemination of climate-smart germplasm. Competitive intensity thus hinges on genetic novelty, service integration, and geographic tailoring rather than mere volume leadership in the rice seed market.
White-space opportunities persist in African and Latin American seed systems where certified volumes remain low. Biotechnology startups harnessing Clustered Regularly Interspaced Short Palindromic Repeats (CRISPR) for micronutrient fortification or disease immunity could upend conventional timelines, provided regulatory headwinds abate. Seed coating innovators emphasize biological protectants and micronutrient packages, widening aftermarket revenue streams. Overall, companies that integrate molecular breeding, scalable production, and field-level advisory will capture outsized gains in the evolving rice seed market.
Rice Seed Industry Leaders
Bayer AG
SL Agritech Corporation (SLAC)
Syngenta Group
Advanta Seeds (UPL Ltd.)
Corteva Inc.
- *Disclaimer: Major Players sorted in no particular order


Recent Industry Developments
- October 2025: The African Development Bank Group approved a USD 22.8 million grant from its African Development Fund to strengthen Mozambique's rice value chain and enhance climate resilience. The project targets 30,000 smallholder farmers across four provinces and implements climate-smart technologies to improve food security and rural livelihoods.
- August 2025: Scientists at the International Rice Research Institute (IRRI) have identified gene variants OsIRO2. These variants were introduced into the popular variety DRR Dhan 44; they demonstrated a significant ability to increase rice yields during droughts.
- October 2024: The CGIAR Global Rice Science Partnership announced completion of genome sequencing for 500 traditional rice varieties from Africa and Asia, creating a genetic resource database for future breeding programs.


Global Rice Seed Market Report Scope
Hybrids, Open Pollinated Varieties & Hybrid Derivatives are covered as segments by Breeding Technology. Africa, Asia-Pacific, Europe, Middle East, North America, South America are covered as segments by Region.Breeding Technology
| Hybrids | Non-Transgenic Hybrids | |
| Transgenic Hybrids | Herbicide Tolerant Hybrids | |
| Resistant Hybrids | ||
| Other Traits | ||
| Open Pollinated Varieties and Hybrid Derivatives | ||
Geography
| Africa | By Breeding Technology | |
| By Country | Egypt | |
| Ethiopia | ||
| Ghana | ||
| Kenya | ||
| Nigeria | ||
| South Africa | ||
| Tanzania | ||
| Rest of Africa | ||
| Asia-Pacific | By Breeding Technology | |
| Australia | ||
| Bangladesh | ||
| China | ||
| India | ||
| Indonesia | ||
| Japan | ||
| Myanmar | ||
| Pakistan | ||
| Philippines | ||
| Thailand | ||
| Vietnam | ||
| Rest of Asia-Pacific | ||
| Europe | By Breeding Technology | |
| France | ||
| Italy | ||
| Romania | ||
| Russia | ||
| Spain | ||
| Turkey | ||
| Ukraine | ||
| Rest of Europe | ||
| Middle East | By Breeding Technology | |
| Iran | ||
| Rest of Middle East | ||
| North America | By Breeding Technology | |
| Mexico | ||
| United States | ||
| Rest of North America | ||
| South America | By Breeding Technology | |
| Argentina | ||
| Brazil | ||
| Rest of South America | ||
| Breeding Technology | Hybrids | Non-Transgenic Hybrids | |
| Transgenic Hybrids | Herbicide Tolerant Hybrids | ||
| Resistant Hybrids | |||
| Other Traits | |||
| Open Pollinated Varieties and Hybrid Derivatives | |||
| Geography | Africa | By Breeding Technology | |
| By Country | Egypt | ||
| Ethiopia | |||
| Ghana | |||
| Kenya | |||
| Nigeria | |||
| South Africa | |||
| Tanzania | |||
| Rest of Africa | |||
| Asia-Pacific | By Breeding Technology | ||
| Australia | |||
| Bangladesh | |||
| China | |||
| India | |||
| Indonesia | |||
| Japan | |||
| Myanmar | |||
| Pakistan | |||
| Philippines | |||
| Thailand | |||
| Vietnam | |||
| Rest of Asia-Pacific | |||
| Europe | By Breeding Technology | ||
| France | |||
| Italy | |||
| Romania | |||
| Russia | |||
| Spain | |||
| Turkey | |||
| Ukraine | |||
| Rest of Europe | |||
| Middle East | By Breeding Technology | ||
| Iran | |||
| Rest of Middle East | |||
| North America | By Breeding Technology | ||
| Mexico | |||
| United States | |||
| Rest of North America | |||
| South America | By Breeding Technology | ||
| Argentina | |||
| Brazil | |||
| Rest of South America | |||


Market Definition
- Commercial Seed - For the purpose of this study, only commercial seeds have been included as part of the scope. Farm-saved Seeds, which are not commercially labeled are excluded from scope, even though a minor percentage of farm-saved seeds are exchanged commercially among farmers. The scope also excludes vegetatively reproduced crops and plant parts, which may be commercially sold in the market.
- Crop Acreage - While calculating the acreage under different crops, the Gross Cropped Area has been considered. Also known as Area Harvested, according to the Food & Agricultural Organization (FAO), this includes the total area cultivated under a particular crop across seasons.
- Seed Replacement Rate - Seed Replacement Rate is the percentage of area sown out of the total area of crop planted in the season by using certified/quality seeds other than the farm-saved seed.
- Protected Cultivation - The report defines protected cultivation as the process of growing crops in a controlled environment. This includes greenhouses, glasshouses, hydroponics, aeroponics, or any other cultivation system that protects the crop against any abiotic stress. However, cultivation in an open field using plastic mulch is excluded from this definition and is included under open field.
| Keyword | Definition |
|---|---|
| Row Crops | These are usually the field crops which include the different crop categories like grains & cereals, oilseeds, fiber crops like cotton, pulses, and forage crops. |
| Solanaceae | These are the family of flowering plants which includes tomato, chili, eggplants, and other crops. |
| Cucurbits | It represents a gourd family consisting of about 965 species in around 95 genera. The major crops considered for this study include Cucumber & Gherkin, Pumpkin and squash, and other crops. |
| Brassicas | It is a genus of plants in the cabbage and mustard family. It includes crops such as carrots, cabbage, cauliflower & broccoli. |
| Roots & Bulbs | The roots and bulbs segment includes onion, garlic, potato, and other crops. |
| Unclassified Vegetables | This segment in the report includes the crops which don’t belong to any of the above-mentioned categories. These include crops such as okra, asparagus, lettuce, peas, spinach, and others. |
| Hybrid Seed | It is the first generation of the seed produced by controlling cross-pollination and by combining two or more varieties, or species. |
| Transgenic Seed | It is a seed that is genetically modified to contain certain desirable input and/or output traits. |
| Non-Transgenic Seed | The seed produced through cross-pollination without any genetic modification. |
| Open-Pollinated Varieties & Hybrid Derivatives | Open-pollinated varieties produce seeds true to type as they cross-pollinate only with other plants of the same variety. |
| Other Solanaceae | The crops considered under other Solanaceae include bell peppers and other different peppers based on the locality of the respective countries. |
| Other Brassicaceae | The crops considered under other brassicas include radishes, turnips, Brussels sprouts, and kale. |
| Other Roots & Bulbs | The crops considered under other roots & bulbs include Sweet Potatoes and cassava. |
| Other Cucurbits | The crops considered under other cucurbits include gourds (bottle gourd, bitter gourd, ridge gourd, Snake gourd, and others). |
| Other Grains & Cereals | The crops considered under other grains & cereals include Barley, Buck Wheat, Canary Seed, Triticale, Oats, Millets, and Rye. |
| Other Fibre Crops | The crops considered under other fibers include Hemp, Jute, Agave fibers, Flax, Kenaf, Ramie, Abaca, Sisal, and Kapok. |
| Other Oilseeds | The crops considered under other oilseeds include Ground nut, Hempseed, Mustard seed, Castor seeds, safflower seeds, Sesame seeds, and Linseeds. |
| Other Forage Crops | The crops considered under other forages include Napier grass, Oat grass, White clover, Ryegrass, and Timothy. Other forage crops were considered based on the locality of the respective countries. |
| Pulses | Pigeon peas, Lentils, Broad and horse beans, Vetches, Chickpeas, Cowpeas, Lupins, and Bambara beans are the crops considered under pulses. |
| Other Unclassified Vegetables | The crops considered under other unclassified vegetables include Artichokes, Cassava Leaves, Leeks, Chicory, and String beans. |


Research Methodology
Mordor Intelligence follows a four-step methodology in all our reports.
- Step-1: IDENTIFY KEY VARIABLES: In order to build a robust forecasting methodology, the variables and factors identified in Step-1 are tested against available historical market numbers. Through an iterative process, the variables required for market forecast are set and the model is built on the basis of these variables.
- Step-2: Build a Market Model: Market-size estimations for the forecast years are in nominal terms. Inflation is not a part of the pricing, and the average selling price (ASP) is kept constant throughout the forecast period.
- Step-3: Validate and Finalize: In this important step, all market numbers, variables and analyst calls are validated through an extensive network of primary research experts from the market studied. The respondents are selected across levels and functions to generate a holistic picture of the market studied.
- Step-4: Research Outputs: Syndicated Reports, Custom Consulting Assignments, Databases, and Subscription Platforms


