
RF GaN Market Size and Share
Market Overview
| Study Period | 2020 - 2031 |
|---|---|
| Market Size (2026) | USD 2.41 Billion |
| Market Size (2031) | USD 5.90 Billion |
| Growth Rate (2026 - 2031) | 19.61 % |
| Fastest Growing Market | Asia Pacific |
| Largest Market | North America |
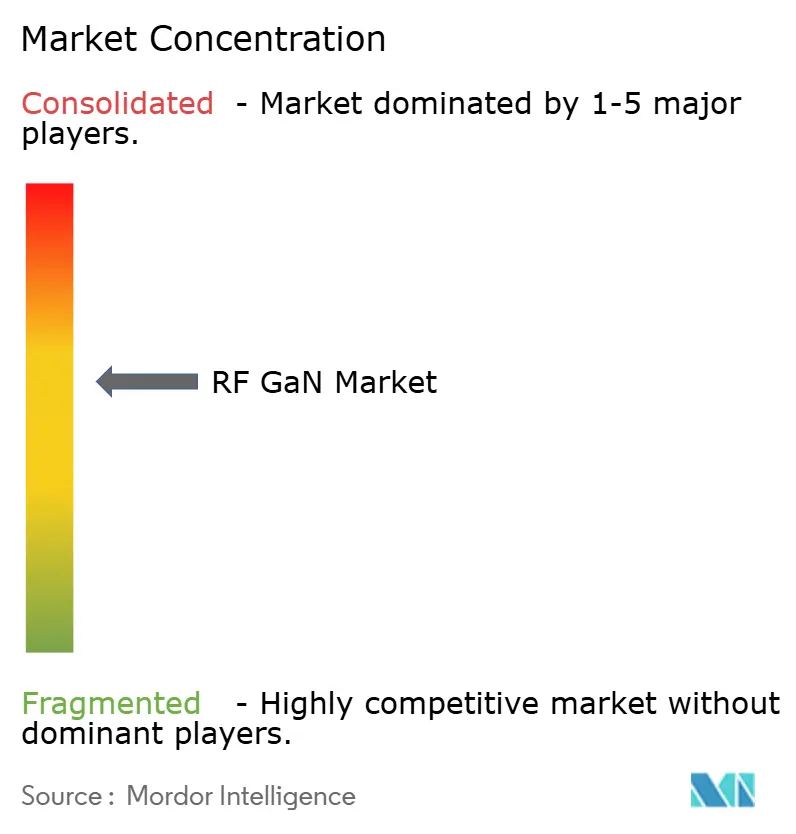
| Market Concentration | Medium |
Major Players *Disclaimer: Major Players sorted in no particular order Image © Mordor Intelligence. Reuse requires attribution under CC BY 4.0. | |
RF GaN Market Analysis by Mordor Intelligence
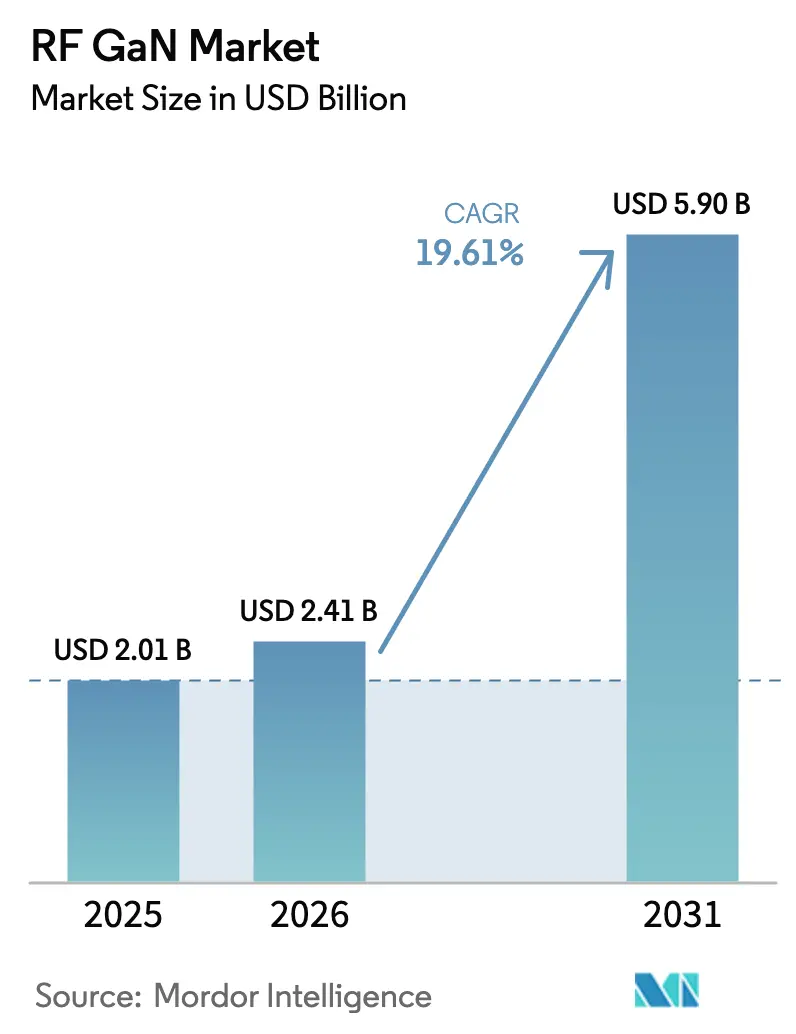
The RF GaN Market size was valued at USD 2.01 billion in 2025 and is estimated to grow from USD 2.41 billion in 2026 to reach USD 5.90 billion by 2031, at a CAGR of 19.61% during the forecast period (2026-2031).
Progress is linked to three intertwined forces: sub-6 GHz massive MIMO rollouts, rising defense procurement of active electronically scanned array radars, and migration to larger GaN-on-SiC wafers, which have trimmed the dollar-per-watt cost by nearly 30% since 2024. At the same time, equipment makers are standardizing discrete HEMT and MMIC designs that simplify integration across telecom, radar, and satellite payloads. The growing preference for higher power density beyond 6 GHz plays to SiC’s thermal advantage, while export-control rules are fragmenting supply chains, prompting governments to subsidize domestic epitaxy. These dynamics, together, keep pricing on a downward slope while sustaining premium margins for leading integrated vendors.
Key Report Takeaways
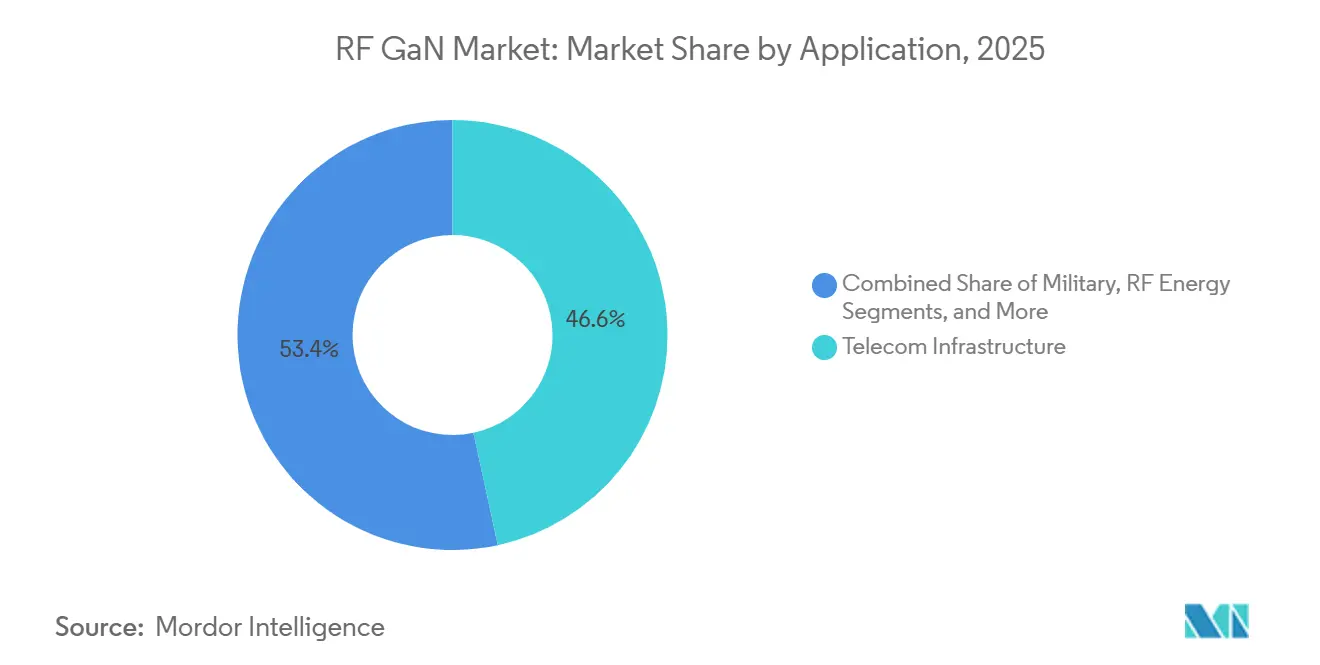
- By application, telecom infrastructure led with a 46.62% revenue share of the RF GaN market in 2025, whereas satellite communication is forecast to grow at a 20.44% CAGR through 2031.
- By material type, GaN-on-SiC captured 72.73% of RF GaN market revenue in 2025 and is expected to expand at a 21.12% CAGR through 2031.
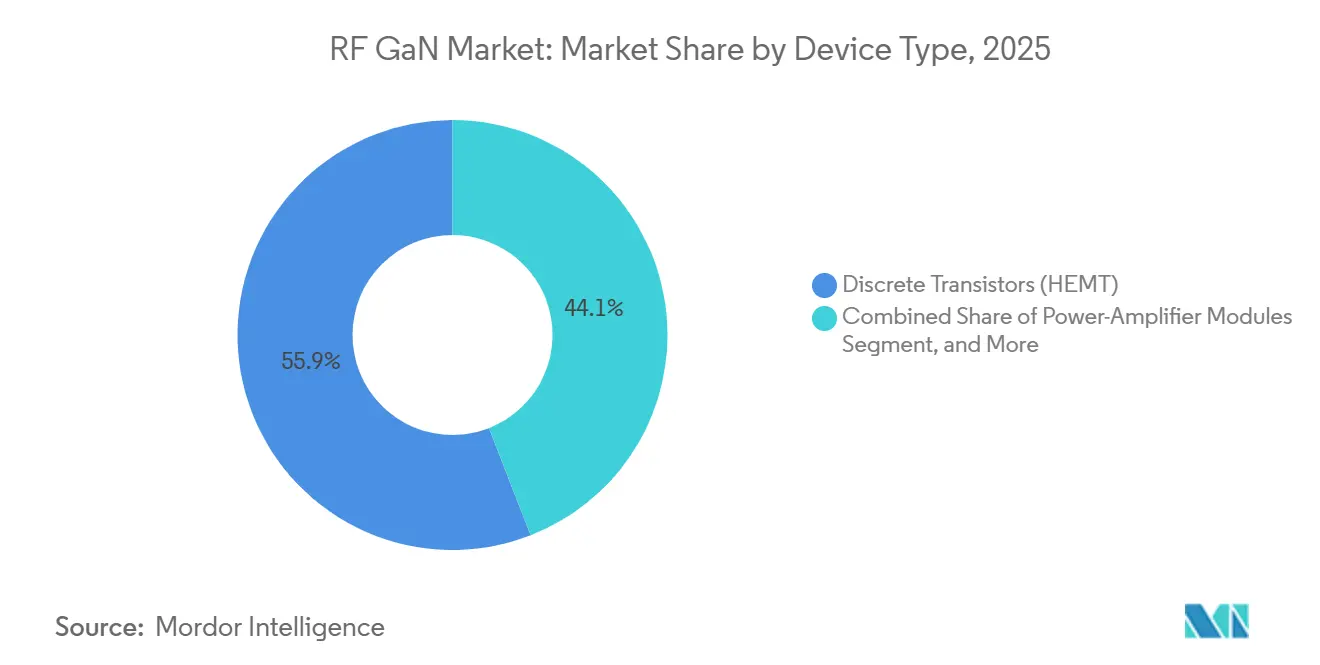
- By device type, discrete HEMTs accounted for a 55.93% revenue share of the RF GaN market in 2025, while MMICs are projected to advance at a 20.78% CAGR through 2031.
- By frequency band, the 3-6 GHz range held 48.74% of RF GaN market revenue in 2025, and the above-18 GHz segment is set to post a 20.76% CAGR through 2031.
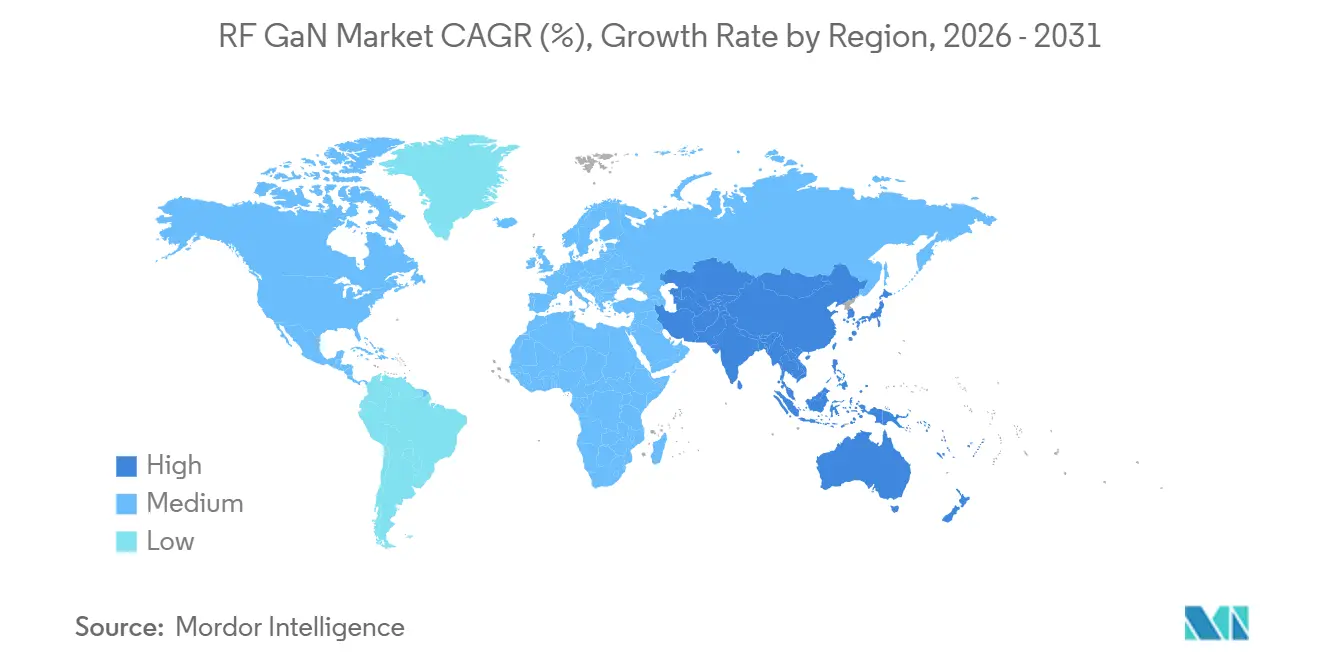
- By geography, North America commanded 39.74% of the RF GaN market share in 2025, whereas Asia-Pacific is forecast to post a 20.67% CAGR through 2031.
Note: Market size and forecast figures in this report are generated using Mordor Intelligence’s proprietary estimation framework, updated with the latest available data and insights as of January 2026.
Market Trends and Insights
Drivers Impact Analysis of RF GaN Market*
| Driver | (~) % Impact on CAGR Forecast | Geographic Relevance | Impact Timeline |
|---|---|---|---|
| Surge in sub-6 GHz 5G mMIMO base-station deployments | +3.8% | Global, with concentration in China, India, and North America | Medium term (2-4 years) |
| Accelerating AESA radar upgrades across defense platforms | +3.2% | North America, Europe, and Asia-Pacific (Japan, South Korea, India) | Long term (≥ 4 years) |
| Transition to 6-inch and 8-inch GaN-on-SiC wafers lowering USD/W | +4.1% | Global, led by North America and Asia-Pacific foundries | Short term (≤ 2 years) |
| GaN front-end adoption in LEO and GEO satellite payloads | +2.9% | Global, with early traction in North America and Europe | Medium term (2-4 years) |
| Demand for ultra-wide-bandwidth PAs in mmWave backhaul | +2.6% | Urban centers in North America, Europe, and Asia-Pacific | Medium term (2-4 years) |
| Government funding for domestic compound-semiconductor supply chains | +2.4% | North America (CHIPS Act), Europe (European Chips Act), Asia-Pacific (Japan, South Korea) | Long term (≥ 4 years) |
| Source: Mordor Intelligence | |||


Surge in Sub-6 GHz 5G mMIMO Base-Station Deployments
Mobile operators installed 1.2 million new 5G sites in 2025, of which 68% included 64-transceiver massive MIMO radios that each embed at least 64 GaN power amplifiers.[1]Ericsson, “Mobile Network Infrastructure Shipments 2025,” ericsson.com Mitsubishi Electric shipped a 200-watt C-band module in June 2025, which achieved 50% drain efficiency at a 6 dB back-off, representing a 12 percentage-point improvement over the prior generation.[2]Mitsubishi Electric, “200 W C-Band GaN Power Amplifier,” mitsubishielectric.com China’s operators spent CNY 87 billion on 5G radios in 2025, specifying 40% indigenous GaN content in line with Made in China 2025 targets. India’s regulator mandated triple-band carrier aggregation for macro cells from January 2026, implicitly doubling the amplifier count per site. Together these mandates concentrate near-term demand in the 3.3–3.8 GHz window, keeping the RF GaN market firmly anchored in sub-6 GHz shipments.
Accelerating AESA Radar Upgrades Across Defense Platforms
Fourteen defense ministries committed USD 8.3 billion to AESA radar refresh programs during 2025, moving from gallium arsenide to GaN transmit-receive modules that double detection range while lowering fleet power draw.[3]Raytheon Technologies, “APG-82(V)X Radar Deliveries,” rtx.com Raytheon began X-band APG-82(V)X deliveries for F-15EX and F-16V jets in September 2025, each array integrating 1,200 GaN MMICs. Japan’s Ministry of Defense awarded Mitsubishi Electric USD 310 million in March 2025 to develop an indigenous fire-control radar for its next-generation fighter. Northrop Grumman disclosed that GaN content inside its AN/APG-83 radar rose from 22% in 2023 to 61% in 2025. Export rules under the International Traffic in Arms Regulations channel sales to allied nations, sustaining premium average selling prices that finance ongoing process R&D.
Transition to 6-Inch and 8-Inch GaN-on-SiC Wafers Lowering USD per Watt
Wolfspeed ramped 200-millimeter SiC wafers to 10,000 units per month at its Mohawk Valley fab in 2025, compressing epitaxial substrate cost by 28% and allowing device makers to cut amplifier pricing from USD 4.20 per watt in 2024 to USD 3.10 per watt by mid-2025. TSMC followed with pilot production of GaN-on-SiC on 200-millimeter wafers in its Tainan plant during the second quarter of 2025. Chinese producer Innoscience achieved 10,000 wafer starts per month on 8-inch GaN-on-Si but still trails SiC-based devices by 15-20% in on-resistance and breakdown voltage. United States CHIPS Act funding of USD 750 million for Wolfspeed in September 2025 aims to scale 200-millimeter capacity to 40,000 wafers per month by 2028. This rapid shift to larger diameters underpins a multi-year cost curve that broadens RF GaN market penetration into price-sensitive infrastructure.
GaN Front-End Adoption in LEO and GEO Satellite Payloads
LEO operators ordered about 4,800 satellites in 2025, and 72% specified Ku- or Ka-band GaN amplifiers for throughput above 100 Gbps per craft. Qorvo released a K-band amplifier in May 2025 delivering 40 watts across 17.7–20.2 GHz at 35% efficiency, enabling phased-array builders to cut amplifier count by one-third and shave 18 kilograms from payload mass. SES outfitted three GEO satellites launched in 2025 with flexible GaN payloads that shift bandwidth between beams without ground intervention. The European Space Agency placed an EUR 85 million order with Thales Alenia Space for a digital beamforming payload that relies on GaN MMICs. Thermal control remains critical, and Akash Systems demonstrated GaN-on-diamond prototypes that lowered junction temperature by 40 °C but are unlikely to reach serial production before 2027.
Restraints Impact Analysis of RF GaN Market*
| Restraint | (~) % Impact on CAGR Forecast | Geographic Relevance | Impact Timeline |
|---|---|---|---|
| High epitaxial-wafer defect density affecting yield | -1.8% | Global, with acute impact in emerging Asia-Pacific fabs | Short term (≤ 2 years) |
| Thermal-management limits above 10 W/mm in dense arrays | -1.3% | Global, particularly in defense and satellite applications | Medium term (2-4 years) |
| Export-control regulations on GaN devices and MOCVD tools | -1.1% | China and other non-allied markets | Long term (≥ 4 years) |
| Competition from advanced LDMOS below 3 GHz | -0.9% | Telecom infrastructure in cost-sensitive markets (India, Southeast Asia, Latin America) | Medium term (2-4 years) |
| Source: Mordor Intelligence | |||
High Epitaxial-Wafer Defect Density Affecting Yield
Commercial GaN-on-SiC epitaxy posted threading dislocation densities near 5 × 10⁸ cm-2 in 2025, about ten times higher than mature GaAs lines, depressing yields by up to 25% on high-power parts. Wolfspeed disclosed that rework consumed 8% of wafer starts at its Durham site and compressed gross margin by 220 basis points in fiscal 2025. AIXTRON and Veeco launched in-situ optical reflectometry add-ons priced at USD 1.2 million per reactor that let engineers abort defective runs early, yet fewer than one-third of reactors were retrofitted in 2025. United States export controls on advanced MOCVD tools introduced in October 2024 further limited Chinese fabs’ ability to adopt these upgrades, widening the yield gap with Western suppliers. Until densities fall below 1 × 10⁸ cm-2 the RF GaN market gains in cost will be tempered.
Thermal-Management Limits Above 10 W/mm in Dense Arrays
Power densities exceeding 10 W/mm create hot spots above 250 °C that throttle reliability to under 10,000 hours, well short of telecom service life targets. Akash Systems’ GaN-on-diamond prototypes sustained 12 W/mm for 5,000 hours at 200 °C ambient yet added USD 800 per 4-inch wafer to cost and limited monthly throughput to 400 wafers. Defense primes require 15 W/mm performance for next-generation tracking radars but presently rely on active liquid cooling that adds 8 kilograms and 120 watts per airborne array. The IEEE Microwave Theory and Techniques Society organized a standards group in March 2025 to harmonize wide-bandgap thermal test methods, aiming to shorten qualification cycles. Without a step forward in diamond or microfluidic cooling, elevated junction temperatures will restrain deployment in ultra-dense phased arrays.
*Our forecasts treat driver/restraint impacts as directional, not additive. The impact forecasts reflect baseline growth, mix effects, and variable interactions.
RF GaN Market Segment Analysis
By Application:
Satellite Communication Gains Long-Term MomentumTelecom infrastructure accounted for 46.62% of revenue in 2025 as operators supported 5.2 million 5G base stations worldwide. Satellite communication, however, is on track to register a 20.44% CAGR and will narrow the gap by 2031, powered by rising LEO constellation launches. Military programs such as AESA radar retrofits kept defense in the second position, while wired broadband nodes within DOCSIS 4.0 upgrades delivered steady but low-growth orders. Commercial radar and avionics created a small yet profitable niche, as Honeywell adopted GaN to shrink antenna size by 40%.
Operators chasing higher throughput now view Ka-band payloads as standard, which keeps amplifier counts per satellite high and secures multi-year visibility for suppliers. In contrast, RF energy applications stayed experimental although Mitsubishi Electric showcased a 70% efficient 915 MHz module for industrial ovens in June 2025. Regulatory shifts such as the United States FCC C-band repack also redirect spectrum toward 5G, indirectly boosting GaN demand in the 3.7–3.98 GHz slice. Overall, telecom dominates present consumption, yet satellite communication is likely to carry the growth banner for the RF GaN market through the forecast horizon.


By Material Type:
SiC Continues to Outperform SiliconGaN-on-SiC substrates held 72.73% revenue in 2025, underscoring SiC’s thermal conductivity of 490 W/m K that allows junction temperatures above 200 °C without failure. GaN-on-Si remains relevant below 3 GHz where lower breakdown voltage is acceptable, but many operators are shifting to SiC to maximize power-added efficiency. The RF GaN market size advantage for GaN-on-SiC widens further at high frequencies, and the category is set for a 21.12% CAGR to 2031.
Cost pressure is easing as Wolfspeed lowered the 200-millimeter SiC wafer price from USD 850 in 2024 to USD 610 in 2025, narrowing the gap with silicon and encouraging broader adoption. Other options, such as GaN-on-diamond, showed a 40–50 °C junction reduction but, at USD 2,400 per 4-inch wafer, remain confined to premium defense applications. As foundries scale to larger diameters, SiC’s performance lead, combined with falling substrate costs, will keep it the default choice for high power density designs across the RF GaN market.
By Device Type:
MMIC Adoption Reflects Integration PushDiscrete HEMTs enjoyed 55.93% of 2025 revenue because designers could optimize matching networks for each band, yet MMICs are forecast to grow 20.78% per year as phased-array builders prioritize compactness. A single MMIC replaces up to 12 discrete parts, trimming assembly labor by 60% and boosting phase coherence across antenna elements. Power amplifier modules, which bundle GaN die and control circuits in one package, comprised 22% of revenue and are gaining traction in satellite ground terminals where plug-and-play architecture is prized.
Driver amplifiers remain the smallest slice but are rising inside multi-stage chains where GaN’s gain eliminates an extra step, saving USD 180 per radio. With foundry multi-project wafers cutting non-recurring engineering cost from USD 400,000 to USD 80,000, smaller integrators can now commission custom MMICs, democratizing RF GaN market entry. Integration therefore becomes the primary lever for cost and performance gains over the next six years.
By Frequency Band:
Millimeter Wave Delivers the Fastest GrowthThe 3–6 GHz band carried 48.74% of 2025 revenue, reflecting widespread C-band and sub-6 GHz 5G deployments. Below-3 GHz traffic is centered on legacy L- and S-band systems, where LDMOS retains a cost advantage. The 6–18 GHz slice contributed 28% of revenue, driven by defense radar and Ku-band ground terminals. However, frequencies above 18 GHz are expected to grow at a 20.76% CAGR as E-band backhaul and Ka-band satellite services expand.
Ericsson released an E-band radio in 2025, utilizing GaN amplifiers to deliver 10 Gbps over a distance of two kilometers, providing mobile operators with a fiber alternative. Starlink’s second-generation user terminals adopted GaN-on-SiC amplifiers at 28 GHz, pushing the peak downlink to 350 Mbps. International Telecommunication Union allocations at WRC-23 added further Ka-band spectrum, setting the stage for increased demand for GaN in ground infrastructure. Rising heat flux at millimeter wave forces tighter thermal engineering, yet the use-case expansion signals sustained momentum for the RF GaN market.
Geography Analysis
North America RF GaN Market
North America retained 39.74% share in 2025 due to defense outlays of USD 886 billion and CHIPS Act incentives exceeding USD 900 million that underwrite capacity expansion at Wolfspeed, Skyworks, and BAE Systems. Canada added USD 88 million for radiation-hardened GaN research, and Mexico drew modest assembly investment, leveraging proximity to United States design hubs.
APAC RF GaN Market
Asia Pacific is set for a 20.67% CAGR through 2031. China erected 900,000 5G base stations in 2025 and committed CNY 50 billion to epitaxial wafer R&D. Japan’s economic ministry earmarked subsidies for wide-bandgap fabs, while India’s production-linked incentive scheme covers up to 50% of capital cost, drawing interest from Tata Group. ASEAN nations, especially Vietnam and Thailand, position themselves as assembly hubs to mix lower labor cost with export privileges.
EMEA and LATAM RF GaN Market
Europe held a mid-teens stake. The European Chips Act unlocked EUR 1.2 billion for pilot lines, and Infineon Technologies closed its USD 830 million GaN Systems acquisition, though focus remains mainly below 1 GHz. STMicroelectronics’ Catania line accounts for sub-10% RF output yet strengthens regional capability. Middle East and Africa saw demand from satellite gateways in the United Arab Emirates and Saudi Arabia, while Latin America stays early stage with isolated defense programs such as Embraer’s GaN-enabled aircraft radios.

Regulatory Landscape
RF GaN shipments sit at the intersection of export-control requirements for dual-use items and defense procurement compliance. In the United States, export-control scope has continued to tighten through the Export Administration Regulations (EAR), adding new classification and screening requirements for GaN-related items, while ITAR continues to channel many high-performance radar and satellite payload programs toward allied-country supply chains.
In Europe, the European Commission updated the EU dual-use control framework via Delegated Regulation (EU) 2025/2003, which revises Annex I of Regulation (EU) 2021/821 to reflect updated multilateral control lists. On the procurement side, the United States also moved forward with a February 2026 proposed Federal Acquisition Regulation (FAR) rule to implement Section 5949 of the FY2023 NDAA, setting a path to prohibit executive agencies from procuring covered semiconductor products effective December 23, 2027. This expands the need for traceability and compliant sourcing across RF GaN bills of materials.
Value Chain Analysis
The RF GaN value chain starts with upstream materials, primarily SiC substrates (boules, wafering, polishing) and, for cost-oriented nodes, GaN-on-Si starting wafers. These feed epitaxial growth (MOCVD), followed by device fabrication at IDMs and specialty foundries. Back-end processes such as thinning, metallization, and advanced packaging then shape performance for high-power RF applications, including thermally optimized packages.
Downstream, RF GaN devices are integrated into discrete transistors (HEMTs), MMICs, and power-amplifier modules, which are then designed into radios (massive MIMO and backhaul), AESA radar T/R modules, and satellite payload and ground terminal line-replaceable units. Manufacturing is split between vertically integrated suppliers (for example, firms that control substrate through device) and outsourced production using pure-play compound semiconductor foundries such as WIN Semiconductors, alongside multi-technology platforms such as GlobalFoundries for RF GaN offerings. Substrate availability and yield are the main friction points, particularly for GaN-on-SiC where defect density and reactor upgrades directly affect die-per-wafer economics. Export controls on advanced tools and the push for sovereign supply chains also make qualified second sources across substrate, epitaxy, and packaging more important for defense and satellite programs with long qualification timelines and lot traceability requirements.
Competitive Landscape
The RF GaN market features moderate consolidation as the top five suppliers account for roughly 58% of 2025 revenue. Qorvo and Wolfspeed pursue vertical integration, controlling substrate growth, epitaxy, and device fabrication, which protects gross margin against substrate price swings. Fabless firms such as Analog Devices and Skyworks Solutions lean on foundry partners like WIN Semiconductors and TSMC, leaving them exposed to allocation constraints.
Emerging specialists like Guerrilla RF and Tagore Technology secure design wins in niche bands by offering custom MMICs with 12-week lead times that undercut the larger vendors’ 20-week norm. Innoscience scales 8-inch GaN-on-Si to 10,000 wafer starts per month aiming at sub-3 GHz telecom segments, while Akash Systems pursues GaN-on-diamond for thermal-limited defense arrays though commercial release is slated for 2027. Patent filings tracked in 2025 show heightened focus on thermal management strategies, with Raytheon Technologies developing microfluidic substrates and Mitsubishi Electric experimenting with diamond composite heat spreaders.
United States export controls enacted in October 2024 restrict shipments of GaN devices above 27 GHz and advanced MOCVD tools to China, forcing Chinese fabs to rely on older equipment that yields 15-20% fewer good dies. Beijing counters with funding for indigenous epitaxy yet remains confined to value-tier infrastructure. Overall, cost curves, substrate access, and thermal innovation together dictate competitive positioning through 2031.
RF GaN Industry Leaders
Mitsubishi Electric Corporation
STMicroelectronics NV
Qorvo Inc.
Analog Devices Inc.
Raytheon Technologies
- *Disclaimer: Major Players sorted in no particular order
RF GaN Market Companies Covered in this Report
- Aethercomm Inc.
- Ampleon Netherlands B.V.
- Analog Devices Inc.
- Broadcom Inc.
- Efficient Power Conversion Corp.
- Guerrilla RF Inc.
- HRL Laboratories LLC
- Infineon Technologies AG
- Integra Technologies Inc.
- MACOM Technology Solutions Holdings Inc.
- Mercury Systems Inc.
- Mitsubishi Electric Corp.
- NXP Semiconductors N.V.
- Northrop Grumman Corp.
- Qorvo Inc.
- Raytheon Technologies Corp.
- RFHIC Corp.
- Skyworks Solutions Inc.
- STMicroelectronics N.V.
- Sumitomo Electric Device Innovations Inc.
- Tagore Technology Inc.
- Teledyne Technologies Inc.
- Toshiba Corp.
- WIN Semiconductors Corp.
- Wolfspeed Inc.

Market Opportunities and Future Outlook
A major whitespace sits in cost-down and volume-scaling pathways that expand RF GaN beyond premium defense and flagship macro radios into broader infrastructure and terminal-adjacent RF applications. The June 2026 milestone from CETC's 55th Research Institute and Nanjing Guobo Electronics, reporting delivery of five million GaN-on-Si RF chips for integrated space-air-ground network terminals, points to a concrete route where GaN-on-Si and high-throughput manufacturing can unlock larger unit volumes. At the same time, GaN-on-SiC continues to serve as the performance anchor for high-power density and higher-frequency payloads.
On the supply side, opportunity also comes from diversifying RF GaN manufacturing access and reducing dependence on constrained GaN-on-SiC capacity. GlobalFoundries publicized readiness for volume production of its RFGaN1 platform, and WIN Semiconductors qualified its NP12-0B GaN platform for 40 V RF operation, reinforcing a broader foundry footprint that supports custom MMIC cycles and multi-project wafer runs. Thermal and reliability bottlenecks above 10 W/mm also create room for material and packaging innovation, with programs such as Mitsubishi Electric's GaN-on-diamond bonding work (demonstrated with academic and research partners) mapping to the needs of dense phased arrays in radar and advanced satellite payload architectures.
Recent Industry Developments in RF GaN Market
- May 2026: STMicroelectronics introduced new 700 V PowerGaN transistors, expanding its STPOWER GaN portfolio toward high-demand power conversion applications. While positioned for power electronics, the update reinforces broader GaN device scaling, process learning, and supply alignment that also supports RF GaN ecosystems in substrates, packaging, and reliability methodologies.
- June 2025: Mitsubishi Electric verified performance of a 7 GHz GaN power amplifier module for 5G-Advanced base stations using proprietary matching-circuit technology. The demonstration targets higher-frequency, higher-efficiency radio units, supporting the upgrade cycle from sub-6 GHz massive MIMO toward more demanding 5G-Advanced architectures that increase RF power density requirements.
- June 2024: Mitsubishi Electric began shipping samples of 8 W and 14 W GaN MMIC power amplifiers for Ka-band satellite communication earth stations. These samples broaden the commercial base of Ka-band GaN lineups used in SATCOM gateways and phased-array terminals, linking RF GaN demand more directly to satellite ground infrastructure buildouts.


RF GaN Market Report Scope and Research Methodology
Market Definition and Coverage
This market captures revenue generated from RF gallium nitride (GaN) devices used to amplify, switch, or manage radio-frequency signals across defense, telecom, satellite, radar, and adjacent RF uses. Values are counted at the RF GaN device and module level and are reported in USD.
Scope exclusions: This sizing excludes non-RF GaN power electronics used mainly for AC to DC conversion, motor drives, and general power management.
Segments Covered in This Report
- By Application
- Military
- Telecom Infrastructure (Backhaul, RRH, Massive MIMO, Small Cells)
- Satellite Communication
- Wired Broadband
- Commercial Radar and Avionics
- RF Energy
- By Material Type
- GaN-on-Si
- GaN-on-SiC
- Other Material Types (GaN-on-GaN, GaN-on-Diamond)
- By Device Type
- Discrete Transistors (HEMT)
- Monolithic Microwave ICs (MMIC)
- Power-Amplifier Modules
- Driver Amplifiers
- By Frequency Band
- Below 3 GHz (L, S Bands)
- 3 – 6 GHz (C Band, 5G Sub-6)
- 6 – 18 GHz (X, Ku)
- Above 18 GHz (Ka, mmWave)
- By Geography
- North America
- United States
- Canada
- Mexico
- South America
- Brazil
- Argentina
- Rest of South America
- Europe
- Germany
- United Kingdom
- France
- Italy
- Spain
- Rest of Europe
- Asia-Pacific
- China
- Japan
- South Korea
- India
- ASEAN
- Oceania
- Rest of Asia-Pacific
- Middle East and Africa
- Middle East
- Saudi Arabia
- UAE
- Turkey
- Rest of Middle East
- Africa
- South Africa
- North Africa
- Rest of Africa
- Middle East
- North America
Data Sources, Market Sizing, and Validation
Desk Research
Desk work starts by building a clean fact base on where RF GaN is being adopted and how the supply chain is shifting. We rely on public and official sources such as telecom standards and spectrum references from ITU materials, trade and tariff statistics from the USITC DataWeb, semiconductor and electronics trade material from IEEE publications, and defense procurement and budget documents from the US DoD and similar public ministries.
After that, company disclosures are used to map product direction and revenue exposure, including annual reports, investor presentations, and press releases, plus technical conference papers that clarify frequency bands, power classes, and typical use cases. For cross-checks, we also use paid subscriptions for company financials and intelligence, patent databases, and an import and export shipment-level database when trade flows help validate end-market momentum. The sources listed here are illustrative, and many other public references were also reviewed for data collection, validation, and clarification.
Primary Interviews and Surveys
Primary work is used to pressure-test the desk assumptions and close gaps that are not visible in public reporting, such as typical pricing moves, qualification timelines, and mix shifts between discrete devices and integrated modules. We spoke with a mix of component suppliers, module makers, system integrators, and procurement and engineering roles across the main consuming regions, so the inputs reflect real buying patterns and realistic adoption pacing.
Distribution of primary research fieldwork respondents
| Company type | Respondent position | Region |
|---|---|---|
| Top tier: 37% | CXOs: 14% | APAC: 51% |
| Mid tier: 48% | Functional/Unit leaders: 27% | EMEA: 31% |
| Smaller Players: 15% | Managers: 59% | Americas: 18% |
Market-Sizing & Forecasting
The core sizing uses a top-down approach where end-use demand pools are reconstructed from application activity and hardware content, then translated into RF GaN device demand using adoption rates and mix. For RF GaN, the model uses practical inputs such as defense radar and electronic warfare procurement cycles, 5G macro and small-cell rollout pace, satellite payload and ground infrastructure activity, and the device mix split between discrete transistors, MMICs, and power-amplifier modules.
Once demand is framed, revenues are estimated through an ASP x volume logic. ASPs are adjusted by frequency band, power class, and packaging or module complexity, and then checked against what buyers and engineers describe as typical price steps. Results are corroborated with selective bottom-up approximations, including sampled supplier roll-ups, channel checks on module shipments, and sanity checks against reported semiconductor revenue exposure to RF GaN. When a country or niche application has thin visibility, we fill the gap using proxy indicators such as related RF front-end spend and infrastructure build data, and then re-check the implied penetration with experts.
For forecasting, we use scenario analysis supported by a lightweight multivariate regression that links RF GaN demand to the few drivers that consistently explain movement, including defense electronics spending, mobile network capex, and satellite launch cadence. Assumptions are kept consistent across regions through one currency timing convention and an explicit price erosion and mix-improvement curve.
Data Validation & Update Cycle
Validation is done by triangulating the model against independent signals, including region-level infrastructure deployment trends, defense program timing, and visible device shipment or module activity indicators. Outliers are flagged, investigated, and corrected through a second pass that re-checks driver assumptions, conversion factors, and price steps before sign-off.
The work is reviewed in multiple steps so the final numbers are internally consistent across years and regions, and then re-tested when new public disclosures create a meaningful variance. Reports are refreshed annually, and interim updates are triggered if major events change demand, pricing, or supply availability. Before delivery, we run a fresh review so clients receive the latest updated view.
Mordor Intelligence's Rf Gan Market Size Measured Against Other Published Estimates
Published RF GaN market values often differ, even when they describe the same end uses, because analysts do not always count the same device scope or apply the same price and volume logic. Differences also show up when one estimate is anchored to a different base year, or when adoption pacing is assumed to be faster or slower in defense, telecom infrastructure, or satellite programs.
Some external estimates are built from a broader GaN RF devices lens that can pull in adjacent RF device groupings and module categories more liberally. In contrast, Mordor Intelligence counts revenue only when it is clearly tied to RF GaN devices and modules used in RF signal chain functions, keeping non-RF GaN power uses out of the total. The other common gap drivers are how ASP erosion is applied across bands and power classes, how currency conversion timing is set, and how frequently assumptions are refreshed when procurement cycles or network rollouts shift.
Benchmark comparison
| Source | Market Size | Gaps in Research Methodology |
|---|---|---|
| Mordor Intelligence | USD 2.41 B (2026) | |
| Global Consultancy A | USD 2.44 B (2026) | Uses a similar base year, but its scope language appears to include a wider set of RF GaN semiconductor device types and application buckets, which can slightly lift totals when module content is counted more broadly. |
| Industry Publisher B | USD 1.43 B (2024) | Anchored to an earlier year and positioned as a GaN RF devices market, which can understate the later-cycle ramp from 5G infrastructure and newer defense program timing if adoption and ASP steps are not updated to the newer base year. |
The table shows that the spread is mainly explained by scope tightness and base-year alignment, and those two choices ripple through price and adoption assumptions. By keeping the inputs tied to observable deployment and procurement signals, and by re-checking the implied volumes with interviews, our estimate stays traceable to repeatable steps that users can follow and challenge.


Key Questions Answered in the Report
What is the current size and growth outlook for the RF GaN market?
The RF GaN market size reached USD 2.41 billion in 2026 and is poised to grow to USD 5.90 billion by 2031 at a 19.61% CAGR.
Which application segment will expand fastest through 2031?
Satellite communication is expected to post a 20.44% CAGR as LEO constellations scale production.
Why are GaN-on-SiC substrates preferred for high-frequency operation?
SiC offers thermal conductivity triple that of silicon, enabling power densities above 8 W/mm and supporting junction temperatures above 200 °C.
How will export controls affect Chinese participation in RF GaN supply?
Restrictions on devices above 27 GHz and advanced MOCVD tools limit Chinese fabs to older equipment, leading to yield gaps of 15-20% versus Western peers.
Which companies hold the largest share of RF GaN revenue?
Qorvo, Wolfspeed, MACOM Technology Solutions, Broadcom, and NXP Semiconductors together account for about 58% of revenue.
Page last updated on:


 Your data is secure and never sold or shared.


