RF Power Semiconductor Market Size and Share
Market Overview
| Study Period | 2020 - 2031 |
|---|---|
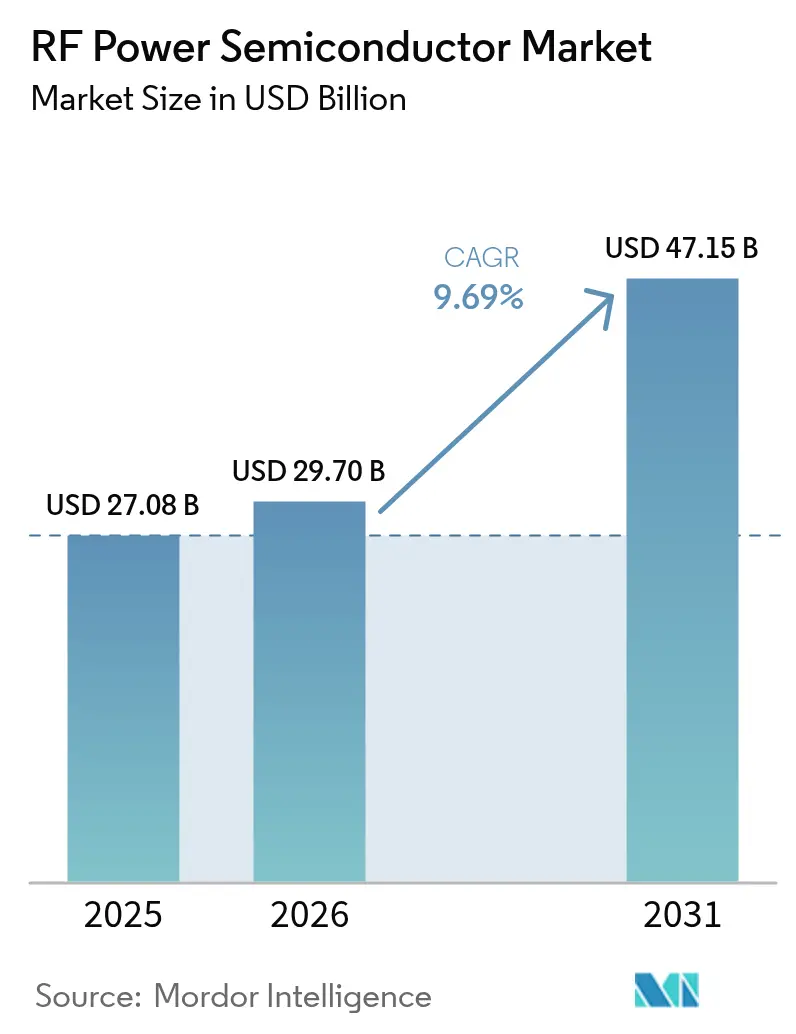
| Market Size (2026) | USD 29.7 Billion |
| Market Size (2031) | USD 47.15 Billion |
| Growth Rate (2026 - 2031) | 9.69% CAGR |
| Fastest Growing Market | South America |
| Largest Market | Asia Pacific |
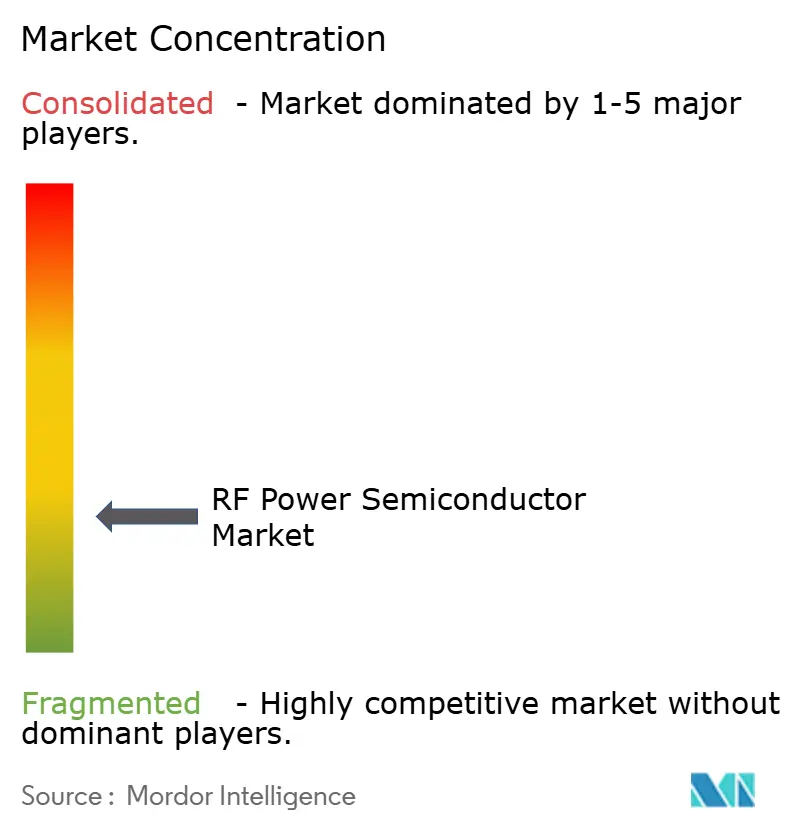
| Market Concentration | Low |
Major Players *Disclaimer: Major Players sorted in no particular order Image © Mordor Intelligence. Reuse requires attribution under CC BY 4.0. | |
RF Power Semiconductor Market Analysis by Mordor Intelligence
The RF power semiconductor market size is expected to grow from USD 27.08 billion in 2025 to USD 29.7 billion in 2026 and is forecast to reach USD 47.15 billion by 2031 at 9.69% CAGR over 2026-2031. Sustained 5G macro-cell densification, higher mobile RF front-end complexity, and early 6G trials continue to lift demand for high-efficiency power amplifiers. GaN-on-SiC devices gain traction above 3 GHz, while incumbent LDMOS remains cost-competitive in sub-6 GHz coverage layers. Emerging industrial solid-state RF heating and plasma tools add a new revenue stream, and private 5G campus networks accelerate infrastructure rollouts for factories and logistics hubs. Export-control headwinds and wafer-level yield challenges temper short-term supply, yet strategic capital investments in the United States and Europe aim to localize production and ease cost barriers.[1]Source: Infineon Technologies AG, “Infineon moves 300 mm GaN-on-Si to volume production,” infineon.com
Key Report Takeaways
- By technology, LDMOS led with 35.40% of RF power semiconductor market share in 2025, whereas GaN is projected to post a 14.58% CAGR to 2031.
- By frequency band, sub-6 GHz held 60.40% revenue in 2025; the 20-40 GHz segment is set to expand at a 13.76% CAGR through 2031.
- By power level, the 10-50 W bracket commanded 37.30% of the RF power semiconductor market size in 2025; devices above 200 W are forecast to grow at 16.10% CAGR.
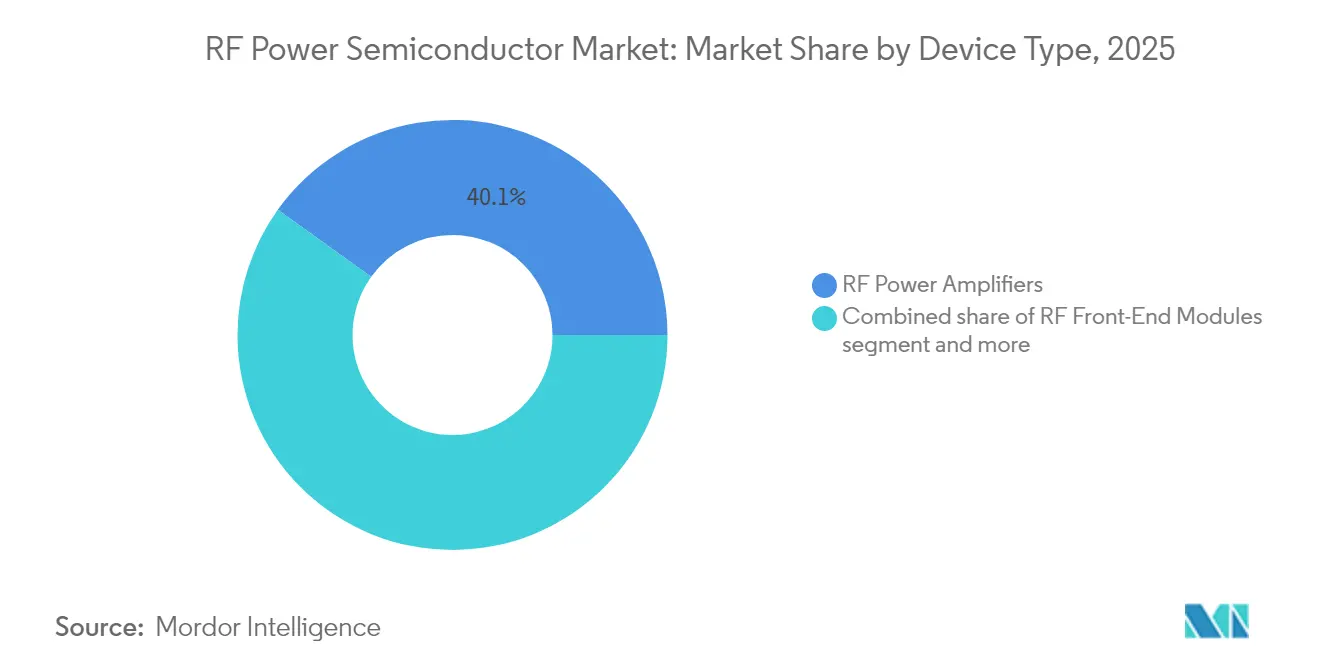
- By device type, RF power amplifiers accounted for 40.10% share in 2025, while RF front-end modules are advancing at a 16.70% CAGR.
- By application, telecom infrastructure captured 47.20% of the market in 2025; satellite communication is the fastest-growing segment at 15.62% CAGR.
Note: Market size and forecast figures in this report are generated using Mordor Intelligence’s proprietary estimation framework, updated with the latest available data and insights as of 2026.
Global RF Power Semiconductor Market Trends and Insights
Drivers Impact Analysis*
| Driver | (~) % Impact on CAGR Forecast | Geographic Relevance | Impact Timeline |
|---|---|---|---|
| 5G macro-cell densification wave | 1.50% | Global, with APAC leading deployment | Medium term (2-4 years) |
| Surge in mobile RF front-end complexity (Wi-Fi 6E/7, UWB, NTN) | 1.20% | North America & EU, expanding to APAC | Short term (≤ 2 years) |
| Rapid GaN adoption for >3 GHz base-stations | 1.80% | Global, concentrated in developed markets | Long term (≥ 4 years) |
| Industrial solid-state RF heating & plasma tools | 0.80% | North America & EU industrial corridors | Medium term (2-4 years) |
| Proliferation of private 5G/6G campus networks | 1.00% | Enterprise hubs in North America, EU, APAC | Long term (≥ 4 years) |
| Automotive RF energy applications expansion | 0.7% | Global, led by North America & EU automotive hubs | Medium term (2-4 years) |
| Source: Mordor Intelligence | |||
5G Macro-Cell Densification Wave
Next-generation macro sites require 3-5 times higher RF power density than 4G to enable massive-MIMO coverage. Vendors now specify GaN-on-SiC amplifiers above 3.5 GHz where LDMOS faces thermal limits. Ericsson’s 2025 AIR 3266 radio delivers 400 W output while cutting energy use by 30%. Elevated power levels push front-end modules toward higher integration and tighter linearity targets, a trend amplified by enterprise private-network rollouts. [2]Ericsson, “AIR 3266 Massive MIMO Radio,” ericsson.com
Surge in Mobile RF Front-End Complexity
Handsets integrate up to 15 bands and support Wi-Fi 7 plus UWB, demanding power amplifiers that keep efficiency across disparate spectra. Qualcomm’s FastConnect 7900 merges Wi-Fi 7, Bluetooth, and UWB on 6 nm, shaving power draw by 40%. Satellite back-up links and automotive V2X further raise spectral overlap, intensifying demand for multi-protocol PA modules.
Rapid GaN Adoption for >3 GHz Base Stations
GaN delivers 2-3 times the power density of silicon LDMOS and tolerates 200 °C junctions, critical for high-band 5G. Infineon’s shift to 300 mm GaN wafers enables 2.3 times more chips per wafer, narrowing the cost delta with silicon. As yield climbs and cost falls 30-40% from 2023 levels, operators migrate new radios to GaN for improved aggregation and 6G readiness.
Industrial Solid-State RF Heating and Plasma Tools
Semiconductors etch platforms such as Applied Materials’ Centura rely on kilowatt-class RF sources with microsecond control. Food safety and EV battery assembly adopt RF heating for uniform thermal profiles, paying premiums for reliability and efficiency that wide-bandgap parts deliver.
Restraints Impact Analysis*
| Restraint | (~) % Impact on CAGR Forecast | Geographic Relevance | Impact Timeline |
|---|---|---|---|
| High die cost & wafer-level yield challenges | -1.40% | Global, particularly affecting GaN production | Medium term (2-4 years) |
| Export-control headwinds on wide-bandgap devices | -0.80% | China, Russia, with spillover effects globally | Long term (≥ 4 years) |
| Thermal / packaging limits above 40 GHz | -0.60% | Global, affecting mmWave applications | Short term (≤ 2 years) |
| Fab capacity tightness for SiC/GaN epi-wafers | -1.00% | Global, concentrated in specialized fabs | Medium term (2-4 years) |
| Source: Mordor Intelligence | |||
High Die Cost and Wafer-Level Yield Challenges
GaN-on-SiC yields remain 60-70% versus 85-90% for silicon. Wolfspeed’s Mohawk Valley plant reported 20% wafer-start utilization in early 2024, illustrating the gradual ramp toward cost parity. Substrate scarcity and complex epitaxy keep die prices 3-5 times higher than LDMOS, limiting GaN’s reach in cost-sensitive devices.
Export-Control Headwinds on Wide-Bandgap Devices
Tighter U.S. controls on GaN and SiC gear have spurred China to curb gallium exports, a move that could trim USD 3.4 billion from U.S. GDP if fully enforced. Dual supply chains now form, reducing scale economies and raising risk for globally integrated OEMs.[3]U.S. Geological Survey, “Critical Mineral Dependencies: Gallium and Germanium,” usgs.gov
*Our forecasts treat driver/restraint impacts as directional, not additive. The impact forecasts reflect baseline growth, mix effects, and variable interactions.
Segment Analysis
By Technology: GaN Disrupts LDMOS Dominance
The RF power semiconductor market size for technology segmentation stood at USD 27.08 billion in 2025, with LDMOS contributing 35.40% revenue. GaN’s 14.58% CAGR through 2031 reflects its superior power density at >3 GHz, while GaAs retains niches in ultra-low-noise links. Infineon’s roadmap signals mass-market GaN adoption across telecom and EV powertrains.
Growth momentum centers on sub-6 GHz coverage where LDMOS offers low cost. Yet every new high-band site favours GaN, accelerating a dual-technology landscape. MACOM’s USD 345 million upgrade to 100 mm and 150 mm GaN lines under the CHIPS Act underscores industry efforts to localize wide-bandgap supply. As yields improve, GaN’s share could overtake LDMOS in new macro-radio deployments by 2028.


By Frequency Band: Sub-6 GHz Leads Despite mmWave Growth
Sub-6 GHz held 60.40% of RF power semiconductor market share in 2025, riding nationwide 5G rollouts. The 20-40 GHz slice is poised for a 13.76% CAGR as operators trial 6G and LEO constellations tap Ku-band windows.
System designers now demand amplifiers spanning multiple bands to simplify inventory. NXP’s Airfast portfolio offers 41% PAE across 3.6-3.8 GHz, cutting component counts. Above 40 GHz, use cases remain specialized, yet defence radar and backhaul links sustain steady demand. Multiband capability will be a decisive spec in the next upgrade cycle.
By Power Level: Mid-Range Dominates Infrastructure
The 10-50 W class accounted for 37.30% of 2025 revenue, matching sector-average price points and thermal envelopes. Units above 200 W are the fastest growers, projected at 16.10% CAGR as massive MIMO and high-throughput satellites widen coverage targets. Ericsson’s AIR 3266 shows 400 W systems can still curb energy use through GaN efficiency.
Small-cell layers under 10 W focus on footprint. Rural fill-in radios in the 50-200 W band bridge cost and reach. Across tiers, designers pursue 60-70% efficiency, a benchmark achievable with GaN but rarely with LDMOS. The resulting power-level mix reinforces GaN’s climb in capacity-driven deployments.
By Device Type: Integration Drives Module Growth
Discrete RF power amplifiers retained 40.10% revenue in 2025. Front-end modules are growing 16.70% per year as OEMs shrink boards and optimize thermal paths. MediaTek’s adoption of Qorvo Wi-Fi 7 FEMs for its Dimensity 9400 SoC highlights the lean hardware trend.
Switches, tuners, filters, and multiplexers underpin massive-MIMO arrays that need microsecond beam steering. Higher isolation and ruggedness lift GaN switches into radar and satcom line-ups. Integrated module shipments are expected to surpass discrete PAs by 2029 as spectrum aggregation demands tight impedance control.
By Application: Telecom Infrastructure Leads Growth
Telecom infrastructure formed 47.20% of revenue in 2025, making it the anchor of the RF power semiconductor industry. Satellite communication shows the highest upside at 15.62% CAGR, driven by LEO constellations and hybrid 5G-sat backhaul. MACOM’s high-power opto-amps exemplify optical-satellite data links seeking compact high-gain RF engines.
Aerospace-defense remains steady, favouring high-reliability specs. Wireline broadband upgrades to DOCSIS 4.0 require linear broadband PAs up to 1.8 GHz. Industrial and automotive RF energy, from plasma tools to EV battery curing, opens niche volumes at premium ASPs.
Geography Analysis
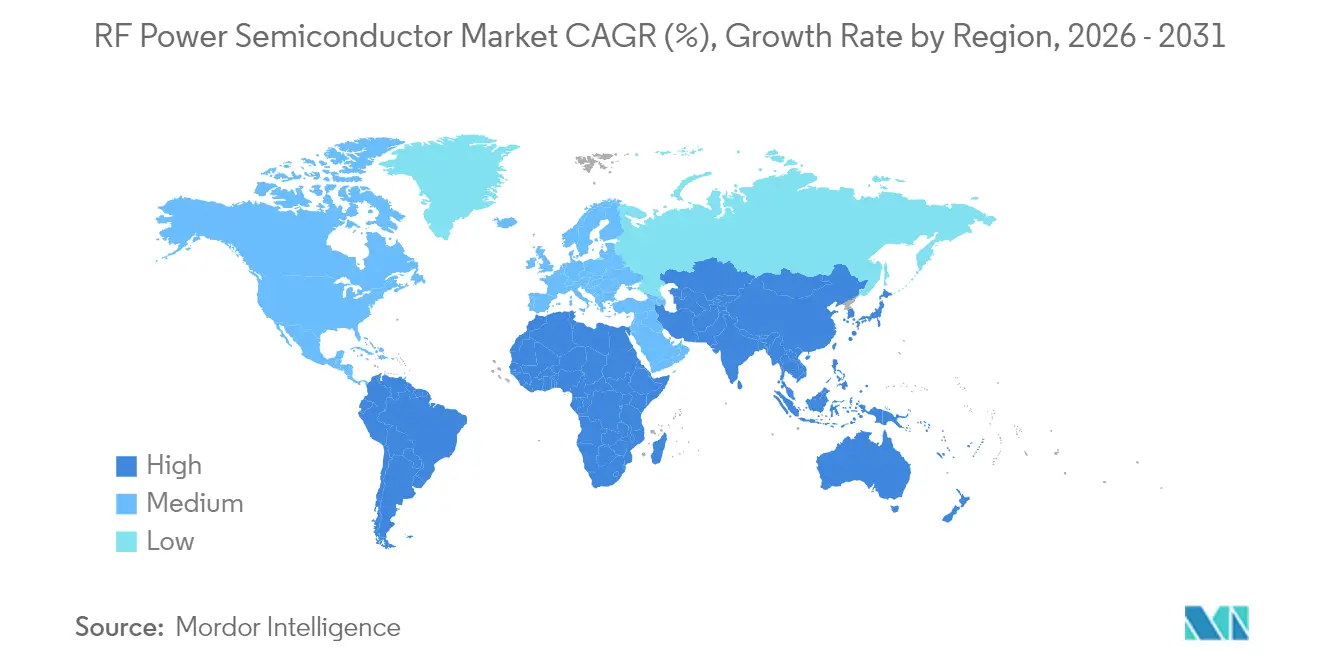
Asia-Pacific dominated the RF power semiconductor market with a 44.20% revenue share in 2025 on the back of China’s rapid 5G construction and South Korea’s mmWave pilots. Chinese researchers recently cut GaN defect densities, an advance that may lift local yields and temper import reliance. Japan contributes specialty compound processes for automotive and industrial fields. Regional expansions in private networks across manufacturing clusters propel mid-range power device demand.
North America and Europe display technology-driven growth. Operators now retrofit 4G macro grids with energy-saving GaN PAs, while federal incentives such as the U.S. CHIPS Act bankroll domestic fabs. MACOM expects up to USD 70 million in direct funding to modernize Massachusetts and North Carolina sites. Defense primes in both regions require radiation-hardened GaN parts, fostering premium sub-segments shielded from consumer price swings.
South America posts the fastest 12.95% CAGR through 2031. Brazil’s BRL 47 billion spectrum auction earmarked BRL 42 billion for network buildouts that prioritize 5G-ready gear. Rural broadband gaps in Argentina and mining automation in Chile elevate demand for long-reach sub-6 GHz PAs. Middle East and Africa see selective adoption, with satellite backhaul filling coverage voids and government digitization programs stimulating modest but consistent volumes.

Regulatory Landscape
RF power semiconductors fall under radio equipment compliance regimes that emphasize EMC, spurious emissions, and RF safety at the end-product level, which shapes design and test requirements for RF front ends and power amplifiers. In the United States, 47 CFR Part 15 governs radio frequency devices, while the FCCs equipment authorization framework is tightening on supply-chain integrity, highlighted by the FCCs Equipment Authorization Integrity NPRM adopted in August 2025 to strengthen oversight of Telecommunications Certification Bodies and test laboratories.
Security and procurement rules increasingly influence component selection and sourcing for telecom and defense-adjacent RF platforms. In February 2026, the FAR Council issued a proposed rule to implement NDAA FY2023 prohibitions related to covered semiconductor products and services (with compliance timelines extending to late 2027), which would add diligence and reporting burdens for suppliers selling into US federal procurement. Separately, FCC actions in July 2026 restricting the importation and marketing of certain previously authorized communications equipment listed as national security risks reinforce the move toward lifecycle assurance and origin transparency in the RF hardware supply chain, and in Europe the Radio Equipment Directive (Directive 2014/53/EU) and related delegated acts remain a core compliance anchor for radio equipment placed on the EU market.
Value Chain Analysis
The value chain starts with specialty raw materials and substrates (Si, GaAs, SiC, and epitaxial wafers for GaN-on-Si and GaN-on-SiC), then moves through device design (discrete transistors, MMICs, and RF front-end modules), wafer fabrication, and advanced packaging and test to support high-frequency and high-power reliability. Compared with silicon LDMOS, compound semiconductor flows depend on narrower supplier bases for substrates and epitaxy, with capacity and qualification concentrated among specialized players, which increases sensitivity to export controls and tool availability for wide-bandgap processes.
Manufacturing is also bifurcating by platform: high-performance RF (notably GaN-on-SiC for telecom radios above 3 GHz, radar, and satcom) remains tied to compound semiconductor supply chains, while scale-oriented GaN-on-Si is migrating toward 200 mm silicon foundry infrastructure to improve cost and availability. This is visible in efforts to industrialize RF-relevant GaN-on-Si processes, including Finwave Semiconductors August 2024 collaboration with GlobalFoundries in Burlington, Vermont, to scale GaN-on-Si E-mode technology, and Polar Semiconductors April 2025 agreement with Renesas to license GaN-on-Si for 200 mm onshore fabrication in Minnesota. Downstream, RF power semiconductors are sold directly to OEMs and through distributors, with qualification cycles shaped by telecom infrastructure, satellite, defense, and industrial RF energy end markets, where long lifecycle support and assured supply increasingly affect vendor choice.
Competitive Landscape
The RF power semiconductor market shows moderate fragmentation. NXP, Qorvo, and Infineon leverage vertical integration from epitaxy to packaging, allowing full-stack optimization across power and frequency bands. Infineon’s 300 mm GaN program yields 2.3 times more die per wafer, edging close to silicon cost curves and strengthening its bargaining power with base-station OEMs.
Investment momentum underscores supply-chain realignment. MACOM budgets USD 345 million for GaN and GaAs expansion, partly underwritten by CHIPS incentives. Qorvo partners with MediaTek for Wi-Fi 7 FEMs, cementing a foothold in handset sockets. White-space entrants target kilowatt-class industrial PAs, a segment relatively underserved by telecom-centric incumbents.
Geopolitical frictions shape strategy. Export controls restrict Chinese access to advanced epi tools, prompting parallel supply chains. Western firms accelerate onshore fabs, while Chinese vendors pursue indigenized GaN processes to skirt restrictions. Patent activity centers on thermal management and monolithic integration, signalling that differentiation will hinge on reliability as much as raw efficiency.
RF Power Semiconductor Industry Leaders
Qorvo, Inc.
NXP Semiconductors N.V.
Qualcomm Incorporated
Infineon Technologies AG
Broadcom Inc.
- *Disclaimer: Major Players sorted in no particular order

Market Opportunities and Future Outlook
White space is emerging for RF power devices that pair higher efficiency with tighter linearity and thermal robustness, particularly as networks increase massive MIMO power density and as early 6G-adjacent research explores new bands. Fujitsus March 2026 disclosure of a GaN-based power amplifier achieving 74.3% power efficiency at 8 GHz, a candidate band in 6G FR3 discussions, points to demand for advanced GaN device and packaging stacks that can sustain efficiency at higher frequencies.
Industrial and automotive RF energy is also an underpenetrated demand pool for RF power semiconductors beyond telecom-centric cycles, with products moving toward kilowatt-class operation and ruggedized reliability. Ampleons June 2026 launch of a 1.6 kW-class GaN-SiC HEMT transistor targeted at industrial RF heating and particle accelerators illustrates expanding commercial emphasis on high-power RF components, along with matching, cooling, and control ecosystems. On the supply side, capital formation and manufacturing reconfiguration can create room for qualified second sources and more localized supply chains: Infineons July 2026 opening of its Smart Power Fab in Dresden (EUR 5 billion investment) and onsemi's July 2026 divestment of legacy fabs as part of its Fab Right strategy both highlight active portfolio shifts that can affect availability, lead times, and qualification approaches for RF-adjacent power device families.
Recent Industry Developments
- July 2026: Qorvo signed a distribution agreement with Rochester Electronics to provide long-term lifecycle support for selected RF and power product families. This move targets obsolescence and sustainment needs in long-life programs such as aerospace, defense, and industrial infrastructure, while strengthening Qorvos channel coverage for legacy and extended-support demand.
- January 2026: NXP Semiconductors confirmed a strategic exit from the 5G RF power amplifier market and initiated the wind-down of its ECHO GaN fabrication facility in Chandler, Arizona, with operations scheduled to cease in Q1 2027. The decision shifts competitive dynamics for telecom RF PAs by narrowing the field of suppliers for certain 5G infrastructure sockets and prompts OEMs to reassess multi-sourcing and qualification roadmaps.
- August 2024: Finwave Semiconductor partnered with GlobalFoundries to scale GaN-on-Si E-mode MISHEMT technology toward volume production at GlobalFoundries Burlington, Vermont site. Advancing GaN-on-Si on a mainstream foundry platform supports higher-volume manufacturing pathways for RF-relevant devices and can lower barriers for customers that prioritize U.S.-based supply and scalable capacity.


Research Methodology Framework and Report Scope
Market Definition and Coverage
This market covers revenue generated from RF power semiconductor devices that amplify or switch radio frequency signals in wireless infrastructure, defense radar and electronic warfare, satellite links, industrial RF energy systems, and other RF power chains.
Scope exclusions: We exclude passive RF components (filters, duplexers, and antennas) and discrete non-RF power semiconductors used only for DC power conversion.
Segmentation Overview
- By Technology
- LDMOS
- GaAs
- GaN
- Si (Other)
- By Frequency Band
- Sub-6 GHz
- 6 - 20 GHz
- 20 - 40 GHz
- More than 40 GHz (mmWave)
- By Power Level
- Less than 10 W
- 10 - 50 W
- 50 - 200 W
- More than 200 W
- By Device Type
- RF Power Amplifiers
- RF Front-End Modules
- RF Switches / Tuners
- RF Filters and Multiplexers
- By Application
- Telecom Infrastructure
- Aerospace and Defense
- Wired Broadband
- Satellite Communication
- Industrial and Automotive RF Energy
- Geography
- North America
- United States
- Canada
- Mexico
- Europe
- United Kingdom
- Germany
- France
- Italy
- Rest of Europe
- Asia-Pacific
- China
- Japan
- India
- South Korea
- Rest of Asia
- Middle East
- Israel
- Saudi Arabia
- United Arab Emirates
- Turkey
- Rest of Middle East
- Africa
- South Africa
- Egypt
- Rest of Africa
- South America
- Brazil
- Argentina
- Rest of South America
- North America
Data Sources, Market Sizing, and Validation
Desk Research
To set a clean starting point, we built a fact base using RF deployment indicators and electronics output, then aligned it with how RF power semiconductors are supplied and consumed. Public sources used included International Telecommunication Union (ITU) materials for network indicators, the US FCC for spectrum and licensing signals, UN Comtrade for trade flows in relevant semiconductor categories, and World Semiconductor Trade Statistics (WSTS) for broad semiconductor demand direction.
We also reviewed company annual reports and investor decks to understand RF device mix, end market exposure, and major capacity moves, along with press releases and reputable electronics media for product transition timing (for example, GaN adoption versus LDMOS in sub-6 GHz applications). A paid subscription for company financials and a patent database were used to cross-check revenue splits and technology focus when public disclosures were thin. The desk sources listed here are illustrative only, and many other public documents were also used for data collection, validation, and clarification.
Primary Interviews and Surveys
Primary work focused on aligning the model to what is shipping and being designed in, rather than only what is announced. We spoke with device makers, module and subsystem suppliers, and buyers from telecom infrastructure, aerospace and defense programs, and industrial RF heating and plasma equipment to confirm technology mix, typical pricing movement, and qualification cycles across regions.
Distribution of primary research fieldwork respondents
| Company type | Respondent position | Region |
|---|---|---|
| Top tier: 28% | CXOs: 16% | APAC: 46% |
| Mid tier: 52% | Functional/Unit leaders: 31% | EMEA: 30% |
| Smaller Players: 20% | Managers: 53% | Americas: 24% |
Market-Sizing & Forecasting
Market sizing was built using a top-down approach where wireless infrastructure spending signals, base station build intensity, radar and satcom procurement cues, and industrial RF equipment shipments are translated into an RF power semiconductor demand pool by applying typical semiconductor content and adoption rates. The totals were then checked with selective bottom-up approximations, including sampled average selling prices multiplied by estimated unit volumes for key device classes, and supplier and channel checks to see if the implied shipments looked realistic.
Inputs used in the model included 5G macro and small-cell rollout pace, spectrum activity and band mix (sub-6 GHz versus higher bands), GaN versus LDMOS penetration by use case, typical power levels and frequency needs in radar and satcom, and observed pricing shifts tied to yield learning and substrate availability. Where a bottom-up view was incomplete (for example, for captive supply or for defense volumes that are not consistently disclosed), we filled gaps using proxy indicators like program cadence and regional deployment intensity, and then normalized results back to the demand pool.
For forecasting, scenario analysis was used to reflect different rollout and procurement paths, and each scenario was anchored to interview-based expectations on technology transitions and realistic ASP movement. Final numbers were expressed in nominal USD, with currency timing and inflation assumptions kept consistent across the time series.
Data Validation & Update Cycle
Outputs are validated through triangulation across independent signals, so any single series does not overly drive the result. We run variance checks across regions and end uses, review year over year jumps against known events like export controls, large spectrum auctions, and major program awards, and then do a second analyst review before sign-off.
The model is refreshed annually, and interim updates are triggered when material shifts occur, such as rapid pricing resets, large capacity additions, or a step change in wireless deployment plans. Before delivery, an analyst makes a final pass to capture the latest public disclosures and news flow so clients receive an updated view tied to the same repeatable steps.
Mordor Intelligence's Rf Power Semiconductor Market Size Measured Against Other Published Estimates
Published estimates for this market can look far apart even when they are all talking about RF power devices, because they often mix different product baskets and do not treat adjacent RF content the same way. Differences also come from the year selected as the anchor, how pricing is carried forward, and how quickly assumptions are refreshed when a technology shift speeds up or slows down.
Passive RF components like filters and duplexers sit outside Mordor Intelligence's scope, which is a major reason some public figures appear higher or lower depending on whether those items are bundled with RF power devices or counted separately.
Benchmark comparison
| Source | Market Size | Gaps in Research Methodology |
|---|---|---|
| Mordor Intelligence | USD 27.08 B (2025) | |
| Global Consultancy A | USD 22.66 B (2024) | Uses an earlier anchor year and a broader device grouping by type that can pull in non-power RF building blocks, and it can also apply different assumptions on infrastructure build timing across regions. |
| Industry Publisher B | USD 6.52 B (2025) | Often narrows the counted market to specific RF power transistor or high power device categories, which excludes parts of the RF power IC and module value that is included in wider device level definitions. |
Across the three figures, the spread mainly comes from what is counted as an RF power device versus adjacent RF content, and from how the base year and pricing path are handled. By tying the total to clear demand indicators like network rollouts and defense and industrial RF equipment activity, and then cross-checking with sampled ASP times volume math, the estimate stays traceable and repeatable when assumptions need to be revisited.


Key Questions Answered in the Report
What is the current RF power semiconductor market size and its expected growth?
The RF power semiconductor market size reached USD 29.7 billion in 2026 and is projected to rise to USD 47.15 billion by 2031 at a 9.69% CAGR.
Which technology segment is growing fastest?
GaN devices are expanding at a 14.58% CAGR, outpacing LDMOS as operators move above 3 GHz and seek higher power density.
How important are private 5G networks for future demand?
Private 5G and early 6G campus deployments lift medium-power amplifier volumes, especially for indoor coverage and industrial IoT use cases.
Why do high die costs restrain GaN adoption?
GaN-on-SiC yields remain 60-70%, keeping die prices 3-5 times higher than silicon LDMOS and slowing uptake in cost-sensitive products.
Which region is growing the quickest?
South America leads with a 12.95% CAGR to 2031, driven by Brazil’s large-scale 5G spectrum commitments and network modernization.
How are export controls affecting the market?
U.S. restrictions on GaN and SiC tools encourage parallel supply chains, raising costs and prompting domestic investment to secure material flows.
Page last updated on:


