
RF Test Equipment Market Size and Share
Market Overview
| Study Period | 2020 - 2031 |
|---|---|
| Market Size (2026) | USD 4.27 Billion |
| Market Size (2031) | USD 5.79 Billion |
| Growth Rate (2026 - 2031) | 6.28 % |
| Fastest Growing Market | Asia Pacific |
| Largest Market | North America |
| Market Concentration | Medium |
Major Players
*Disclaimer: Major Players sorted in no particular order Image © Mordor Intelligence. Reuse requires attribution under CC BY 4.0. |
|

RF Test Equipment Market Analysis by Mordor Intelligence
The RF test equipment market size is estimated at USD 4.27 billion in 2026 and is projected to reach USD 5.79 billion by 2031, reflecting a 6.28% CAGR across the forecast period. Expansion is rooted in millimeter-wave 5G roll-outs above 24 GHz, rising automotive radar deployments at 77-81 GHz, and the maturation of Ka-band low-earth-orbit satellite links. China’s 4.76 million commercial 5G base stations, 40% of which employ massive-MIMO arrays, continue to anchor sub-6 GHz demand while simultaneously stimulating over-the-air chamber sales for FR2 validation. Europe’s Release 19 specifications, finalized in December 2025, shortened refresh cycles for benchtop analyzers to under 12 months, hastening platform obsolescence. North America benefits from spectrum revenues that mandate interference tests in the 3.7-3.98 GHz C-band, whereas Asia Pacific leads the shift toward 26 GHz and 28 GHz private 5G networks for manufacturing.
Key Report Takeaways
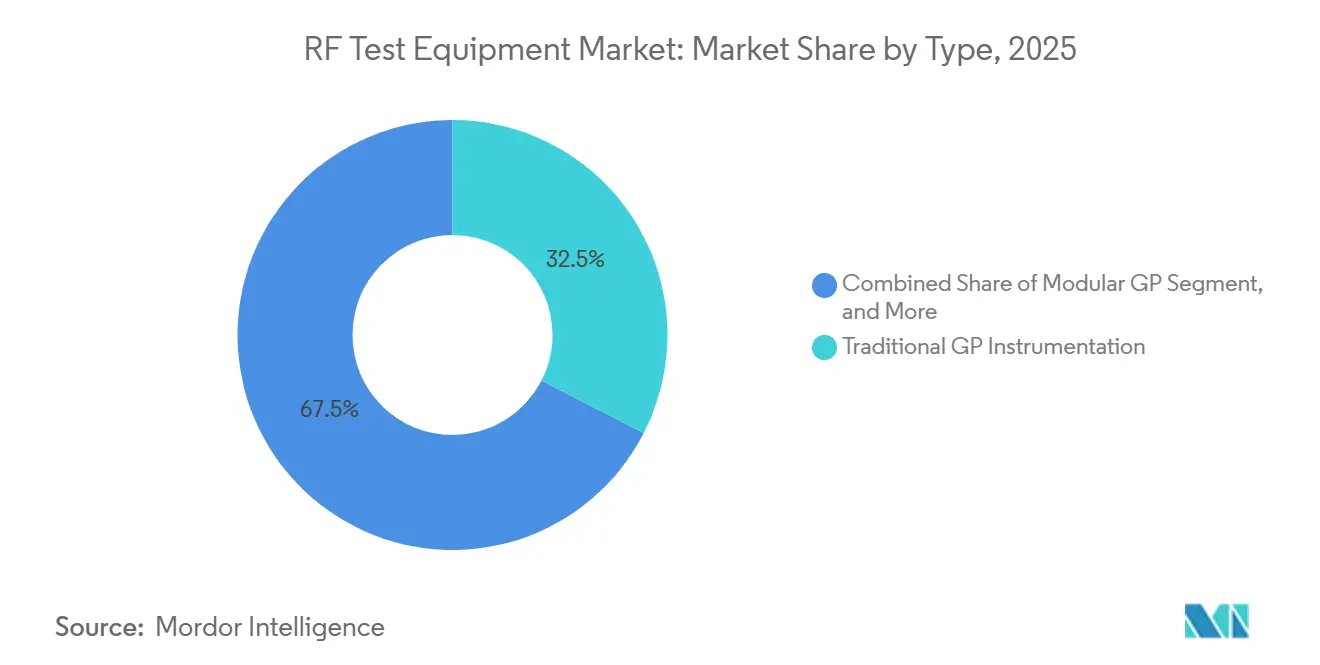
- By Type, traditional GP instrumentation accounted for 32.54% of revenue share in 2025, whereas modular GP instrumentation is advancing at a 7.83% CAGR through 2031.
- By form factor, benchtop instruments accounted for 35.13% of revenue share in 2025, whereas modular platforms are projected to expand at an 8.12% CAGR through 2031.
- By frequency range, the 1-6 GHz captured 55.12% of the RF test equipment market share in 2025, while the above-6 GHz tier is advancing at an 8.53% CAGR through 2031.
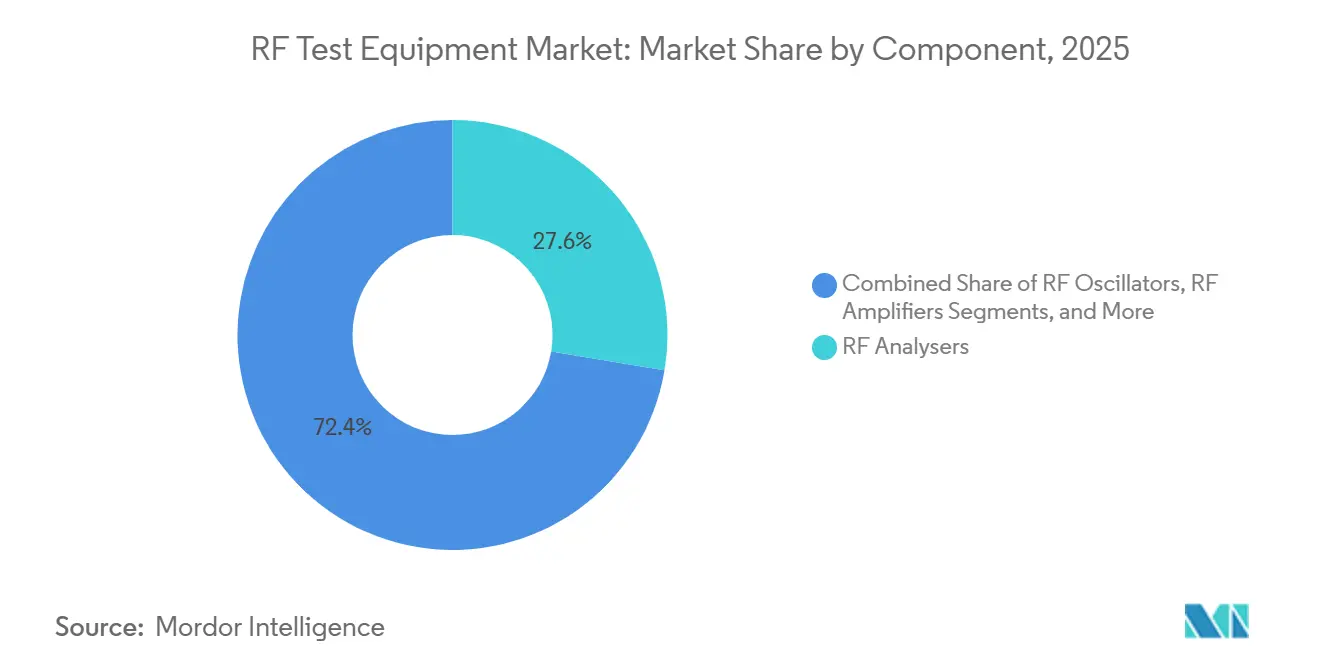
- By component, RF Analysers led the RF test equipment market with 27.63% of the market share in 2025, and RF Amplifiers are growing at a 7.31% CAGR through 2031.
- By end-user industry, telecommunications accounted for 38.13% revenue share in 2025, while automotive is forecast to record the fastest 8.04% CAGR through 2031.
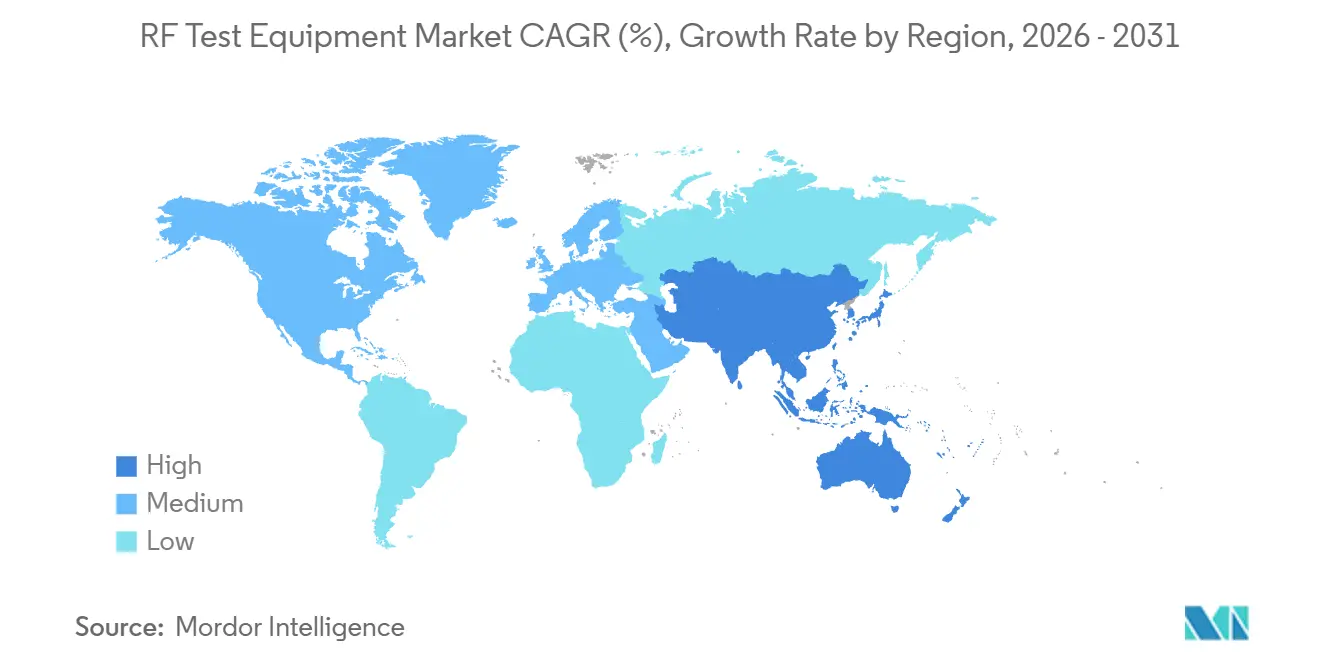
- By geography, North America commanded 36.01% of 2025 revenue, and Asia Pacific is on track for the quickest 7.64% CAGR over the forecast window.
Note: Market size and forecast figures in this report are generated using Mordor Intelligence’s proprietary estimation framework, updated with the latest available data and insights as of January 2026.
Global RF Test Equipment Market Trends and Insights
Drivers Impact Analysis*
| Driver | (~) % Impact on CAGR Forecast | Geographic Relevance | Impact Timeline |
|---|---|---|---|
| Surge in mmWave 5G Roll-outs Requiring >24 GHz Validation | +1.8% | Global, with concentration in North America, China, South Korea | Medium term (2-4 years) |
| Proliferation of Massive-MIMO Base-Stations in East Asia | +1.4% | Asia Pacific core, spillover to Europe and Middle East | Medium term (2-4 years) |
| Automotive RADAR and ADAS Test Demand Across Germany and Japan | +1.2% | Europe (Germany, France, Italy) and Asia Pacific (Japan, South Korea) | Long term (≥4 years) |
| Satellite LEO Constellation Build-outs Driving Ka-Band Tests | +0.9% | Global, early gains in United States, Luxembourg, United Kingdom | Long term (≥4 years) |
| Miniaturised IoT Chipsets Boosting Hand-held RF Analysers | +0.6% | Asia Pacific manufacturing hubs, North America design centers | Short term (≤2 years) |
| Emergence of Cloud-Connected, AI-Enhanced Remote Test Labs | +0.7% | North America and Europe, pilot deployments in India and Brazil | Medium term (2-4 years) |
| Source: Mordor Intelligence | |||
Surge in mmWave 5G Roll-outs Requiring >24 GHz Validation
Global regulators are clearing FR2 spectrum between 24.25 GHz and 40 GHz, which forces operators to migrate from conducted tests to over-the-air chambers that mimic field conditions. SK Telecom tripled its 28 GHz base-station footprint in 2025, and each site requires harmonic measurements up to 50 GHz. Instrument vendors therefore integrate gallium-nitride amplifiers, active cooling, and multi-probe positioning systems to cope with heat densities above 150 W/cm². Instruments capable of continuous operation at these frequencies now command price premiums of USD 8,000-12,000 per unit. Vendors that optimize portability without sacrificing thermal stability stand to capture disproportionate share in the high-frequency tier.
Proliferation of Massive-MIMO Base-Stations in East Asia
China and Japan are adopting 64T64R and 128T128R antenna modules, increasing test complexity by 40% compared with single-input single-output setups. Comprehensive spatial-channel emulation drives demand for automated positioners and multi-probe chambers priced between USD 500,000 and 1.2 million. The duopoly of certified chamber suppliers, combined with Release 19 specifications for MIMO over-the-air tests, lengthens procurement lead times to nine months.[1]3rd Generation Partnership Project, “Release 19 Specifications,” 3GPP.org Centralized regional labs now pool capital for these assets to offset cost overheads.
Automotive RADAR and ADAS Test Demand Across Germany and Japan
The switch from 24 GHz to 77-81 GHz sensors forces automotive OEMs to retire legacy benches. Germany’s March 2025 guidelines mandate radar-target simulators that emulate 200-meter pedestrian cross-sections and 150 km/h closing speeds. Japan’s JPY 12 billion (USD 80 million) subsidy pot accelerates ADAS lab expansions in Aichi and Shizuoka. Precision timing between LiDAR and radar streams must stay within 10 ns, pushing oscilloscope vendors to embed rubidium references. High-spec echo generators, such as Anritsu’s USD 95,000 AREG800A, are gaining traction among tier-1 suppliers.
Satellite LEO Constellation Build-outs Driving Ka-Band Tests
Starlink Gen-3 and OneWeb Gen-2 payloads rely on downlinks at 17.8-20.2 GHz and uplinks at 27.5-30 GHz, with stringent 0.5 dB interference masks. Ground stations therefore require analyzers boasting trigger-to-display latencies below 10 µs. Amazon’s Project Kuiper contracted USD 120 million of portable Ka-band analyzers for remote launch sites, illustrating new ruggedization requirements. As fleets exceed thousands of satellites, in-orbit anomaly diagnosis will outstrip pre-launch qualification, favoring cloud-connected telemetry solutions that correlate orbital data with terrestrial measurements.
Restraints Impact Analysis*
| Restraint | (~) % Impact on CAGR Forecast | Geographic Relevance | Impact Timeline |
|---|---|---|---|
| Rapidly Evolving ETSI and 3GPP Standards Creating Obsolescence | -1.1% | Global, acute in Europe and Asia Pacific | Short term (≤2 years) |
| Form-Factor Heat-Dissipation Challenges Above 40 GHz | -0.5% | Global, concentrated in mmWave deployments | Medium term (2-4 years) |
| Skilled RF-Test Engineering Talent Shortage in Nordics | -0.4% | Europe (Sweden, Norway, Finland), spillover to North America | Long term (≥4 years) |
| High Cap-Ex Versus Rental Preference in South America | -0.6% | South America (Brazil, Argentina, Chile), emerging in Africa | Medium term (2-4 years) |
| Source: Mordor Intelligence | |||
Rapidly Evolving ETSI and 3GPP Standards Creating Obsolescence
The December 2025 freeze of Release 19 and the scheduled mid-2027 freeze of Release 20 collapse the historical four-year amortization window to two years. Equipment that lacks modular, field-upgradeable RF front-ends risks premature retirement, evidenced by a Chinese OEM’s USD 3.2 million write-off of Release 17-only gear. Although platform providers now swap signal-processing cards to extend service lives, modularity adds 15-20% to upfront cost, a premium budget-conscious labs resist. Frequent firmware validation cycles further inflate operating expense for accredited certification houses.
Form-Factor Heat-Dissipation Challenges Above 40 GHz
Continuous-wave measurements at 50-70 GHz generate localized heat fluxes that exceed forced-air cooling limits. Instruments must integrate micro-channel liquid loops or gallium-nitride driver stages, raising bill-of-materials costs by USD 6,000-10,000 per chassis. Portable analyzers cannot accommodate these thermal solutions, restricting duty cycles to 60% and constraining field work. Vendors face design trade-offs between portability and thermal headroom, delaying mass adoption in resource-constrained regions.
*Our forecasts treat driver/restraint impacts as directional, not additive. The impact forecasts reflect baseline growth, mix effects, and variable interactions.
Segment Analysis
By Type: Modular Platforms Gain Share
Traditional general-purpose instrumentation accounted for 32.54% of 2025 revenue, anchored in aerospace, defense, and university labs that value NIST-traceable calibration and phase-noise floors below -135 dBc/Hz at a 10 kHz offset. Keysight’s N9000B CXA and Rohde & Schwarz’s FSW families exemplify this tier, offering dynamic ranges above 120 dB that remain unmatched for radar cross-section work and satellite-transponder characterization. Modular general-purpose instrumentation, however, is advancing at a 7.83% CAGR to 2031 as telecom and automotive buyers embrace software-defined architectures that can be reconfigured remotely. National Instruments’ PXI chassis, which generated 28% of the company's revenue in 2025, lets users hot-swap RF front-ends over PCIe backplanes, shrinking changeover time from days to hours when migrating from sub-6 GHz to millimeter-wave cases.
Rental general-purpose instrumentation is emerging as a viable option in cash-constrained regions. Brazil’s Anatel noted that 72% of new 5G test placements in August 2025 were financed through operating leases, up from 48% in 2023, allowing integrators to swap Release 18 hardware for Release 19 mid-contract. This model puts pressure on OEM margins because lessors demand 25% volume discounts while absorbing obsolescence risk. Semiconductor automated test equipment, dominated by Advantest’s V93000 wafer-probe platform, remains cyclical, tied to fab-capacity additions that slowed in 2025 amid consumer-electronics inventory corrections. Legacy analog signal generators and power meters continue to decline as digital alternatives collapse multiple functions into a single chassis. Given current velocity, modular solutions could represent the majority of new placements in telecom and automotive labs by 2028, nudging vendors toward subscription revenue and cloud-native orchestration that supports multi-site instrument sharing.



By Form Factor: Portability Meets Precision
Modular rack-mount systems are expanding at an 8.12% CAGR because operators deploy dense test nodes in cell-site hotels, where remote access and 19-inch rack compatibility outweigh raw speed. Keysight’s M9384B VXG, a three-slot PXI generator introduced in April 2025, matches benchtop phase noise within 1 dB while occupying only one-fifth the space, enabling 12 measurement functions in a single enclosure. Benchtop boxes still accounted for 35.13% of 2025 revenue, supported by defense labs that demand a 120 dB dynamic range to 110 GHz. Portable analyzers such as Anritsu’s Field Master Pro and RIGOL’s DSA800E are well-suited for rooftop surveys and interference hunting, where 15 kg benchtop units are impractical. Release 19’s over-the-air specification, TS 38.141-2, mandates handheld reference receivers for base-station turn-up, creating a regulatory floor for this segment.[2]3rd Generation Partnership Project, “Release 19 Specifications,” 3GPP.org
Thermal engineering drives the cost of ownership. Benchtop analyzers rely on forced-air cooling to sustain continuous duty above 40 GHz, whereas handheld devices use passive heat sinks that cap duty cycle at 60%, extending automotive radar tests by 40%. Modular racks incorporate mezzanine liquid loops for 24/7 operation in central offices, and ETSI rack dimensions ensure global installability. Rohde & Schwarz devoted 40% of its 2025 R&D budget to modular design, signaling faith that rack density will trump benchtop precision in volume segments like Open RAN validation. The bifurcation forces suppliers to maintain parallel product lines: high-accuracy benchtops for space and defense, and modular PXI for telecom and automotive, complicating inventory management and channel incentives.
By Frequency Range: mmWave Ascendancy
Above-6 GHz products are advancing at an 8.53% CAGR, fastest among all tiers, as operators certify FR2 spectrum and satellite gateways move toward Ku- and Ka-band links that need 56 GHz harmonic measurements without external mixers. South Korea’s February 2025 auction of 28 GHz licenses accelerated vector network analyzer demand for beamforming arrays validated from -40 °C to +85 °C per TS 38.101-4. The 1-6 GHz tier still accounted for 55.12% of the market share in 2025, thanks to LTE and Wi-Fi 6, especially in emerging markets where ≤3.5 GHz delivers rural reach. Sub-1 GHz IoT bands continue steady but margin-tight growth as RIGOL and Siglent undercut Western prices by up to 45%.
A move from conducted to over-the-air testing above 24 GHz raises capital needs: anechoic chambers and multi-probe arrays cost USD 400,000-1.5 million, concentrating purchases among tier-1 operators and OEMs. The FCC’s November 2025 decision to open the 12.7-13.25 GHz band for next-gen Wi-Fi blurs the boundaries between satellite and cellular, creating a mid-band niche for dual-service analyzers. Above 40 GHz, GaN amplifiers replace GaAs to manage thermal headroom, adding USD 6,000-10,000 per unit. Rohde & Schwarz’s ZNB3000, offering 67 GHz without mixers via GaN drivers and micro-channel liquid cooling, demonstrates how integration collapses multi-box benches and raises switching costs. While the 1-6 GHz share will slide through 2031, absolute revenue remains meaningful owing to LTE densification and private 5G deployments in factories that leverage CBRS allocations in the United States and local-license regimes in Germany and Japan.
By Component: Amplifiers Outpace Analyzers
RF analyzers accounted for 27.63% of 2025 revenue, serving emission compliance, spectrum monitoring, and signal intelligence roles. Yet RF amplifiers are growing at a 7.31% CAGR, as 5G massive MIMO and automotive radar require +40 dBm power across 24-40 GHz with 0.5 dB gain flatness for over-the-air verification. Oscillators and synthesizers face pricing pressure because direct-digital synthesis and arbitrary-waveform capability now ship inside modular generators, shrinking standalone demand. Detectors remain a niche for production power loops, rising only in line with the overall RF test equipment market.
Anritsu’s VectorStar MS4640B, updated in March 2025 to 0.005 dB trace noise, illustrates premium positioning for aerospace bids that tolerate list prices above USD 200,000. The IEC 61000-4-3 update now obliges network-analyzer confirmation of chamber uniformity, adding compliance-driven pull for analyzer channels over cycle-linked demand. RF switches and attenuators continue to commoditize as ICs integrate gain control, favoring full-system vendors able to bundle accessories into turnkey contracts. The broader pivot from frequency-domain snapshots to vector and time-domain characterization underscores rising software value in integrated platforms.
By End-User Industry: Automotive Accelerates
Automotive applications are expanding at an 8.04% CAGR, the fastest vertical, because 77-81 GHz radar and LiDAR-radar fusion require 10 ns synchronization accuracy. Germany committed EUR 2.8 billion (USD 3.1 billion) to ADAS test labs in 2025, with a focus on Baden-Württemberg and Bavaria. Japan tightened UNECE R79 radar-interference limits the same year, obliging hardware-in-the-loop validation across -40 °C to +85 °C temperature swings and spurring demand for USD 80,000-150,000 environmental chambers.
Telecommunications retained a 38.13% share in 2025, propelled by 5G densification and Open RAN, but margin compression looms as tier-1 operators negotiate rental pools and delay capital until the Release 20 freeze. Aerospace and defense, though smaller in volume, sustain price premiums of 40-60% because MIL-STD-461 calls for analyzers with ≥120 dB dynamic range to 110 GHz. Consumer-electronics testing commoditizes as LitePoint’s turnkey IQxel-MW drops per-unit costs below USD 0.50, squeezing contract manufacturer margins. Semiconductor fabs, cyclical by nature, dipped 12% in wafer starts during 2025 but will rebound with 3 nm ramp-ups in 2026, introducing new parametric challenges. Healthcare and industrial IoT represent emerging niches that prioritize handheld analyzers under USD 10,000, areas where Chinese brands dominate at the expense of Western service-level agreements.
Geography Analysis
North America maintained a 36.01% revenue share in 2025 as C-band license obligations enforced stringent interference validation, and Federal auction receipts exceeded USD 22 billion. The United States also funds a USD 4.1 billion Joint All-Domain Command and Control program that mandates software-defined analyzers across 30 MHz-6 GHz for mission-critical networks. Canadian subsidies worth CAD 340 million (USD 250 million) support 5G rural coverage, including test-gear vouchers.
Asia Pacific shows the fastest trajectory, posting a 7.64% CAGR, powered by China’s 4.76 million 5G macro sites and India’s rapid private-network licensing. South Korea’s roadmap sets a path to 110 GHz analyzers for 6G prototypes by 2028. Japan’s March 2025 spectrum auction raised JPY 480 billion (USD 3.2 billion) and stipulates inter-operator interference margins verified by vector network analysis.
Europe accounted for 22% share in 2025 but grapples with a 23% vacancy rate for mmWave engineers at leading vendors. The EU Chips Act earmarks EUR 1.2 billion (USD 1.3 billion) for test-infrastructure co-investment, while Norway’s Telenor consolidated five labs into a single remote-access site, cutting overhead by 31%. The United Kingdom’s 26 GHz auction raised GBP 1.4 billion (USD 1.8 billion), embedding over-the-air mandates into licensing.
Middle East and Africa depict nascent uptake, yet Saudi private 5G in oil fields requires intrinsically safe analyzers, a domain Fluke dominates. South America embraces rentals, with Brazil registering 72% lease penetration for new test gear in 2025. This financing model migrates toward Africa where South Africa earmarks ZAR 8 billion (USD 440 million) for rural broadband, including rental options.

Regulatory Landscape
Regulation shaping RF test requirements is tightening around both security of certification pathways and radio-equipment cyber resilience. In the United States, FCC equipment authorization under 47 CFR Part 2 (Certification and Supplier's Declaration of Conformity) anchors compliance testing demand, and the FCC finalized ET Docket No. 24-136 in May 2026 to promote the integrity and security of Telecommunication Certification Bodies and measurement facilities by adding a fast-track priority review path tied to Trusted Test Labs, effective June 15, 2026. The FCC also issued a Small Entity Compliance Guide in January 2026 for rules adopted in FCC 25-71, reinforcing screening and restrictions that shape which labs and TCBs can participate in the authorization program.
In Europe, radio equipment placed on the market continues to be governed by the Radio Equipment Directive framework, with updated rules for the commercialization of radio equipment applying from May 30, 2026 following required national transposition by May 29, 2026. The European Commission adopted Delegated Regulation (EU) 2026/339, setting a transition that repeals Delegated Regulation (EU) 2022/30 effective December 11, 2027 to align with newer cybersecurity requirements. This shift pushes suppliers toward test methods that cover both RF performance and digital-element security. Globally, spectrum alignment remains tied to the ITU Radio Regulations, with the 2024 edition entering into force on January 1, 2025, and updates to allocations and coordination rules feeding into national conformance and interoperability test plans.
Value Chain Analysis
The RF test equipment value chain starts with high-performance semiconductors and RF/microwave components (ADCs/DACs, FPGAs, timing references, mixers, and power devices such as GaN), then moves into instrument design, manufacturing, calibration, and software enablement (measurement applications, automation, and simulation). Upstream availability of compute and mixed-signal silicon is a gating factor for modular platforms and high-frequency systems. Mid-2026 industry reporting highlighted shortages in key non-memory components such as FPGAs, CPUs, and pin drivers, which translated into longer manufacturing lead times for finished systems and increased the need for buffer stocking and multi-sourcing of critical boards.
Midstream, vendors differentiate through integrated hardware plus software, along with ecosystem validation with chipset and device partners, which shortens user qualification cycles for new standards and bands. Collaborations such as Aracion with Keysight on CATR FR1 OTA testing (February 2025) and Anritsu with Bluetest AB on 5G RedCap OTA measurement solutions (July 2025) show how chamber providers, accredited labs (for example, NABL and A2LA referenced in deployments), and instrument OEMs co-develop turnkey validation flows. Downstream, distribution splits between direct enterprise sales to operators, OEMs, and defense labs, and channel-driven placements into universities, contract manufacturers, and regional service providers. Rentals and operating leases are growing in price-sensitive markets, and they tend to accelerate refresh cycles when standards shift.
Competitive Landscape
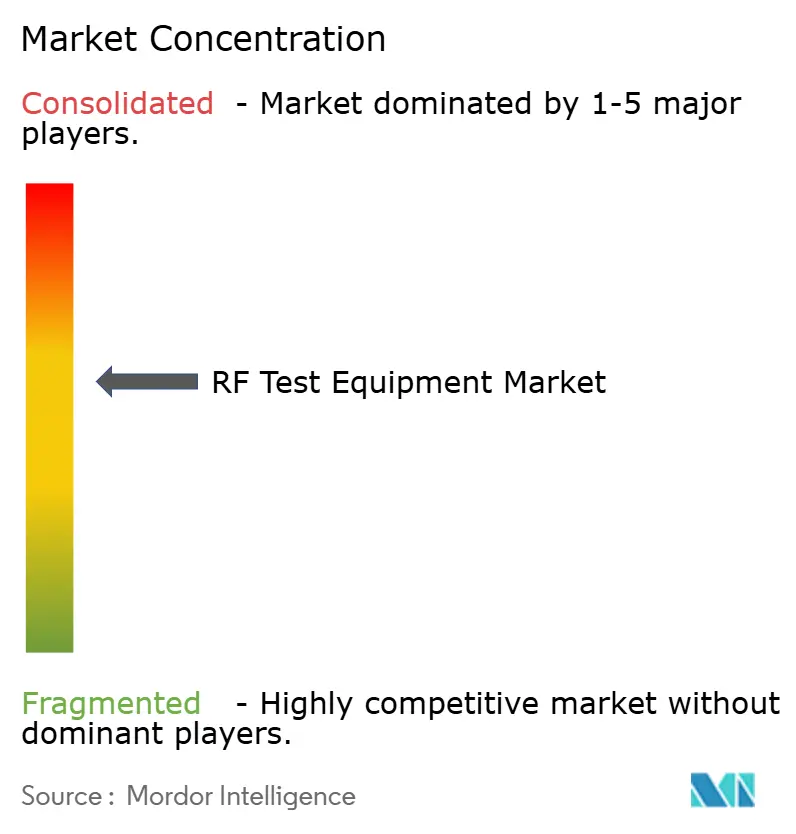
The RF test equipment market is moderately concentrated: the top five suppliers hold nearly 55% of global revenue, yet none exceeds an 18% individual share. Keysight’s 34% PathWave software-subscription growth in Q3 2025 signals a strategic pivot to recurring revenue that offsets a 7% drop in benchtop shipments. Rohde and Schwarz’s ZNB3000 integrates gallium-nitride amplifiers up to 67 GHz, compressing multi-box benches and elevating switching costs for users tied to proprietary calibration libraries.
White-space entrants such as Copper Mountain and RIGOL target sub-USD 20,000 USB analyzers for IoT labs, capturing price-sensitive share that incumbents ceded while chasing aerospace margins. National Instruments, now under Emerson, embeds cloud orchestration into its PXI roadmap to enable multi-site asset pooling. Patent portfolios shape the playing field, Keysight holds 340 active claims around over-the-air MIMO testing, deterring smaller rivals.[3]United States Patent and Trademark Office, “Keysight Patent Portfolio,” USPTO.gov
Price competition is fiercest in the 1-6 GHz benchtop tier, where 12 brands offer near-parity specifications. In contrast, only four credible vendors ship >40 GHz modular systems, restricted by thermal-management complexity. Strategic alliances are emerging at the sub-terahertz frontier: Keysight and Nokia plan a 100-300 GHz prototype line by 2027 to align with World Radiocommunication Conference 2027 agendas. Such collaboration underscores the rising capital intensity and regulatory interdependence of upcoming frequency bands.
RF Test Equipment Industry Leaders
-
Keysight Technologies, Inc.
-
Rohde & Schwarz GmbH & Co. KG
-
Anritsu Corporation
-
Viavi Solutions Inc.
-
National Instruments Corporation
- *Disclaimer: Major Players sorted in no particular order

Market Opportunities and Future Outlook
A whitespace is opening at the intersection of advanced RF measurements and design-to-test workflows, where buyers need fewer integration steps across simulation, on-wafer characterization, and over-the-air validation. Rohde & Schwarz joining FormFactor's MeasureOne partner program in March 2026 signals ongoing demand for integrated on-wafer RF component characterization, particularly for mmWave and satellite-front-end development, where probe, fixturing, and metrology alignment can drive both time and cost. Keysight's collaboration with WIN Semiconductors (reported in 2026) around GaN MMIC design workflows also points to instrument vendors embedding measurement-aware models and golden-reference test methods earlier in the RFIC lifecycle, improving handoff from design houses to production test.
Another opportunity area is frequency expansion beyond current mmWave into sub-THz instrumentation and the associated fixtures, calibrations, and lab infrastructure. Anritsu's June 2026 launch of a Tensor Vector Network Analyzer supporting measurements up to 1.1 THz is a concrete marker of product readiness for research and prototype validation, with follow-on pull for compatible frequency extenders, probes, and calibration services that can fit within the same procurement cycles. On the manufacturing side, expansion of outsourced test capacity supports incremental placements of RF-capable production and characterization tools, highlighted by Doosan Tesna's April 2026 announcement of 190.9 billion won in test equipment acquisitions from Teradyne, Advantest, and Semes to expand testing infrastructure. This reinforces demand for complementary RF benches used in device bring-up, debug, and correlation across test floors and reliability labs.
Recent Industry Developments
- July 2026: Keysight Technologies launched the APS-ONE-400, a modular 4x100GE network cybersecurity test platform. The release expands Keysight's presence in high-throughput, modular validation, aligning with the broader shift toward software-led and rack-based test environments used by telecom and network equipment labs.
- June 2025: Anritsu released the AREG800A automotive radar echo generator supporting 76-81 GHz with low jitter for radar validation. The product supports the move to 77-81 GHz ADAS radar test benches and increases demand for higher-frequency generators and analyzers that can keep timing alignment tight in HIL and lab environments.
- December 2024: The 2024 edition of the ITU Radio Regulations was adopted in 2024, with entry into force on January 1, 2025, updating the treaty framework that governs global spectrum and satellite-orbit use. The update feeds through national allocations and coordination procedures, which in turn changes what conformance and interference tests labs prioritize for new deployments across cellular, satellite, and unlicensed bands.


Research Methodology Framework and Report Scope
Market Definition and Coverage
For this study, the RF test equipment market covers instruments and platforms used to generate, measure, and analyze RF signals for design, compliance, manufacturing, and field maintenance across major end users such as telecom, electronics, and aerospace and defense.
Scope exclusions: We exclude repair-only services, legacy analog meters, and test sets that are purely digital and do not have RF front-end measurement capability.
Segmentation Overview
-
By Type
- Modular GP Instrumentation
- Traditional GP Instrumentation
- Semiconductor ATE
- Rental GP
- Other Types
-
By Form Factor
- Benchtop
- Portable
- Modular
-
By Frequency Range
- < 1 GHz
- 1 - 6 GHz
- > 6 GHz
-
By Component
- RF Analysers
- RF Oscillators
- RF Synthesizers
- RF Amplifiers
- RF Detectors
- Other Components
-
By End-user Industry
- Telecommunication
- Aerospace and Defence
- Consumer Electronics
- Automotive
- Semiconductor Manufacturing
- Healthcare
- Industrial and IoT
- Other End-user Industries
-
By Geography
-
North America
- United States
- Canada
-
South America
- Brazil
- Argentina
- Rest of South America
-
Europe
- United Kingdom
- Germany
- France
- Italy
- Sweden
- Norway
- Rest of Europe
-
Middle East
- Saudi Arabia
- United Arab Emirates
- Turkey
- Rest of Middle East
-
Africa
- South Africa
- Nigeria
- Rest of Africa
-
Asia Pacific
- China
- Japan
- India
- South Korea
- Rest of Asia Pacific
-
North America
Data Sources, Market Sizing, and Validation
Desk Research
Desk research was used to set the fact base for demand signals and technology cycles that shape RF test spending. We referenced public sources such as the ITU for telecom indicators, the FCC and NTIA for spectrum and compliance context, 3GPP releases for standards timing, and IEEE papers for measurement and validation practices that influence instrument requirements.
To translate these signals into a workable market model, we also used company annual reports and investor presentations, customs and trade statistics for relevant instrument categories, and reputable press coverage on fab expansions and 5G and satellite rollouts. Where public disclosures were thin, we used paid subscription data for company financials and intelligence and a separate paid subscription for patent databases to sanity-check technology direction and product refresh cadence. These desk sources are not exhaustive, and additional references were used to collect data points, validate assumptions, and clarify open questions during the research process.
Primary Interviews and Surveys
Primary work focused on interviews and structured surveys with equipment manufacturers, component suppliers, channel partners, and end-user test teams that run RF labs and production lines. Respondent input was gathered across APAC, EMEA, and the Americas to confirm shipment momentum, average selling price movement, and mix shifts across benchtop, modular, and portable form factors, and then to close gaps left by public data.
Distribution of primary research fieldwork respondents
| Company type | Respondent position | Region |
|---|---|---|
| Top tier: 36% | CXOs: 17% | APAC: 50% |
| Mid tier: 45% | Functional/Unit leaders: 23% | EMEA: 30% |
| Smaller Players: 19% | Managers: 60% | Americas: 20% |
Market-Sizing & Forecasting
Sizing starts with a top-down build where telecom, device, and semiconductor activity indicators are translated into a demand pool for RF testing, and then allocated into equipment spending based on typical test intensity and refresh cycles. Once that first cut is formed, selective bottom-up checks are run using sampled supplier revenues, channel feedback on unit volumes, and indicative ASP bands by instrument class, which are then used to adjust outliers and improve alignment.
Key inputs used in the model include 5G and RF front-end device build trends, lab and production test intensity for higher frequency bands (including millimeter-wave), the mix shift toward automated test systems and modular instruments, replacement timing linked to standards upgrades, and regional electronics manufacturing growth. Forecasting relies mainly on scenario analysis, where base, conservative, and high cases are built around the pace of 5G and satellite deployment, fab capacity additions, and pricing normalization for high-frequency instruments. When bottom-up inputs are missing for smaller geographies or niche instruments, gaps are handled through proxy indicators and then re-checked with interview feedback before totals are finalized.
Data Validation & Update Cycle
Validation is done in steps, starting with cross-checks between the model output and independent signals such as standards release timing, electronics production direction, and disclosed order commentary from public companies. If a region or end-use line item looks inconsistent, the assumptions are re-opened, the math is re-run, and follow-up calls are triggered to confirm whether the variance is real or a modeling artifact.
Before sign-off, the full market view goes through multi-step analyst review so scope boundaries, unit conversions, and currency treatment are consistent across years. Reports are refreshed annually, and interim updates are made when material events occur, such as major technology shifts or sharp demand changes. Right before delivery, a final pass is completed so clients receive the most current view available.
Mordor Intelligence's Rf Test Equipment Market Size Measured Against Other Published Estimates
Published market sizes for RF test equipment can look far apart because each publisher draws the market boundary differently and uses different timing for currency and refresh assumptions. The year chosen as the anchor, the treatment of high-frequency instruments, and whether services are blended with equipment values also tend to move totals.
The table highlights how scope and measurement choices show up as different USD values for similar sounding markets. A common gap driver is whether the estimate counts only newly manufactured RF instruments used for validation, compliance, manufacturing, and field maintenance, or whether it also adds adjacent digital-only test sets and service activity, and then applies faster ASP growth without matching it to realistic mix shifts.
Benchmark comparison
| Source | Market Size | Gaps in Research Methodology |
|---|---|---|
| Mordor Intelligence | USD 4.27 B (2026) | |
| Global Consultancy A | USD 2.76 B (2023) | Uses an earlier base year and a narrower equipment spend window that can undercount newer high-frequency test demand building into 5G and advanced device ramps. |
| Industry Publisher B | USD 3.35 B (2024) | Blends a different forecast window and can expand the counted set of instruments by frequency bands and applications without clearly separating equipment-only value from adjacent testing activity. |
The spread is easier to interpret once the timing and what is counted are made explicit. The table shows a higher 2026 value because, in Mordor Intelligence's model, only newly manufactured RF test equipment is counted (including high-frequency platforms up to very high bands), while repair-only services and digital-only test sets without RF front-ends are kept out of scope so the total stays tied to equipment purchasing behavior.


Key Questions Answered in the Report
What is the projected value of the RF test equipment market by 2031?
The RF test equipment market is expected to reach USD 5.79 billion by 2031.
Which frequency tier is growing the fastest in RF test applications?
Equipment covering frequencies above 6 GHz, particularly FR2 and Ka-band, is expanding at an 8.53% CAGR.
Why is automotive demand rising for RF test equipment?
Transition to 77-81 GHz radar and stringent UNECE safety regulations lift automotive CAGR to 8.04% through 2031.
How are rental models affecting procurement in South America?
Over 70% of new 5G test-gear placements in Brazil were financed via operating leases in 2025, easing capital constraints.
What role does software play in modern RF test solutions?
Cloud-connected orchestration and subscription-based analytics now influence purchasing criteria more than raw measurement speed.
Page last updated on:


 Your data is secure and never sold or shared.


