Wire And Cable Market Size and Share
Market Overview
| Study Period | 2020 - 2031 |
|---|---|
| Market Size (2026) | USD 245.44 Billion |
| Market Size (2031) | USD 315.78 Billion |
| Growth Rate (2026 - 2031) | 5.17% CAGR |
| Fastest Growing Market | Africa |
| Largest Market | Asia Pacific |
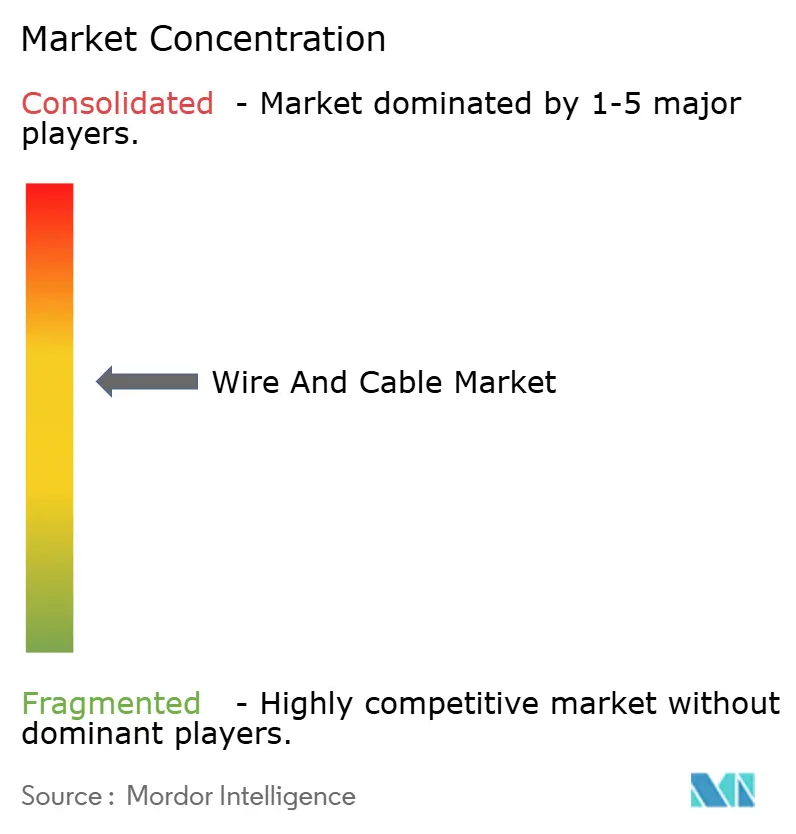
| Market Concentration | Medium |
Major Players *Disclaimer: Major Players sorted in no particular order Image © Mordor Intelligence. Reuse requires attribution under CC BY 4.0. | |

Wire And Cable Market Analysis by Mordor Intelligence
The wire and cable market size reached USD 245.44 billion in 2026 and is projected to attain USD 315.78 billion by 2031, advancing at a 5.17% CAGR. Sustained capital spending on offshore wind export links in the North Sea and East Asia, accelerated fiber-to-the-home builds across India and Southeast Asia, and the shift toward battery-electric vehicle harnesses are broadening the revenue base of the wire and cable market. Power grid operators are front-loading orders for 320-kilovolt and 525-kilovolt subsea corridors to de-risk project timelines, while hyperscale data-center builders are locking in long-haul fiber capacity to support 400-gigabit and 800-gigabit optics. Commodity substitution is gaining momentum as aluminum conductor designs reduce procurement costs when London Metal Exchange copper prices surge, and recycled copper content is becoming a key procurement clause for net-zero corporate buyers. Localized high-voltage cable manufacturing in the United States and Europe is reshaping global supply chains, reducing logistics costs and mitigating foreign exchange exposure for projects tied to domestic content incentives.
Key Report Takeaways
- By voltage, low-voltage cables led with 46.12% revenue share in 2025, while extra- and high-voltage segments are forecast to expand at a 7.91% CAGR through 2031.
- By cable type, power cables accounted for 38.27% of 2025 revenue, whereas fiber-optic lines are poised to grow at an 8.62% CAGR to 2031.
- By conductor material, copper captured 58.48% volume in 2025, and aluminum is projected to rise at a 6.84% CAGR through 2031.
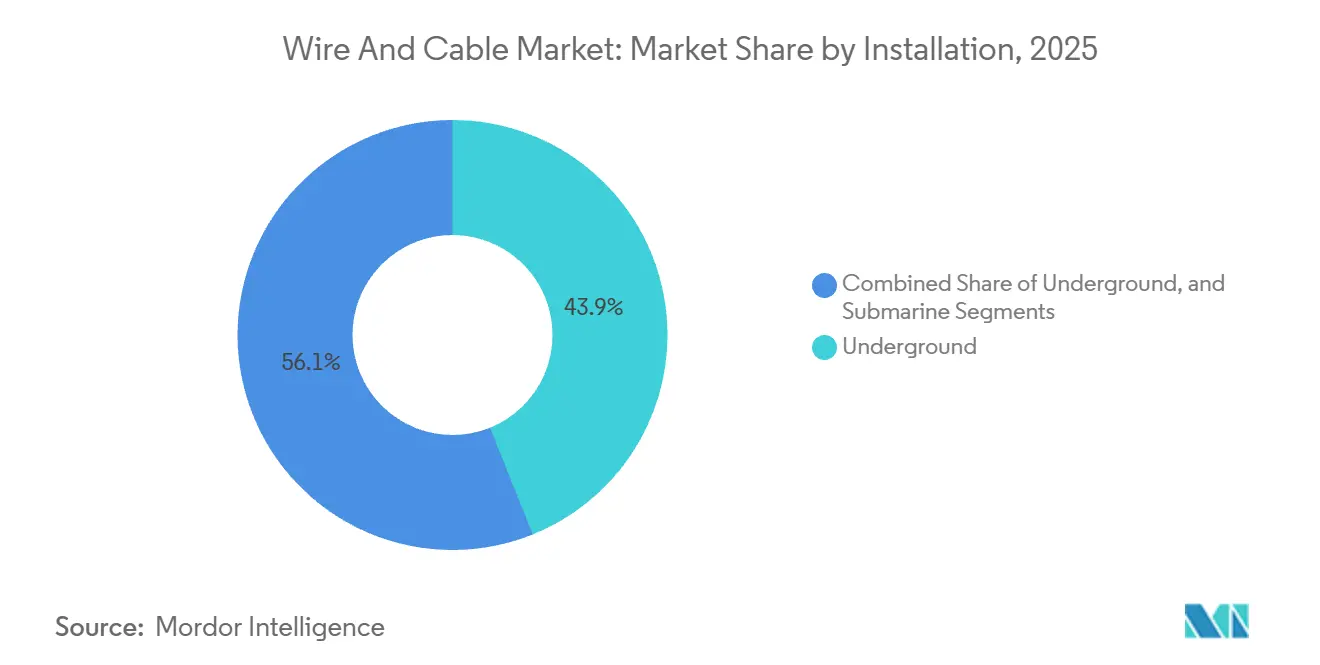
- By installation, underground deployments held 43.91% of 2025 projects, with submarine layouts advancing at an 8.43% CAGR during the forecast window.
- By end-user vertical, power infrastructure accounted for 29.56% of demand in 2025, and telecom and data centers are expected to grow at an 8.12% CAGR.
- By geography, Asia Pacific represented 38.71% of 2025 revenue, whereas Africa is projected to register a 7.23% CAGR to 2031.
Note: Market size and forecast figures in this report are generated using Mordor Intelligence’s proprietary estimation framework, updated with the latest available data and insights as of January 2026.
Global Wire And Cable Market Trends and Insights
Drivers Impact Analysis*
| Driver | (~) % Impact on CAGR Forecast | Geographic Relevance | Impact Timeline |
|---|---|---|---|
| Surging Offshore Wind HV Cable Demand in North Sea and East Asia | +1.2% | Europe (North Sea), Asia Pacific (China, Taiwan, South Korea, Japan) | Medium term (2-4 years) |
| Accelerated Fiber-To-The-Home Roll-Outs in India and ASEAN | +0.9% | Asia Pacific (India, Indonesia, Vietnam, Thailand, Philippines) | Short term (≤ 2 years) |
| Rapid Build-Out of Data Center Interconnects in Emerging Digital Hubs | +1.0% | Global, early gains in North America, Asia Pacific, Middle East | Short term (≤ 2 years) |
| Electrification of Automotive Harnesses for EV Platforms | +0.8% | Global, concentration in North America, Europe, China | Medium term (2-4 years) |
| Sub-Saharan Grid Interconnect Projects Unlocking Multilateral Funding | +0.7% | Africa (West, East, Southern Power Pools) | Long term (≥ 4 years) |
| Corporate Net-Zero Procurement Driving Green Cable Materials Adoption | +0.5% | Global, led by Europe and North America | Long term (≥ 4 years) |
| Source: Mordor Intelligence | |||


Surging Offshore Wind HV Cable Demand In North Sea And East Asia
A record pipeline of North Sea and Baltic Sea offshore wind export corridors is pulling forward manufacturing slots for 320-kilovolt and 525-kilovolt direct-current cables, with utilities stipulating International Electrotechnical Commission 62067 compliance to assure reliability across multinational grids. Contract awards, such as Prysmian’s EUR 300 million (USD 339 million) commitment for its South Carolina facility and NKT’s Bornholm Energy Island export package exceeding EUR 500 million (USD 565 million), are widening regional manufacturing capacity. East Asian demand mirrors Europe’s trajectory; LS Cable’s USD 400 million Taiwan awards and Taihan’s floating wind scope in South Korea underscore the urgency to secure high-voltage submarine supply. Developers are migrating from alternating-current to direct-current topologies for distances exceeding 100 kilometers, resulting in approximately 30% higher insulation consumption per kilometer and intensifying the risk of cross-linked polyethylene supply. Regulatory clarity and ready-to-install design catalogs shorten tender cycles, reinforcing incumbent advantage for European and Asian tier-one suppliers.
Rapid Build-Out of Data Center Interconnects In Emerging Digital Hubs
Hyperscale operators are self-provisioning long-haul fiber across Singapore, Mumbai, Dubai, and São Paulo to shave milliseconds from application latency, a prerequisite for artificial-intelligence inference and real-time trading workloads. The 45,000-kilometer 2Africa loop, which went live in 2024, lowered Europe-Africa latency by 40%, validating the economics of owned infrastructure over leased capacity. Meta’s Echo and Bifrost systems, each with more than 16 fiber pairs, set a new baseline for channel count while providing route diversity outside congested chokepoints. Middle East mega-projects, such as NEOM and Khazna’s 100-megawatt Abu Dhabi campus, are incorporating redundant terrestrial and subsea paths into their master plans to achieve five-nines uptime. Transitioning to 400-gigabit and 800-gigabit coherent optics compresses the cost per bit, lifting the return on invested capital for high-fiber-count cables and enabling faster revenue capture.
Accelerated Fiber-To-The-Home Roll-Outs In India and ASEAN
India’s BharatNet program is wiring 250,000 village councils with single-mode fiber backed by Universal Service Obligation Fund subsidies, creating a sustained baseline for the wire and cable market. Vietnam achieved 82.3% urban fiber penetration in 2025 and aims to reach 90% by 2030, while Thailand’s regulator mandates 95% household access by 2027. Indonesia’s 35,000-kilometer Palapa Ring backbone links remote islands to data hubs, and the Philippines earmarked PHP 10 billion (USD 178 million) to extend last-mile connectivity. Corning’s bend-insensitive fiber and Sumitomo’s ultra-low-loss variants permit tighter bends and higher strand counts, driving duct utilization efficiencies. Migration from copper digital subscriber line to fiber is now irreversible as streaming, cloud gaming, and remote work require symmetrical gigabit throughput.
Electrification of Automotive Harnesses For EV Platforms
Adoption of Society of Automotive Engineers J3400 connector standards across Ford, General Motors, and Rivian harmonizes high-voltage cable specifications, making it easier for tier-one suppliers to scale global production.[1]Society of Automotive Engineers, “SAE J3400 North American Charging Standard,” sae.org Molex’s 1,000-volt, 500-amp connectors enable 350-kilowatt fast charging, which restores 80% of battery capacity within 15 minutes, pressuring harness designers to manage thermal loads. Transitioning from 400-volt to 800-volt vehicle architectures reduces cable gauge and weight, and can trim the bill of materials by up to 20%, appealing to original equipment manufacturers seeking cost parity with internal-combustion models. Automation investments by Leoni and TE Connectivity, including ultrasonic welding and laser stripping, enhance throughput and consistency at a time when global electric-vehicle output is on a trajectory toward 30 million units by 2030. High-speed data buses share wiring pathways with traction cabling, pushing demand for shielded, electromagnetically compatible products that withstand aggressive under-hood temperature cycles.
Restraints Impact Analysis*
| Restraint | (~) % Impact on CAGR Forecast | Geographic Relevance | Impact Timeline |
|---|---|---|---|
| XLPE Resin Supply Bottlenecks Limiting EHV Output | -0.6% | Global, acute in Europe and North America | Short term (≤ 2 years) |
| Copper Price Volatility Squeezing Contractor Margins in MENA | -0.5% | Middle East and North Africa | Medium term (2-4 years) |
| Vulnerability of Subsea Cables to Geopolitical Sabotage | -0.3% | Red Sea, Baltic Sea, Taiwan Strait | Short term (≤ 2 years) |
| Skilled Workforce Shortages in High-Voltage Cable Jointing | -0.4% | Global, severe in North America and Europe | Long term (≥ 4 years) |
| Source: Mordor Intelligence | |||
XLPE Resin Supply Bottlenecks Limiting EHV Output
Cross-linked polyethylene insulation bespoke to 220 kilovolt and above constructions faces feedstock tightness as petrochemical majors favor higher-margin packaging resins, stretching lead times to 18 months in 2024 and forcing project rescheduling across European offshore grids. Prysmian has added a dedicated compounding line in Arco Felice, Italy; however, overall industry additions still trail incremental demand. Only a handful of qualified suppliers, such as Borealis and Dow, hold the formulations required for 525 kilovolt direct-current designs, and material qualification under IEC regimes is a multi-year exercise. Higher voltage ratings consume roughly 30% more insulation per kilometer, amplifying resin scarcity. Developers that can pre-book slurry allocations secure earlier energization dates, while laggards risk cost overruns tied to vessel re-mobilization.
Copper Price Volatility Squeezing Contractor Margins In MENA
London Metal Exchange prices fluctuated between USD 9,000 and USD 10,000 per tonne in 2024-2025 due to supply disruptions in Chile and Peru, eroding margins for fixed-price Middle East transmission packages. Contractors locking in cable bids six to twelve months before delivery absorbed up to 15% unhedged cost swings. Utilities such as Saudi Electricity Company and Dubai Electricity and Water Authority now specify aluminum conductor steel-reinforced lines for 33 kilovolt and 66 kilovolt routes to buffer tender budgets, though aluminum’s lower ampacity demands larger cross sections that lift tower loads. Futures hedging uptake remains subdued in the region, and currency alignment to USD magnifies volatility exposure when copper prices spike. Supplier diversification into recycled copper blends enhances cost resilience, yet requires strict process control to maintain conductivity and tensile strength specifications.
*Our forecasts treat driver/restraint impacts as directional, not additive. The impact forecasts reflect baseline growth, mix effects, and variable interactions.
Segment Analysis
By Voltage: Extra-High Segments Accelerate Long-Distance Transfers
Extra- and high-voltage lines above 35 kilovolts are expected to grow at a 7.91% CAGR to 2031, outperforming the overall wire and cable market. Low-voltage incumbents continue to dominate, with a 46.12% revenue share in 2025, primarily anchored in residential and commercial circuits. However, growth moderates as China and Europe cool housing starts. Developers prefer high-voltage direct-current topologies for links exceeding 100 kilometers, redirecting procurement to suppliers that possess 600-kilovolt test chambers. The shift elevates the barrier-to-entry thresholds and compresses delivery windows, reinforcing the incumbent's advantage.
The wire and cable market share for low-voltage products remains substantial in terms of units, but commoditization is squeezing margins. Medium-voltage applications, ranging from 1 kilovolt to 35 kilovolts, maintain a stable base in urban grids and industrial parks. Extra-high-voltage advances rest on cross-linked polyethylene enhancements and real-time digital twins that model thermal profiles during transient loads. China and India are pioneering 800 kilovolt corridors to shuttle renewables to coastal load centers, requiring thicker insulation walls and factory-jointed sections that simplify offshore installation.


By Cable Type: Fiber-Optic Lines Outpace Power Applications
Fiber-optic cables are projected to rise at an 8.62% CAGR, the strongest growth within the wire and cable market, driven by 5G backhaul, cloud interconnects, and fiber-to-the-home mandates. Power cables held 38.27% of 2025 revenue but face mature trajectories in North America and Western Europe. Signal and control variants ride the crest of Industry 4.0 upgrades, while coaxial demand tapers as video migrates to over-the-top streaming.
The wire and cable market size for fiber optics is expanding further as demand for 400-gigabit coherent optics requires ultra-low-loss glass. Corning’s bend-insensitive single-mode fiber reduces duct congestion by allowing more strands to be squeezed into existing conduits. Power cable innovations focus on integrating fiber sensors for real-time condition monitoring, blending data and electricity in one sheath. Declining cost per bit, coupled with spectrum-sharing techniques on new subsea loops, cements fiber’s ascendancy in high-capacity routes.
By Conductor Material: Aluminum Captures Transmission Upside
Aluminum is forecast to register a 6.84% CAGR, narrowing copper’s 58.48% volume lead as utilities pivot to aluminum conductor steel-reinforced designs to escape copper volatility. Aluminum’s density advantage reduces tower loading and shipping costs, which are critical for long spans over rugged terrain. Optical glass, embedded in fiber-optic lines, continues to see double-digit gains in data network deployments.
Copper retains dominance in low-voltage wiring due to superior termination reliability and regulatory mandates in most building codes. The wire and cable market size devoted to recycled copper blends is climbing as Nexans commits to 30% recycled content by 2030. Polymer optical fibers are aimed at short-reach automotive infotainment links but remain a niche market. The ongoing tug-of-war between conductivity, weight, and cost keeps the conductor mix fluid, with aluminum gaining predominance in overhead lines and copper retaining its position in line-side panels and switchgear circuits.
By Installation: Submarine Routes Lead Growth Trajectory
Submarine deployments are expected to expand at an 8.43% CAGR, dwarfing overhead and underground alternatives as offshore wind hubs and intercontinental data routes proliferate. Underground layouts captured 43.91% of 2025 projects, reflecting urban mandates to bury feeders. Overhead construction remains cost-effective in rural corridors but cedes share where reliability and aesthetics matter.
The wire and cable market share for submarine systems is underpinned by icons like the 45,000-kilometer 2Africa loop, which encircles an entire continent. Installation vessels must negotiate depths beyond 200 meters while laying armor-clad designs that resist trawler strikes. Horizontal directional drilling cuts street disruptions in underground urban builds. Overhead lines still dominate emerging markets, where capital outlay is weighed against outage risk. However, future-proofing drives cities to prefer underground alternatives, despite higher upfront costs.
By End-User Vertical: Telecom And Data Centers Scale Fastest
Telecom carriers and data centers are expected to grow at an 8.12% CAGR through 2031, outpacing other verticals as hyperscale builders self-provision fiber to ensure bandwidth sovereignty. Power infrastructure accounted for 29.56% of 2025 demand and remains indispensable as grids modernize to integrate renewable energy. Construction provides a solid baseline volume, while oil and gas, petrochemical, automotive, and manufacturing segments require specialized formulations.
Residential wiring is gaining traction in China and Europe, but it is also experiencing growth in India, Southeast Asia, and Africa, where electrification is still on the rise. Commercial projects rebound post-pandemic as smart-building retrofits require low-smoke, zero-halogen jacketing and structured cabling. International Energy Agency estimates of USD 2 trillion annual grid spend underscore the runway for extra-high-voltage orders.
Geography Analysis
Asia Pacific held 38.71% of 2025 revenue, buoyed by China’s ultra-high-voltage corridors, India’s BharatNet fiber drives, and Southeast Asia’s urbanization push. Chinese suppliers Hengtong and ZTT utilize large-scale optical-fiber output to anchor pricing, while Indian incumbents Polycab and KEI expand domestic lines to meet rising residential demand. Japan and South Korea are escalating offshore wind tie-ins and grid upgrades, while Australia advances renewable energy zones that require long-distance transfer paths.
Europe remains a powerhouse due to North Sea and Baltic offshore wind activity. Prysmian, Nexans, and NKT lock in multi-hundred-million-dollar export packages for projects such as LionLink, Dogger Bank, and Bornholm Energy Island. Germany, France, and Spain modernize their aging transmission loops, while Italy and Eastern Europe replace their brittle distribution assets. Baltic Sea sabotage cases, such as C-Lion1 and Estlink 2, highlight the importance of redundant routing and monitoring.
Africa is forecast to post the strongest regional CAGR at 7.23% as multilateral lenders bankroll cross-border power pools and national electrification agendas.[2]African Development Bank, “Mission 300 Initiative,” afdb.org The West Africa Power Pool and Eastern Electricity Highway exemplify how bundled financing unlocks demand for medium- and high-voltage links. Payment cycles and regulatory hurdles remain steep, but players willing to navigate them secure first-mover advantages amid electrification levels under 50% in many economies.
North America witnesses reshoring of high-voltage production as Prysmian and Nexans commit more than USD 500 million combined to South Carolina factories, positioning themselves near Atlantic offshore wind leases. Inflation Reduction Act incentives stimulate domestic sourcing, while grid operators in the United States and Canada modernize networks for renewable influx. South America concentrates growth in Brazil where the regulator cleared 15,000 kilometers of new lines in 2024. The Middle East shifts toward aluminum to mitigate copper spikes, aligning with megaprojects such as NEOM that demand advanced thermoplastic insulation systems.
Mordor Intelligence provides coverage of the wire and cable market across other key regional markets, including North America, Europe, and South America, each with their regulatory frameworks and demand patterns. Detailed country-level analysis extends to India and Mexico incorporating local coverage and market participation, as required.


Competitive Landscape
The top ten manufacturers account for about 40% of global revenue, indicating moderate concentration in the wire and cable market. Prysmian’s USD 2.3 billion Encore Wire acquisition deepened its North American low- and medium-voltage footprint. Meanwhile, investments of EUR 300 million (USD 339 million) in South Carolina and EUR 200 million (USD 226 million) in Arco Felice expand high-voltage capacity and in-house XLPE output. Nexans committed USD 200 million to a parallel plant in South Carolina and clinched the Dogger Bank export deal, anchoring its pivot toward localized high-voltage offerings.
Chinese heavyweights Hengtong and ZTT harness cost leadership and scale to win hyperscale data-center fiber packages, supported by automated preform lines and vertically integrated draw towers. Indian majors Polycab and KEI add extra-high-voltage and optical-fiber modules at Gujarat sites to capitalize on grid modernization and fiber-to-the-home mandates. Sub-Saharan Africa represents a white-space niche for suppliers willing to meet the financing and logistics challenges associated with multilateral projects.[3]World Bank, “West Africa Power Pool Project Financing Announcement,” worldbank.org
Process automation and real-time quality analytics are emerging differentiators. Prysmian’s Industry 4.0 rollouts reduced defect rates by 20% and increased throughput by 15%, a benchmark that competitors now strive to match. Patent activity intensifies around XLPE formulations, direct-current converter stations and armoring schemes tuned for kappa-value seabeds. Specialist entrants aim at cryogenic transfer lines, radiation-rated reactor cables and fire-survivable metro tunnel wiring, staking claims in niches that require stringent certification.
Wire And Cable Industry Leaders
Prysmian Group
Nexans SA
Sumitomo Electric Industries Ltd.
LS Cable and System Ltd.
Southwire Company LLC
- *Disclaimer: Major Players sorted in no particular order

Recent Industry Developments
- September 2025: Motherson acquired Nexans SA's Autoelectric wiring harness business for EUR 207 million (USD 243.43 million), a move that aligns with Nexans' streamlined electrification strategy.
- August 2025: Securing a contract to supply 525kV HVDC cable for the UK's Sea Link project, Sumitomo Electric bolstered its presence in Europe.
- July 2025: LS Cable & System is investing USD 689 million in a new plant in Virginia, marking a significant expansion of its U.S. manufacturing footprint.
- June 2025: Driven by surging demand for fiber optics in AI data centers, Fujikura Ltd 's stock skyrocketed by 1400% over two years.


Research Methodology Framework and Report Scope
Market Definitions and Key Coverage
Our study defines the wire and cable market as all newly manufactured electrical and communication conductors, metallic or optical, supplied on spools, drums, or reels for energy transmission, signal, or data transfer across overhead, underground, and submarine installations. Figures exclude raw conductor rod, downstream harness assemblies, installation labor, and used or refurbished product resale.
Scope Exclusion: Aftermarket harnesses, cable management hardware, and temporary rental fleets sit outside this valuation.
Segmentation Overview
- By Voltage
- Extra- and High-Voltage (Greater Than 35 kV)
- Medium-Voltage (1-35 kV)
- Low-Voltage (Less Than 1 kV)
- By Cable Type
- Power Cable
- Fiber-Optic Cable
- Signal and Control Cable
- Coaxial and Data Cable
- By Conductor Material
- Copper
- Aluminum
- Optical Glass / Polymer
- By Installation
- Overhead
- Underground
- Submarine
- By End-User Vertical
- Construction - Residential
- Construction - Commercial
- Power Infrastructure (Utilities and Renewables)
- Telecommunications and Data Centers
- Oil and Gas and Petrochemicals
- Automotive and Mobility
- Industrial Manufacturing
- By Geography
- North America
- United States
- Canada
- Mexico
- South America
- Brazil
- Argentina
- Rest of South America
- Europe
- United Kingdom
- Germany
- France
- Spain
- Italy
- Rest of Europe
- Asia Pacific
- China
- India
- Japan
- Australia
- South Korea
- Rest of Asia-Pacific
- Middle East and Africa
- Middle East
- Saudi Arabia
- United Arab Emirates
- Turkey
- Rest of Middle East
- Africa
- South Africa
- Kenya
- Rest of Africa
- Middle East
- North America
Detailed Research Methodology and Data Validation
Primary Research
Mordor analysts interviewed distributors, EPC contractors, national grid planners, and telecom infrastructure leads across Asia-Pacific, North America, Europe, and the Gulf. These conversations validated installation splits, average selling prices, and capex phasing, and flagged regional policy triggers that secondary material alone could not surface.
Desk Research
We began by mapping demand fundamentals through open-access sources such as the International Energy Agency, International Telecommunications Union, UN Comtrade shipment data, and regional grid-operator statistics, which gave base volumes for copper, aluminum, and fiber deployments. Construction and manufacturing outlooks from the U.S. Census Bureau, Eurostat, and Asian Development Bank helped us peg end-user growth arcs, while patent analytics from Questel revealed technology diffusion patterns. Financial filings, investor decks, and reputable press updates then filled price and project pipelines. The listed sources illustrate our desk-research backbone; many additional public notes and proprietary feeds were reviewed to cross-verify inputs.
Market-Sizing & Forecasting
A top-down build starts with country-level electricity-grid circuit-kilometer additions, fiber-to-the-home passings, and vehicle production to reconstruct aggregate conductor demand, which is then corroborated with selective bottom-up roll-ups of supplier shipments and sampled ASP x volume checks. Key variables like copper and optical-fiber unit prices, kilometers of new transmission lines, housing starts, and data-center rack additions feed a multivariate regression that projects value to 2030. Where bottom-up gaps emerge, ratios from analogous markets are imputed before final alignment.
Data Validation & Update Cycle
Outputs run through variance checks against trade statistics and commodity consumption curves; anomalies prompt re-contact with field respondents before sign-off. Reports refresh each year, and material policy or price shocks trigger interim recalculations so clients always receive the latest vetted view.
Why Mordor's Wire and Cable Baseline Commands Confidence
Published market estimates often diverge because firms vary product inclusions, price assumptions, and refresh cadence.
Key gap drivers in this industry are whether optical fiber is bundled with energy cables, how aftermarket assemblies are treated, and the depth of regional price sampling that underpins ASP curves. Mordor chooses a balanced scope, reports a neutral base-case scenario, and applies annual currency updates, which together temper extremes seen elsewhere.
Benchmark comparison
| Market Size | Anonymized source | Primary gap driver |
|---|---|---|
| USD 233.36 B (2025) | Mordor Intelligence | - |
| USD 267.80 B (2024) | Global Consultancy A | Includes cable management and accessories, relies on single top-down pass |
| USD 221.19 B (2024) | Industry Journal B | Excludes optical fiber revenue, conservative ASP progression |
| USD 254.00 B (2024) | Trade Service C | Uses capital-spend proxies without shipment validation |
The comparison shows that scope breadth and price modeling explain most variance, and it confirms that Mordor's disciplined mix of validated volumes and region-specific pricing offers a dependable, replicable baseline for planners and investors.


Key Questions Answered in the Report
How large is the wire and cable market in 2026?
The wire and cable market size stood at USD 245.44 billion in 2026 and is projected to reach USD 315.78 billion by 2031.
Which segment is growing fastest by voltage rating?
Extra- and high-voltage cables above 35 kilovolts are expected to advance at a 7.91% CAGR through 2031, outpacing other voltage tiers.
What drives demand for fiber-optic cables?
5G backhaul, cloud data-center interconnects and fiber-to-the-home mandates in Asia Pacific and the Middle East are lifting fiber-optic demand at an 8.62% CAGR.
Why is aluminum gaining share over copper?
Aluminum conductor steel-reinforced designs help utilities mitigate copper price volatility and reduce tower loading, supporting a 6.84% CAGR for aluminum conductors.
Which region is forecast to post the highest growth rate?
Africa is projected to register a 7.23% CAGR to 2031, backed by multilateral funding for cross-border power pools and national electrification programs.
What is the biggest supply-chain risk facing cable makers?
Tight cross-linked polyethylene resin supply is the most immediate bottleneck, extending lead times for extra-high-voltage cables and delaying offshore wind connections.
Page last updated on:


