Reusable Foodservice Packaging Market Size and Share
Market Overview
| Study Period | 2020 - 2031 |
|---|---|
| Market Size (2026) | USD 46.19 Billion |
| Market Size (2031) | USD 61.37 Billion |
| Growth Rate (2026 - 2031) | 5.85% CAGR |
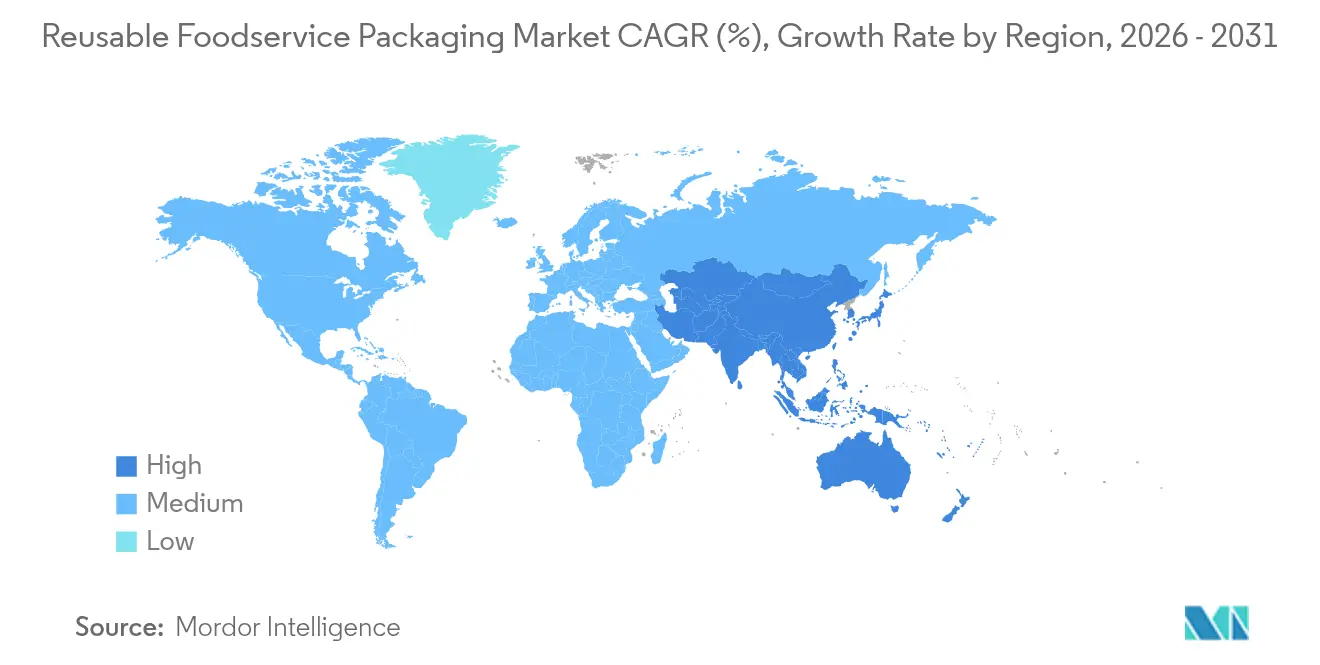
| Fastest Growing Market | Asia Pacific |
| Largest Market | North America |
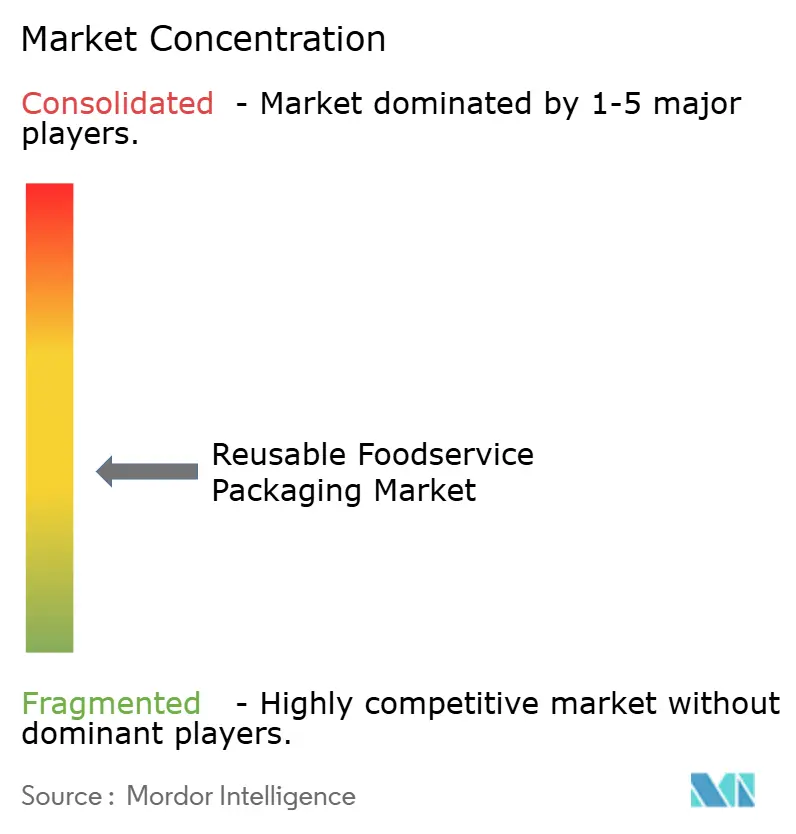
| Market Concentration | Medium |
Major Players *Disclaimer: Major Players sorted in no particular order Image © Mordor Intelligence. Reuse requires attribution under CC BY 4.0. | |
Reusable Foodservice Packaging Market Analysis by Mordor Intelligence
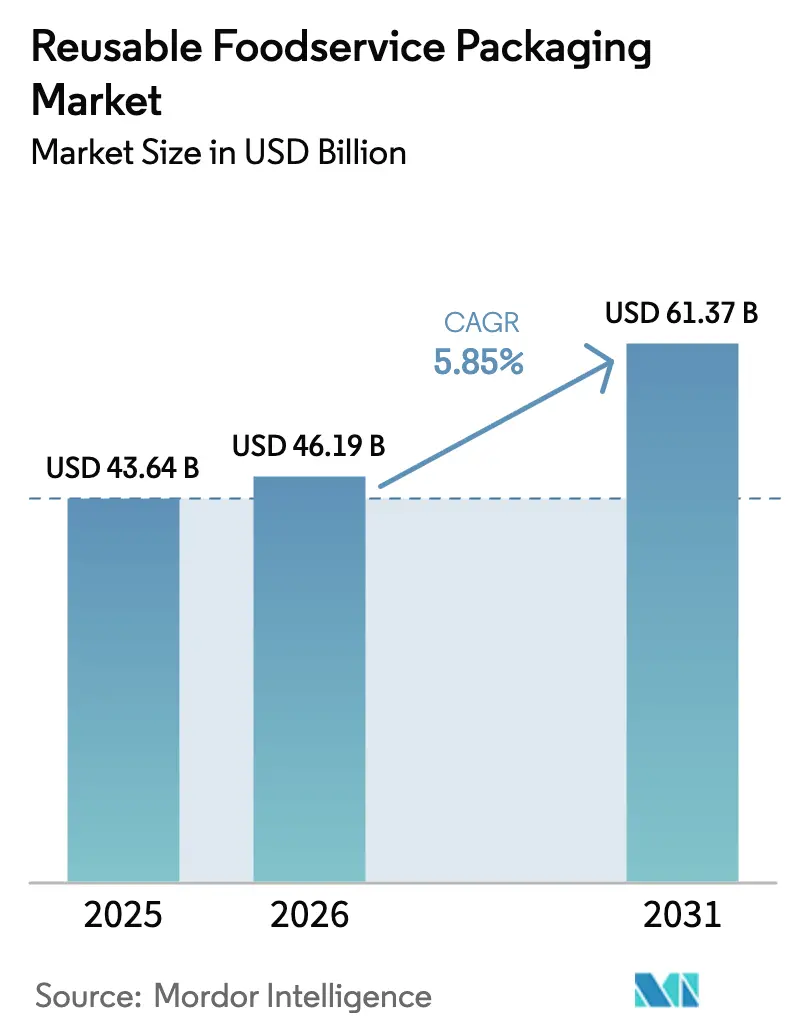
The reusable foodservice packaging market size was valued at USD 43.64 billion in 2025 and estimated to grow from USD 46.19 billion in 2026 to reach USD 61.37 billion by 2031, at a CAGR of 5.85% during the forecast period (2026-2031). Continuous regulatory pressure, especially Extended Producer Responsibility rules, is moving brands toward circular systems. Corporate sustainability targets add momentum and spur partnerships that standardize container formats and digital-tracking methods. Rapid trials by food-delivery platforms, new material launches that cut fossil inputs, and RFID deployment in quick-service outlets are further strengthening the value proposition. At the same time, cost hurdles tied to reverse logistics and limited dish-washing capacity in dense urban areas continue to constrain adoption.
Key Report Takeaways
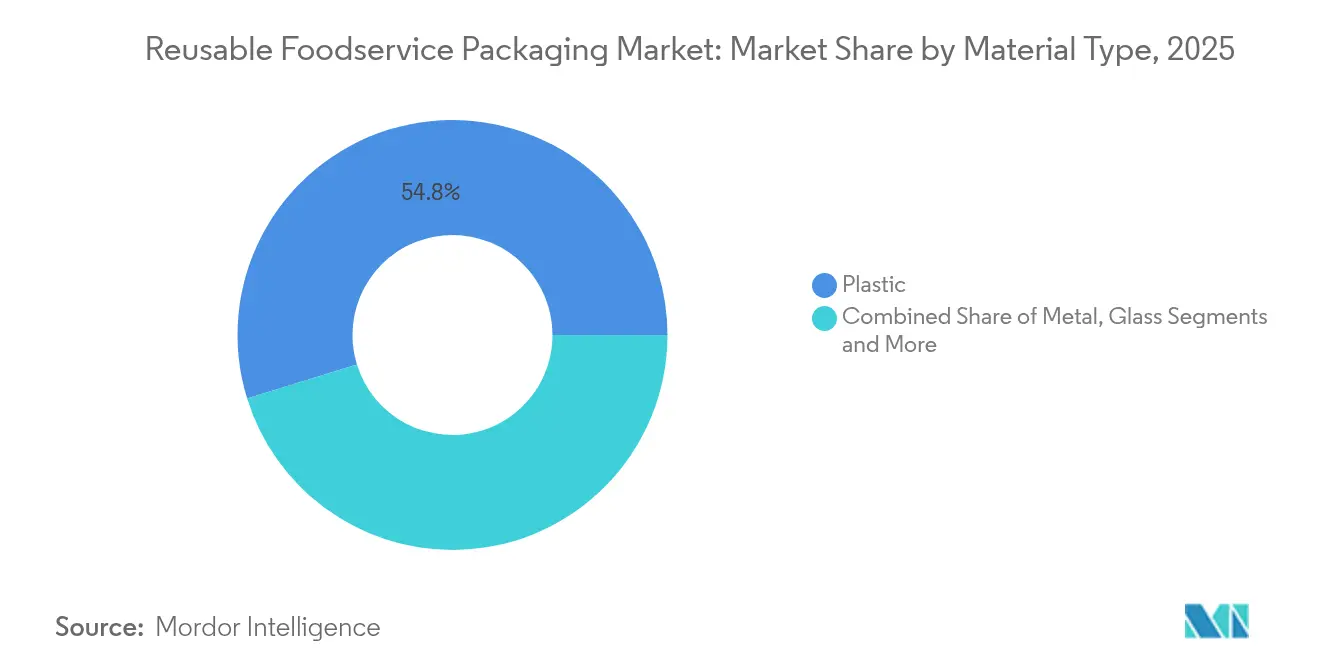
- By material, plastic held 54.78% of reusable foodservice packaging market share in 2025, while silicone and fiber-based options are forecast to grow at an 7.55% CAGR to 2031.
- By product type, cups and lids led with 42.95% revenue share in 2025; bottles and tumblers are projected to expand at an 6.54% CAGR through 2031.
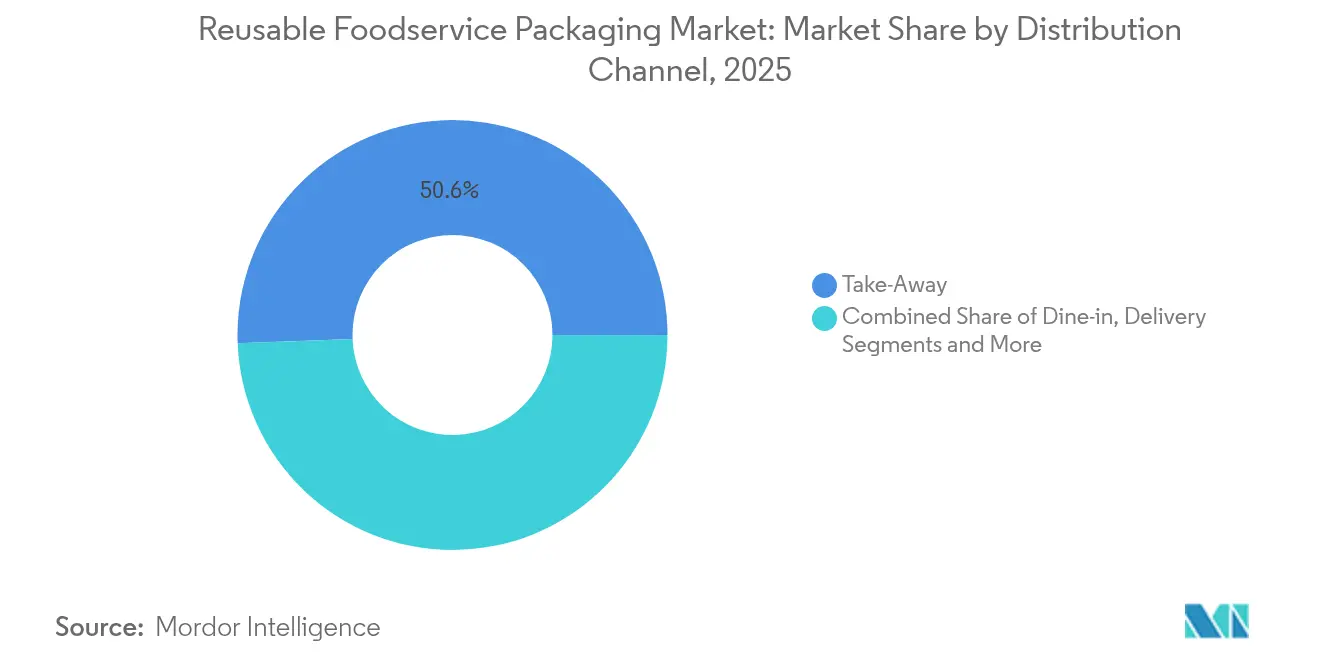
- By distribution channel, take-away operations accounted for 50.62% of the reusable foodservice packaging market size in 2025, whereas delivery services show the highest projected CAGR at 7.29% between 2026 and 2031.
- By end-user, quick-service restaurants controlled 40.15% of 2025 revenue, yet transportation catering is advancing at a 6.02% CAGR to 2031.
- By geography, North America dominated with 36.55% share in 2025; Asia-Pacific is rising the fastest at a 7.02% CAGR through 2031.
Note: Market size and forecast figures in this report are generated using Mordor Intelligence’s proprietary estimation framework, updated with the latest available data and insights as of 2026.
Global Reusable Foodservice Packaging Market Trends and Insights
Drivers Impact Analysis*
| Driver | (~) % Impact on CAGR Forecast | Geographic Relevance | Impact Timeline |
|---|---|---|---|
| Growth of online food-delivery aggregators | +1.2% | Global, with concentration in urban markets | Medium term (2-4 years) |
| Single-use-plastic bans across OECD and BRICS | +1.8% | OECD countries, expanding to BRICS nations | Short term (≤ 2 years) |
| Brand ESG commitments and reporting pressure | +0.9% | Global, led by North America and Europe | Long term (≥ 4 years) |
| Campus closed-loop pilots proving ROI | +0.6% | North America and Asia-Pacific educational hubs | Medium term (2-4 years) |
| Rise of reusable-packaging SaaS tracking platforms | +0.8% | Developed markets with digital infrastructure | Medium term (2-4 years) |
| Bulk-dispense formats in QSR drive-thru lanes | +0.4% | North America QSR chains | Short term (≤ 2 years) |
| Source: Mordor Intelligence | |||
Growth of Online Food-Delivery Aggregators
Food-delivery giants now run city-wide pilots that unify container types, absorb recovery costs, and give restaurants app-based return prompts. Uber Eats scaled programs from Canada to multiple United States metros in 2024, partnering with Suppli and Reusables.com to pool washing and redistribution tasks. DoorDash launched similar initiatives in Los Angeles, leveraging route density to keep transport emissions low and containers in rapid rotation. Aggregators’ mobile apps notify customers about return points and make deposits refundable, which lifts return rates and cuts leakage losses.
Single-Use-Plastic Bans Across OECD and BRICS
Mandatory targets tighten every year. France requires 10% reuse by 2027 and Germany’s 2023 rule obliges food outlets to offer a reusable option, although first-year take-up reached only 1.6%. Vietnam’s January 2024 law set 22% recycling for rigid PET plus 40% material recovery, driving suppliers to favor packages that can circulate many times. In the United States, Minnesota’s 2025 act forces all covered packaging to be reusable, refillable, recyclable, or compostable by 2032. Early movers that build reuse networks ahead of enforcement deadlines gain supply-chain resilience and goodwill from regulators.
Brand ESG Commitments and Reporting Pressure
Companies must publish measurable packaging targets under evolving ESG disclosure norms. Huhtamaki commits to 100% recyclable, compostable, or reusable items by 2030. Nestlé and Unilever test refill stations and durable packs that capture primary data on waste reduction, thereby satisfying investor screens for climate performance. The Canadian Plastics Pact reported that half of member packaging already meets design-for-recycling or reuse criteria in its 2024 update.
Campus Closed-Loop Pilots Proving ROI
Universities offer closed environments ideal for experimentation. Chinese campuses showed positive ROI once containers cycled at least 20 times, according to peer-reviewed studies. Arizona State University’s arena program with Bold Reuse and Swire Coca-Cola demonstrated smooth on-site washing and automated check-in systems. Data from such trials inform municipal tenders and private-sector rollouts.
Restraints Impact Analysis*
| Restraint | (~) % Impact on CAGR Forecast | Geographic Relevance | Impact Timeline |
|---|---|---|---|
| Food-safety and cross-contamination concerns | -0.8% | Global, particularly in regulated markets | Short term (≤ 2 years) |
| High reverse-logistics cost for wide-area programs | -1.4% | Suburban and rural markets globally | Long term (≥ 4 years) |
| Municipal dish-washing capacity bottlenecks | -0.6% | Urban centers with limited infrastructure | Medium term (2-4 years) |
| EPR fee-structure favoring recyclable over reusable | -0.5% | Regions with established EPR frameworks | Medium term (2-4 years) |
| Source: Mordor Intelligence | |||
Food-Safety and Cross-Contamination Concerns
Regulators demand validated sanitation protocols. The United States FDA requires any reusable food-contact surface to comply with 21 CFR 174, which adds testing expenses for smaller brands[1]Food and Drug Administration, “21 CFR 174 Food-Contact Substances,” fda.gov. Industry guidance from the Reusable Packaging Association outlines rigorous wash temperatures and detergent specs. Surveys in Germany found hygiene fears as a top barrier to consumer uptake, spurring R&D on antimicrobial coatings and bio-based films.
High Reverse-Logistics Cost for Wide-Area Programs
When collection density is low, transport outweighs container value. A McKinsey model for take-away meals showed costs could double and emissions rise 150% at poor rotation rates. Research highlights tracking, ownership structure, and consumer incentives as the levers that decide financial feasibility. CEVA Logistics pilots IoT-enabled tote boxes, posting 60% CO₂ savings, yet admits suburban routes still challenge profitability.
*Our forecasts treat driver/restraint impacts as directional, not additive. The impact forecasts reflect baseline growth, mix effects, and variable interactions.
Segment Analysis
By Material Type: Plastic Dominance Drives Innovation
Plastic captured 54.78% of 2025 revenue and anchors the reusable foodservice packaging market. Operators favor polypropylene and polyethylene containers that survive hundreds of commercial wash cycles without warping. The reusable foodservice packaging market size attributed to plastic is slated to advance in line with the 5.85% overall CAGR, yet its share erodes gradually as silicone and molded fiber products scale. Brand owners respond by launching bio-circular resins such as Braskem’s WENEW polypropylene derived from used cooking oil, which maintains mechanical properties while cutting virgin feedstock dependence.
Silicone and fiber-based lines grow at an 7.55% CAGR, fueled by PFAS-free barrier tech. Dart Container’s dry-molded fiber, Genpak’s PFAS-free dishes, and Sabert’s high-heat Pulp Ultra illustrate how suppliers close the performance gap with legacy plastics. Metal remains entrenched in institutional kitchens, while glass lags due to breakage risk and shipping weight.
Cost parity is still elusive for alternative substrates, but regional bans on certain plastic additives speed up adoption. Municipal dish-washing upgrades increasingly accommodate mixed material streams, supporting operational flexibility. As bio-circular polymers reach higher output volumes, the reusable foodservice packaging market share held by plastics is predicted to dip below 50% after 2031, opening space for compostable fibers and advanced silicones that combine heat resistance with lightweight profiles.


By Product Type: Beverage Containers Lead Market Evolution
Cups and lids represented 42.95% of 2025 sales, reflecting coffee chains’ early shift to deposit-return programs. The reusable foodservice packaging market size for bottles and tumblers is expanding fastest at a 6.54% CAGR because personal hydration aligns with workplace wellness initiatives. Smartchip-enabled bottles now relay fill counts to mobile apps, rewarding users with loyalty points and lowering loss rates. Starbucks’ February 2025 in-store refill program demonstrated how experiential aspects, including handwritten names, can boost customer satisfaction while eliminating single-use cups.Trays and nested bowl systems target campus dining, where standardized footprints maximize rack density and washing throughput. Clamshell uptake is slower owing to hinge crevice sanitation challenges, but design tweaks like snap-fit hinges and wider radii improve cleanability. Corrugated reusable cartons serve catering and meal-kit firms that need stack strength plus moisture resistance. Product evolution centers on weight reduction, stack optimization, and embedded IDs to fit automated sort lines.
By Distribution Channel: Delivery Services Drive Digital Integration
Traditional take-away windows still commanded 50.62% of the reusable foodservice packaging market in 2025. Delivery services, however, log the highest 7.29% CAGR because platform apps streamline container check-out, payment, and return scheduling. Uber Eats pilots provide customers with map-based drop points, lowering abandonment and supporting asset turns of more than 30 cycles per year. Dine-in scenarios maintain steady share because immediate returns remove logistics variables, yet growth is capped by slower footfall. Events and catering segments benefit from bulk issuance, which cuts unit handling time. The digital backbone of delivery channels underpins dynamic fee structures that discount orders when customers return containers quickly, fostering a virtuous cycle of higher reuse rates and stronger economics.
By End-User Industry: Transportation Catering Emerges as Growth Leader
Quick-service restaurants owned 40.15% of 2025 spending thanks to uniform menu items and centralized supply chains. Transportation catering, led by airlines, grows 6.02% annually as carriers integrate durable tableware into cabin decarbonization plans. Etihad and deSter won a 2025 Red Dot Award for lightweight polypropylene trays that withstand repeated autoclave cycles while fitting existing galley equipment.Institutional feeders like corporate campuses and hospitals advance steadily because centralized washing supports high container turns. Full-service restaurants lag on account of menu diversity and space constraints for onsite dishwashing. Sports venues test closed-loop beer cup schemes using RFID chips to return deposits at exit gates, creating data sets that support fine-tuned stocking for future games.
Geography Analysis
North America held a 36.55% revenue share in 2025, underpinned by state-level EPR statutes in Oregon, California, and Colorado. United States operators benefit from mature waste-management vendors that can scale wash hubs quickly. The reusable foodservice packaging market size in the region is projected to increase steadily, although growth is more incremental compared with emerging regions.
Asia-Pacific records the swiftest expansion at a 7.02% CAGR. Dense urban centers shorten return routes, while sweeping EPR mandates in Vietnam, China, and Japan compel businesses to embrace multi-use containers. Australia’s 2024 regulatory overhaul proposes mandatory recycled content, pushing chains to hedge with reusable programs that sidestep material quotas.
Europe maintains robust policy leadership through the Packaging and Packaging Waste Regulation that targets 100% recyclable packaging and 10% beverage reuse by 2030. Germany’s modest 1.6% first-year uptake highlights enforcement gaps, but the rule spurs investment in washing depots and standardized cup libraries. South America and Middle East/Africa trail in volume, yet global brand mandates carry reuse pilots into major cities such as São Paulo and Dubai, preparing these markets for accelerated growth once local regulations converge.

Competitive Landscape
The sector remains moderately fragmented but is entering a consolidation phase. Novolex’s USD 6.7 billion purchase of Pactiv Evergreen in April 2025 created a top-tier supplier with 250 brands and 39,000 SKUs dedicated to sustainable formats. Sonoco’s USD 3.9 billion acquisition of Eviosys in June 2024 deepened its metal packaging reach across Europe, the Middle East, and Africa.
Technology partnerships are critical. McDonald’s France works with Checkpoint Systems for large-scale RFID deployment, highlighting how fast-food leaders blend hardware with data analytics. Start-ups such as DeliverZero and Muuse specialize in reusable delivery parcels, often white-labeling their software for restaurant chains. Logistics firms trial IoT bins and blockchain ledgers to verify wash cycles and custody transfers.
Barriers to entry rise as integrated models that cover material science, molding, reverse-logistics, and SaaS gain favor among multinationals seeking turnkey solutions. Nonetheless, niche providers can thrive by focusing on suburban routing or event-venue segments where large incumbents have limited reach. Intellectual-property portfolios around antimicrobial surfaces and track-and-trace algorithms further differentiate suppliers.
Reusable Foodservice Packaging Industry Leaders
Berry Global Inc.
Ecolab services
deSter Corporation
Pactiv Evergreen Inc.
Genpak LLC
- *Disclaimer: Major Players sorted in no particular order

Recent Industry Developments
- June 2025: Sojo Industries raised USD 40 million Series B to scale its modular packaging lines and blockchain logistics platform.
- May 2025: Novolex and Pactiv Evergreen finalized a USD 6.7 billion merger to broaden recyclable, compostable, and reusable offerings.
- April 2025: Mother Parkers Tea & Coffee introduced the Boardio paperboard canister with Graphic Packaging, cutting plastic use 50% and earning How2Recycle certification.
- January 2025: Minnesota enacted the Packaging Waste and Cost Reduction Act, mandating reusable, refillable, recyclable, or compostable packaging by 2032.


Global Reusable Foodservice Packaging Market Report Scope
Reusable packaging denotes containers and packaging materials crafted for multiple uses. This approach not only curtails waste but also offers a circular economy. Such solutions, known for their durability and efficiency, present an eco-friendly and sustainable substitute for conventional single-use packaging. Based on current trends and market dynamics, the study tracks and analyzes the demand for reusable packaging within the food service industry. The market numbers are derived by tracking the revenue generated by players providing reusable packaging products across the end-user industries. The study provides a detailed breakdown of the various types of material across different geographies.
The reusable foodservice market is segmented by material type (metal, plastic, glass, and other material types), product type (corrugated boxes and cartons, bottles and glasses, trays, plates, food containers, and bowls, cups and lids, clamshells, and other product types), end-user industry (quick-service restaurants {QSR}, full-service restaurants {FSR}, institutional, hospitality, and other end-user industries), geography (North America {United States, Canada}, Europe {United Kingdom, Germany, France, Italy, Spain, and Rest of Europe}, Asia-Pacific {China, India, Japan, Australia and New Zealand, and Rest of Asia-Pacific}, Latin America {Brazil, Mexico, Argentina, and Rest of Latin America}, Middle East and Africa {United Arab Emirates, Saudi Arabia, South Africa, and Rest of Middle East and Africa}). The report offers market sizes and forecasts in value (USD) for all the above segments.
| Metal |
| Plastic |
| Glass |
| Silicone and Fiber-Based |
| Corrugated Boxes and Cartons |
| Bottles and Tumblers |
| Trays, Plates, Containers and Bowls |
| Cups and Lids |
| Clamshells |
| Dine-in |
| Take-Away |
| Delivery |
| Catering and Events |
| Quick-Service Restaurants (QSR) |
| Full-Service Restaurants (FSR) |
| Institutional Catering |
| Hospitality and Leisure |
| Transportation Catering |
| North America | United States | |
| Canada | ||
| Mexico | ||
| Europe | Germany | |
| United Kingdom | ||
| France | ||
| Italy | ||
| Spain | ||
| Rest of Europe | ||
| Asia-Pacific | China | |
| Japan | ||
| India | ||
| South Korea | ||
| Australia | ||
| Rest of Asia-Pacific | ||
| South America | Brazil | |
| Argentina | ||
| Rest of South America | ||
| Middle East and Africa | Middle East | Saudi Arabia |
| United Arab Emirates | ||
| Turkey | ||
| Rest of Middle East | ||
| Africa | South Africa | |
| Egypt | ||
| Nigeria | ||
| Rest of Africa | ||
| By Material Type | Metal | ||
| Plastic | |||
| Glass | |||
| Silicone and Fiber-Based | |||
| By Product Type | Corrugated Boxes and Cartons | ||
| Bottles and Tumblers | |||
| Trays, Plates, Containers and Bowls | |||
| Cups and Lids | |||
| Clamshells | |||
| By Distribution Channel | Dine-in | ||
| Take-Away | |||
| Delivery | |||
| Catering and Events | |||
| By End-User Industry | Quick-Service Restaurants (QSR) | ||
| Full-Service Restaurants (FSR) | |||
| Institutional Catering | |||
| Hospitality and Leisure | |||
| Transportation Catering | |||
| By Geography | North America | United States | |
| Canada | |||
| Mexico | |||
| Europe | Germany | ||
| United Kingdom | |||
| France | |||
| Italy | |||
| Spain | |||
| Rest of Europe | |||
| Asia-Pacific | China | ||
| Japan | |||
| India | |||
| South Korea | |||
| Australia | |||
| Rest of Asia-Pacific | |||
| South America | Brazil | ||
| Argentina | |||
| Rest of South America | |||
| Middle East and Africa | Middle East | Saudi Arabia | |
| United Arab Emirates | |||
| Turkey | |||
| Rest of Middle East | |||
| Africa | South Africa | ||
| Egypt | |||
| Nigeria | |||
| Rest of Africa | |||


Key Questions Answered in the Report
What is the reusable foodservice packaging market size in 2026?
It stands at USD 46.19 billion and is forecast to reach USD 61.37 billion by 2031 at a 5.85% CAGR.
Which material leads the reusable foodservice packaging market?
Plastic holds 54.78% share because of durability and cost advantages, although silicone and fiber grow faster at an 7.55% CAGR.
How fast is the delivery channel growing for reusable foodservice packaging?
Delivery services show the highest growth at an 7.29% CAGR as aggregator apps manage container returns and tracking.
Which region grows the quickest?
Asia-Pacific advances at an 7.02% CAGR, driven by stringent EPR rules and high urban density that lowers return logistics costs.
Why are airlines important to the reusable foodservice packaging industry?
Transportation catering records a 6.02% CAGR because controlled cabin environments enable high container turns, and airlines use reuse to meet carbon targets.
What are the main barriers to scale?
Food-safety compliance and reverse-logistics expenses remain the top challenges, especially in low-density service areas where collection costs outweigh benefits.
Page last updated on:


