Stick Packaging Market Size and Share
Market Overview
| Study Period | 2020 - 2031 |
|---|---|
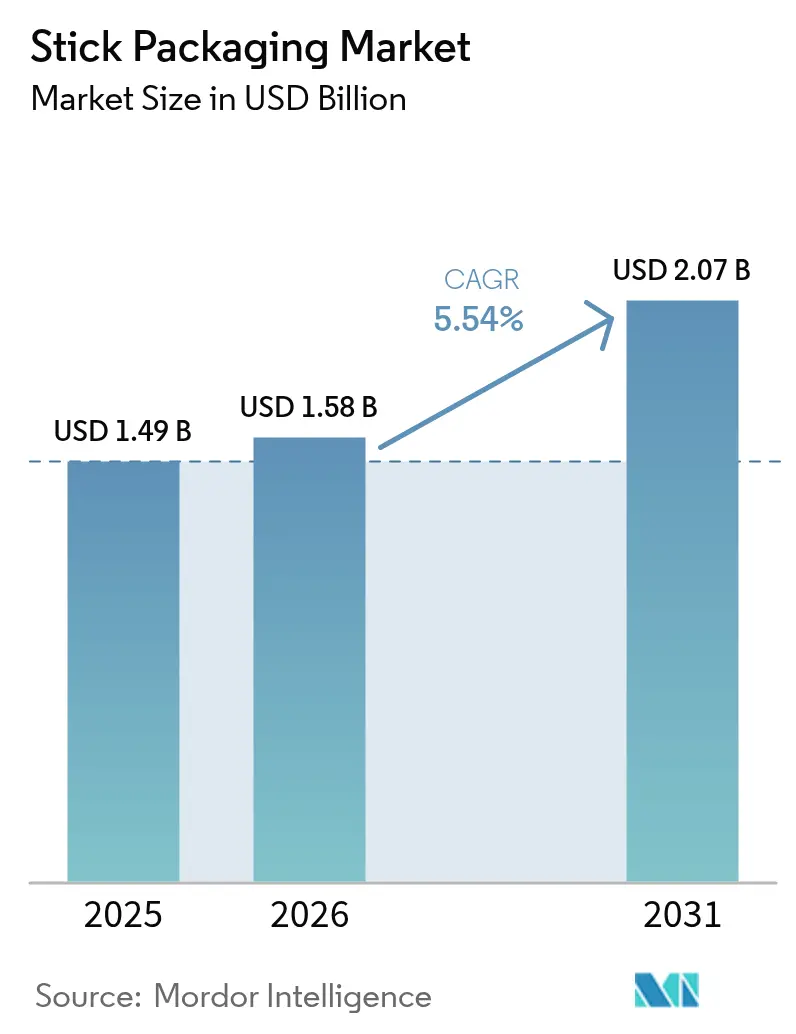
| Market Size (2026) | USD 1.58 Billion |
| Market Size (2031) | USD 2.07 Billion |
| Growth Rate (2026 - 2031) | 5.54% CAGR |
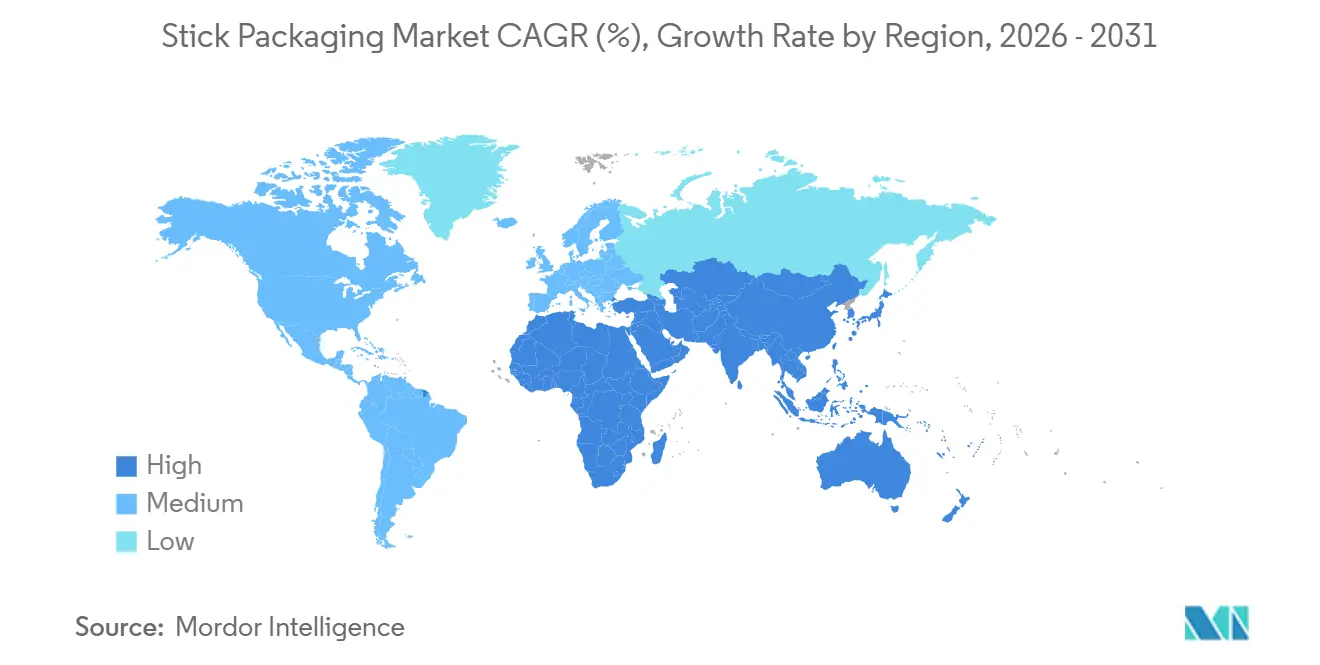
| Fastest Growing Market | Middle East and Africa |
| Largest Market | Asia Pacific |
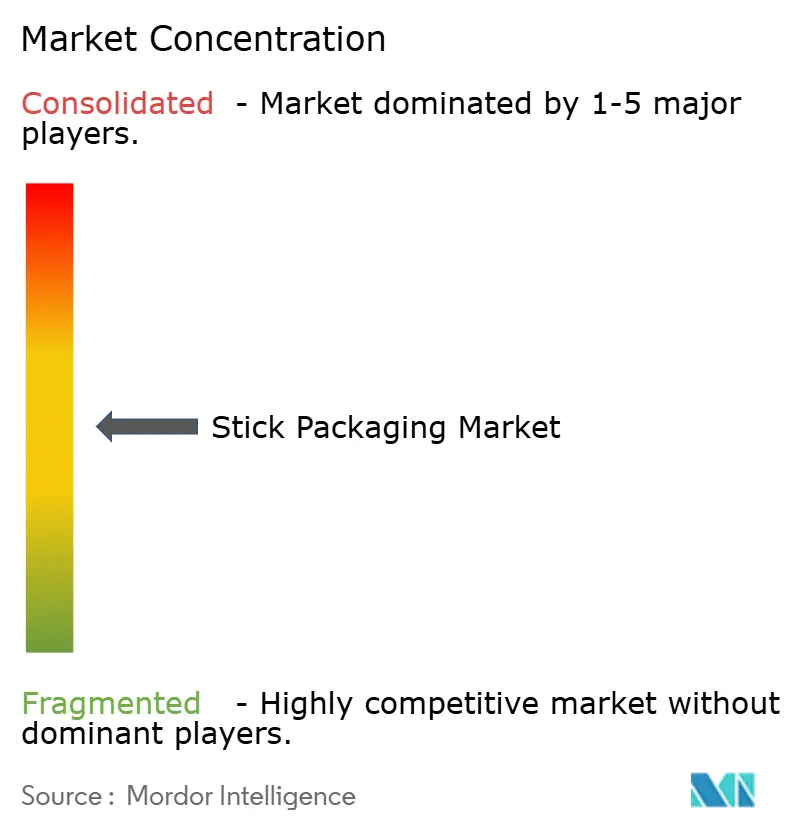
| Market Concentration | Medium |
Major Players *Disclaimer: Major Players sorted in no particular order Image © Mordor Intelligence. Reuse requires attribution under CC BY 4.0. | |
Stick Packaging Market Analysis by Mordor Intelligence
The Stick Packaging Market size is projected to expand from USD 1.49 billion in 2025 and USD 1.58 billion in 2026 to USD 2.07 billion by 2031, registering a CAGR of 5.54% between 2026 to 2031.
Rapid urban lifestyles, rising demand for precise micro-dosing in pediatrics and nutraceuticals, and smart barrier coatings that remove the need for desiccant inserts are reshaping pack design. Brand owners are pivoting toward compostable and mono-material films to comply with extended producer responsibility laws, while contract manufacturers accelerate multi-lane automation to meet serialization and traceability rules. Material lightweighting cuts freight bills and helps companies reach climate targets, and e-commerce bundles of functional beverages and collagen peptide sticks are creating recurring revenue streams. Competitive dynamics remain moderate because global film converters leverage cleanroom assets and barrier-coating know-how, while regional machinery specialists win programs by demonstrating rapid format changeovers.
Key Report Takeaways
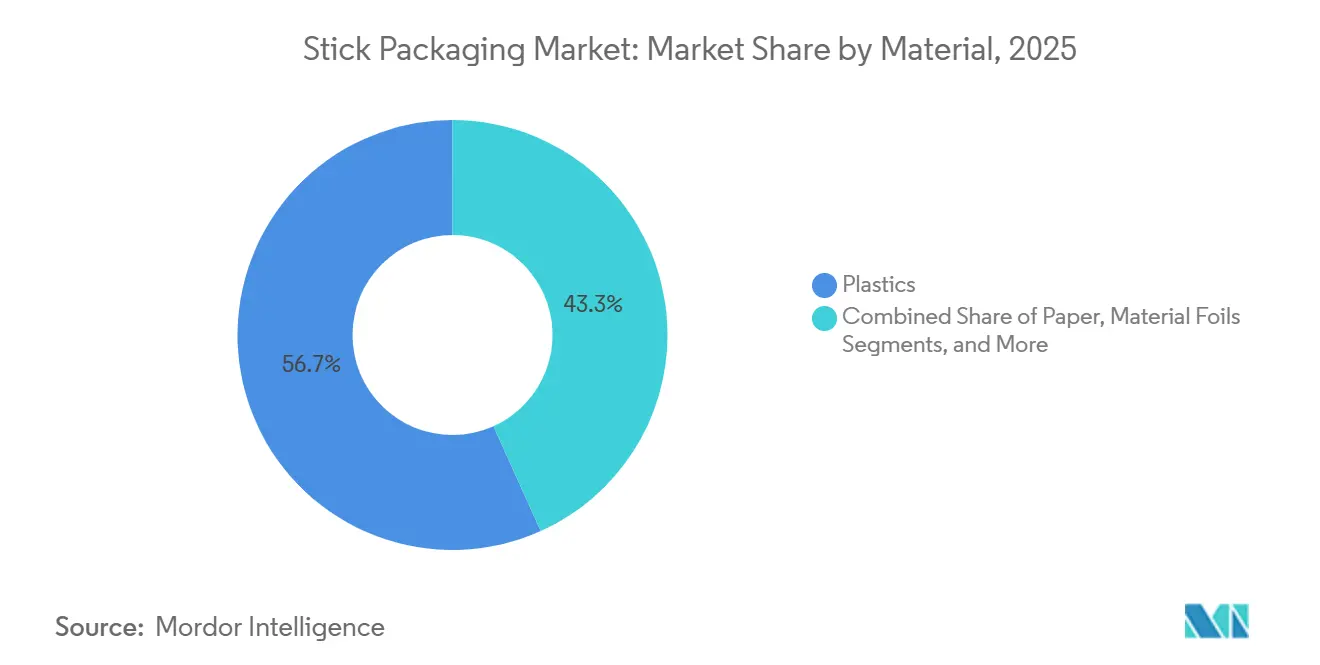
- By material, plastics led with 56.74% revenue share in 2025 of the stick packaging market, whereas bioplastics are on track to post the fastest 6.34% CAGR through 2031.
- By product form, powders accounted for 42.34% of the stick packaging market share in 2025, and liquids are projected to expand at a 6.29% CAGR during 2026-2031.
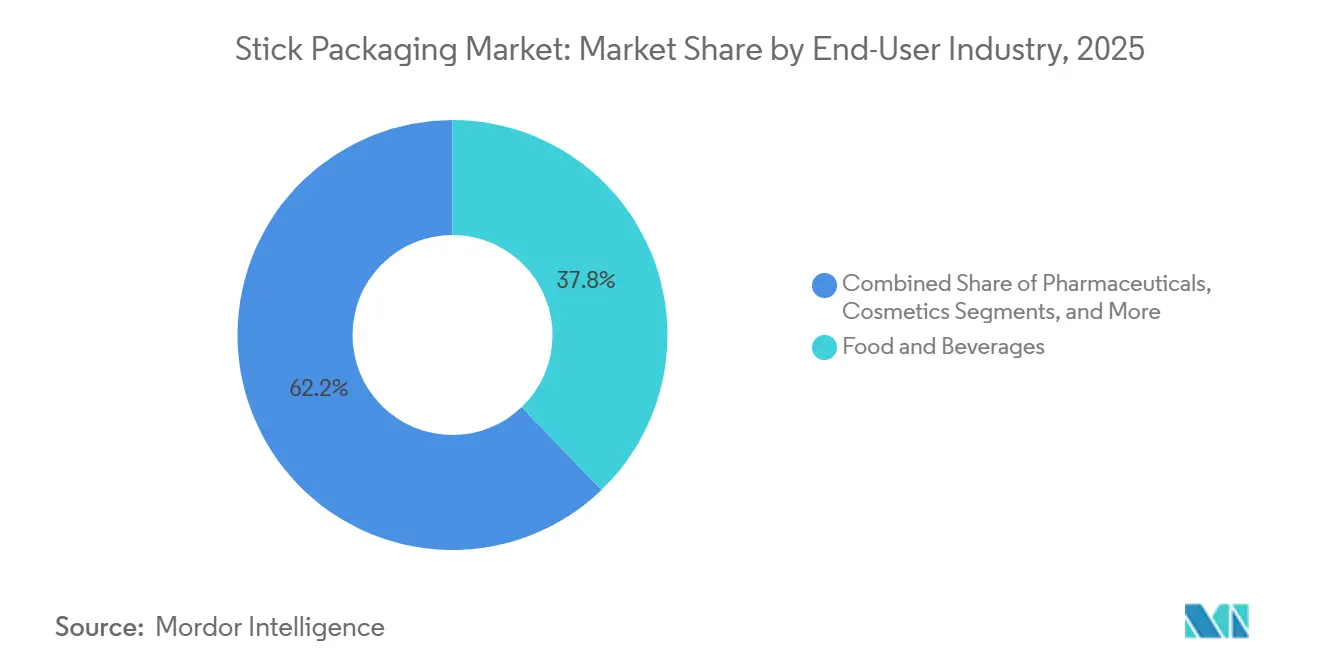
- By end-user industry, food and beverages accounted for 37.81% of the stick packaging market's revenue share in 2025, while nutraceutical powders within this group are advancing at a 6.41% CAGR through 2031.
- By packaging-machinery lane count, 4-10 lane systems commanded 44.47% of the 2025 base, but 11-20 lane equipment is forecast to grow at a 6.37% CAGR to 2031.
- By geography, Asia-Pacific captured 32.76% revenue share of the stick packaging market in 2025, and the Middle East is expected to log the quickest 6.52% CAGR through 2031
Note: Market size and forecast figures in this report are generated using Mordor Intelligence’s proprietary estimation framework, updated with the latest available data and insights as of 2026.
Global Stick Packaging Market Trends and Insights
Drivers Impact Analysis*
| Driver | (~) % Impact on CAGR Forecast | Geographic Relevance | Impact Timeline |
|---|---|---|---|
| Convenience and On-the-Go Consumption Boom | +1.2% | Global, early adoption in North America, Europe, and urban Asia-Pacific | Short Term (≤ 2 years) |
| Demand for Material and Weight Reduction | +0.9% | Global, strongest in Europe and North America | Medium Term (2–4 years) |
| Sustainability Mandates for Flexible Packs | +1.1% | Europe and North America core, spill-over to Asia-Pacific and Middle East | Medium Term (2–4 years) |
| Pharma Micro-Dosing and Pediatric Formats | +0.8% | Global, focused on North America, Europe, and India | Long Term (≥ 4 years) |
| Smart Moisture-Activated Barrier Coatings | +0.6% | Global, first movers in North America and Europe | Long Term (≥ 4 years) |
| Rise of Functional Beverage Stick Packs in Micro-Fulfillment | +0.5% | Urban North America, Europe, and select Asia-Pacific metros | Short Term (≤ 2 years) |
| Source: Mordor Intelligence | |||
Convenience and On-The-Go Consumption Boom
Millennial and Gen Z shoppers favor single-serve formats that slip into backpacks, gym bags, and hospitality trays, so instant coffee, electrolyte mixes, and probiotic powders now appear in subscription bundles that create predictable annuity volumes for co-packers. The empty rate of more than 95% minimizes product waste, an attribute valued in emerging economies where disposable incomes rise faster than recycling infrastructure. Vending operators and office caterers buy 250- to 1,000-count cases to reduce restocking labor, while endurance-sports brands release customizable electrolyte sticks that replace heavy ready-to-drink bottles.
Demand For Material and Weight Reduction
Slim sticks use 10-40% less film than pillow pouches, lowering carbon per shipped unit and unlocking freight savings that compound across high-volume beverage powders. Converters stretch mono-polyethylene films and deploy ultra-thin foils that still keep moisture-vapor transmission below 0.5 g/m²-day, and new fiber-based structures like FunctionalBarrier Paper Ultimate achieve grease and moisture resistance without plastic coatings.[1]Mondi Group, “Mondi launches FunctionalBarrier Paper Ultimate,” mondigroup.com Pharmaceutical cold-chain shippers report that lighter pack weight improves box payload efficiency and trims dry-ice use in temperature-controlled lanes.
Sustainability Mandates For Flexible Packs
The European Union’s packaging waste rule, effective 2025, requires recyclability or reuse by 2030, pushing converters to drop polyamide-aluminum barriers in favor of mono-PE or mono-PP films compatible with curbside collection.[2]European Commission, “Packaging waste,” environment.ec.europa.eu Canadian federal registries and several U.S. states apply fee modulation, so mono-material designs win lower compliance costs. Amcor’s high-shield medical laminate employs plasma-deposited coatings on all-polyethylene film, delivering a sub-1 g/m²-day moisture barrier and full compatibility with the PE recycling stream.[3]Amcor, “Amcor launches recycle-ready high-shield medical laminates,” amcor.com
Pharma Micro-Dosing And Pediatric Formats
Unit-dose sticks prevent dosing errors in acetaminophen and antihistamine powders and simplify adherence for children and seniors. The U.S. Food and Drug Administration requires milliliter-only dosing devices, and stick packs meet that requirement by pre-measuring drug loads. Contract development organizations equip cleanroom lines with 2D barcodes and full aggregation to satisfy the U.S. Drug Supply Chain Security Act serialization, trimming launch lead times for over-the-counter brands.
Restraints Impact Analysis*
| Restraint | (~) % Impact on CAGR Forecast | Geographic Relevance | Impact Timeline |
|---|---|---|---|
| Single-Use Plastic Regulation Tightening | -0.7% | Europe and North America, emerging in Asia-Pacific coastal states | Short Term (≤ 2 years) |
| Limited Recyclability of Multi-Layer Films | -0.5% | Global, highest pressure in Europe and North America | Medium Term (2–4 years) |
| Barrier-Grade Mono-Material Film Shortage | -0.4% | Global, supply gaps in Asia-Pacific and Europe | Medium Term (2–4 years) |
| Volatile Nitrosamine Contamination Risk | -0.3% | Pharmaceutical supply chains worldwide | Long Term (≥ 4 years) |
| Source: Mordor Intelligence | |||
Single-Use Plastic Regulation Tightening
Jurisdictions impose bans, taxes, or reporting duties on disposable plastic packs, penalizing multi-layer laminates that cannot pass material-recovery facility sortation. California’s fee differential can reach 50% between recyclable and non-recyclable formats, and Canada’s nationwide plastics registry requires annual tonnage reports, adding an administrative layer that discourages complex films [4]Environment and Climate Change Canada, “Reduce plastic waste,” canada.ca. As a result, converters accelerate R&D spending on paper and bio-PE sticks, lengthening qualification cycles and increasing capital outlays.
Volatile Nitrosamine Contamination Risk Limits Stick Sachet Use In Pharma
Regulators found that heat-sealed multi-layer laminates may leach nitrosamines, molecules linked to carcinogenicity, so the FDA and the European Medicines Agency urge extractable studies before pack approval. Testing can extend timelines by up to 12 months and sometimes necessitates reformulating adhesives or substituting aluminum foil, adding cost and weight. Smaller contract packers that cannot run high-performance liquid chromatography in-house must outsource analysis, raising barriers to entry and concentrating share among vertically integrated suppliers.
*Our forecasts treat driver/restraint impacts as directional, not additive. The impact forecasts reflect baseline growth, mix effects, and variable interactions.
Segment Analysis
By Material: Bioplastics Push Compostability Boundaries
Plastics accounted for 56.74% of the stick packaging market revenue in 2025 because polyethylene balances cost, seal strength, and moisture protection. The stick packaging market size for plastics remains significant, yet bioplastics are forecast to post a 6.34% CAGR as brand owners seek industrial-composting claims. Polylactic acid and polyhydroxyalkanoate films enable organic waste bin disposal in Western Europe, but their 5 g/m²-day moisture-vapor transmission rate throttles the use of low-water-activity powders. Cellulose-based compostable sachets now enter condiment and cosmetic sample niches, while aluminum foil stays indispensable where oxygen transmission below 0.01 cm³/m²-day is mandatory.
Paper sticks gain share in sugar and sweetener applications thanks to uncoated kraft that can be dropped directly into existing paper recycling streams. Yet converters must run at higher sealing temperatures to overcome paper porosity, thereby increasing energy use. The paper stick packaging market share is likely to rise only if heat-seal lacquers with lower glass transition temperatures launch at scale. Metal foils will persist for tropical pharmaceutical logistics, where 80% humidity accelerates vitamin oxidation.


By Product Form: Liquid Lines Break Viscosity Barriers
Powders retained 42.34% of 2025 revenue, but liquids are on pace for a 6.29% CAGR, as aseptic multi-lane fillers now handle suspensions up to 5,000 cP without drip or voids. Contract manufacturers operate 20-lane lines that turn out 1,600 packed units per minute, making the stick packaging market for liquids the fastest-growing among product forms. Hot-fill acidic beverages tolerate 85 °C lethality, while probiotics need ISO Class 7 cold-fill rooms.
Granules sit between powders and tablets, offering flow advantages for high-speed dosing of oral rehydration salts, and semi-solid gels exploit sticks’ hygienic single-use promise in topical ointments and eye creams. Servo-driven augers and weight-check feedback loops cut fill variance below ±1%, essential for pediatric dosing accuracy. Continuous improvement in neck-proof seals reduces leak complaints that once occurred with liquid adoption.
By End-User Industry: Nutraceutical Powders Headline Growth
Food and beverages delivered 37.81% of 2025 turnover of the stick packaging market, anchored by instant coffee sticks in hospitality and office settings. Yet nutraceutical powders inside this umbrella are pacing a 6.41% CAGR as sports nutrition and collagen peptides ride e-commerce demand. The stick packaging market share held by nutraceutical SKUs is climbing because single-serve sachets ease gym bag transport and allow precise macronutrient intake.
Pharmaceutical brands leverage sticks for analgesic granules that offer quicker onset than tablets. Child-resistant laser-scored openings meet poison prevention rules and help seniors with dexterity limitations. Cosmetics extend usage into facial masks and fragrance sampling, where mono-dose hygiene and waste minimization satisfy sustainability-minded consumers, while industrial cleaners experiment with powder sticks that dissolve in water to cut solvent freight.
By Packaging-Machinery Lane Count: Automation Lifts 11-20 Lane Systems
Machinery sporting 4-10 lanes accounted for 44.47% of 2025 revenue because it balances changeover speed with mid-volume output. Despite that lead, 11-20-lane configurations are forecast to grow at a 6.37% CAGR as contract manufacturers seek throughput gains without ballooning factory footprints. Integrated vision systems now push reject rates below 0.1%, critical for serialized pharmaceutical lines.
Single-lane rigs serve R and D batches under 10 million units, and over-20-lane goliaths stay confined to commodity sugar and coffee, where billion-unit scale amortizes capital. Quick-release tooling platforms reduce changeover time to under 30 minutes, empowering nutraceutical packers to rotate seasonal flavors more frequently. Predictive-maintenance modules flag bearing wear before failure, preserving uptime in lights-out shifts.
Geography Analysis
Asia-Pacific accounted for 32.76% of 2025 revenue, driven by China’s film extrusion base and India’s antibiotic sachet exports. Local converters imported USD 203.2 million of filling machinery in 2024, up 32.8% year-over-year, showing that the stick packaging market there is scaling modern automation. India uses unit-dose antibiotics for rural clinics lacking refrigeration, and Japanese servo-driven equipment finds buyers in North America because of micron-accurate fill weight.
The Middle East is projected to log a 6.52% CAGR to 2031, spurred by Saudi Vision 2030 mandates for local drug manufacturing and the UAE’s pharmaceutical free zones. Regional imports of packaging machinery hit EUR 1.3 billion (USD 1.46 billion) in 2024, a 25.4% annual jump. Cleanroom-grade stick lines equipped with Arabic human-machine interfaces allow exporters to serve hot-climate markets without a cold chain.
North America and Europe display mature adoption but funnel capex toward mono-material film extrusion to satisfy recycling rules. Germany shipped EUR 362.6 million (USD 407 million) of machinery abroad in 2024, with a notable share headed to Asian co-packers. South America gains momentum in Brazil and Argentina, though currency swings complicate the payback of imported equipment. Africa’s volumes remain modest outside South Africa and Egypt, but donor-funded malaria and ORS programs could seed long-term demand.
Mordor Intelligence provides coverage of the stick packaging market across other key regional markets, including North America, each with their regulatory frameworks and demand patterns.

Competitive Landscape
Market concentration stays moderate. Global majors Amcor, Constantia Flexibles and Huhtamäki command high-barrier laminate portfolios and cleanroom converting lines that appeal to regulated pharma and nutraceutical accounts. Amcor rolled out recycle-ready, plasma-coated medical laminates in February 2025, proving mono-material film can still hit sub-1 g/m²-day moisture ingress. Constantia earmarked EUR 50 million (USD 56 million) for a rolling-mill upgrade in Austria to expand pharmaceutical foil, and Huhtamäki secured EcoVadis Gold for the fifth straight year, helping downstream brands audit Scope 3 emissions.
Regional machinery specialists such as Nichrome, Viking Masek, and Aranow win bids by offering modular frames that swap auger fillers for piston pumps in under an hour. Contract development and manufacturing organizations, notably Unither Pharmaceuticals, add liquid stick capacity to capture white-space opportunities in pediatric suspensions. Suppliers integrate artificial-intelligence vision to spot crimp wrinkles in real time, slashing waste and securing high-value stability trials for tropical distribution.
Competitive edge now blends technical barrier mastery with life-cycle assessment proof. Players unable to certify mono-material recyclability face surcharges under extended producer responsibility schemes, nudging converters toward alliances with coating-chemistry startups that promise drop-in plasma layers. Those that achieve pharmaceutical validation and recyclability at scale are positioned to set price premium benchmarks.
Stick Packaging Industry Leaders
Amcor plc
Constantia Flexibles Group GmbH
Winpak Ltd.
Glenroy, Inc.
Sonoco Products Company
- *Disclaimer: Major Players sorted in no particular order

Recent Industry Developments
- August 2025: Constantia Flexibles committed more than EUR 100 million (USD 112 million) to global food and healthcare flexible capacity expansions, including a Weinburg rolling-mill upgrade.
- August 2025: Amcor added converting capacity for medical laminates in Costa Rica to serve Central and South American drug makers.
- July 2025: Huhtamäki earned EcoVadis Gold for the fifth consecutive year, reinforcing its ESG credentials.
- April 2025: Amcor started an advanced barrier-coating facility in Selangor, Malaysia to localize supply for Asian customers.


Global Stick Packaging Market Report Scope
The Stick Packaging Market Report is Segmented by Material (Plastics, Paper, Metal Foils, Bioplastics), Product Form (Powders, Granules, Liquids, Semi-Solids), End-User Industry (Food and Beverages, Pharmaceuticals, Cosmetics and Personal Care, Industrial and Household), Packaging-Machinery Lane Count (1-3 Lanes, 4-10 Lanes, 11-20 Lanes, Greater Than 20 Lanes), and Geography (North America, Europe, Asia-Pacific, Middle East, Africa, South America). Market Forecasts are Provided in Terms of Value (USD).
| Plastics |
| Paper |
| Metal Foils |
| Bioplastics |
| Powders |
| Granules |
| Liquids |
| Semi-Solids |
| Food and Beverages | Instant Beverages |
| Nutraceutical Powders | |
| Sugar and Sweeteners | |
| Pharmaceuticals | OTC |
| Rx | |
| Cosmetics and Personal Care | |
| Industrial and Household |
| 1-3 Lanes |
| 4-10 Lanes |
| 11-20 Lanes |
| Greater Than 20 Lanes |
| North America | United States |
| Canada | |
| Mexico | |
| Europe | United Kingdom |
| Germany | |
| France | |
| Italy | |
| Rest of Europe | |
| Asia-Pacific | China |
| Japan | |
| India | |
| South Korea | |
| Rest of Asia-Pacific | |
| Middle East | Israel |
| Saudi Arabia | |
| United Arab Emirates | |
| Turkey | |
| Rest of Middle East | |
| Africa | South Africa |
| Egypt | |
| Rest of Africa | |
| South America | Brazil |
| Argentina | |
| Rest of South America |
| By Material | Plastics | |
| Paper | ||
| Metal Foils | ||
| Bioplastics | ||
| By Product Form | Powders | |
| Granules | ||
| Liquids | ||
| Semi-Solids | ||
| By End-User Industry | Food and Beverages | Instant Beverages |
| Nutraceutical Powders | ||
| Sugar and Sweeteners | ||
| Pharmaceuticals | OTC | |
| Rx | ||
| Cosmetics and Personal Care | ||
| Industrial and Household | ||
| By Packaging-Machinery Lane Count | 1-3 Lanes | |
| 4-10 Lanes | ||
| 11-20 Lanes | ||
| Greater Than 20 Lanes | ||
| By Geography | North America | United States |
| Canada | ||
| Mexico | ||
| Europe | United Kingdom | |
| Germany | ||
| France | ||
| Italy | ||
| Rest of Europe | ||
| Asia-Pacific | China | |
| Japan | ||
| India | ||
| South Korea | ||
| Rest of Asia-Pacific | ||
| Middle East | Israel | |
| Saudi Arabia | ||
| United Arab Emirates | ||
| Turkey | ||
| Rest of Middle East | ||
| Africa | South Africa | |
| Egypt | ||
| Rest of Africa | ||
| South America | Brazil | |
| Argentina | ||
| Rest of South America | ||


Key Questions Answered in the Report
How large is the stick packaging market in 2026 and how fast is it growing?
The sector is valued at USD 1.58 billion in 2026 and is projected to reach USD 2.07 billion by 2031, tracking a 5.54% CAGR over 2026-2031.
Which material category is gaining share the fastest?
Bioplastics, led by polylactic acid and polyhydroxyalkanoates, are on course for a 6.34% CAGR through 2031 as brand owners pursue compostable options.
Why are multi-lane machines important in new capacity plans?
11-20-lane systems deliver up to 1,600 sticks per minute, letting contract manufacturers meet serialization mandates and lower labor cost per unit.
What drives the rise of liquid stick packs?
Advances in aseptic form-fill-seal equipment now handle viscosities to 5,000 cP, opening opportunities in functional beverages and pediatric suspensions.
How do regulatory trends affect stick-pack material choice?
Extended producer responsibility laws in the European Union, Canada and several U.S. states impose higher fees on non-recyclable multi-layer films, steering converters toward mono-material PE and PP structures.
Which region posts the strongest growth outlook to 2031?
The Middle East is projected to register a 6.52% CAGR as Saudi Arabia and the UAE localize pharmaceutical and nutraceutical production.
Page last updated on:


