
Refrigerants Market Size and Share
Market Overview
| Study Period | 2020 - 2031 |
|---|---|
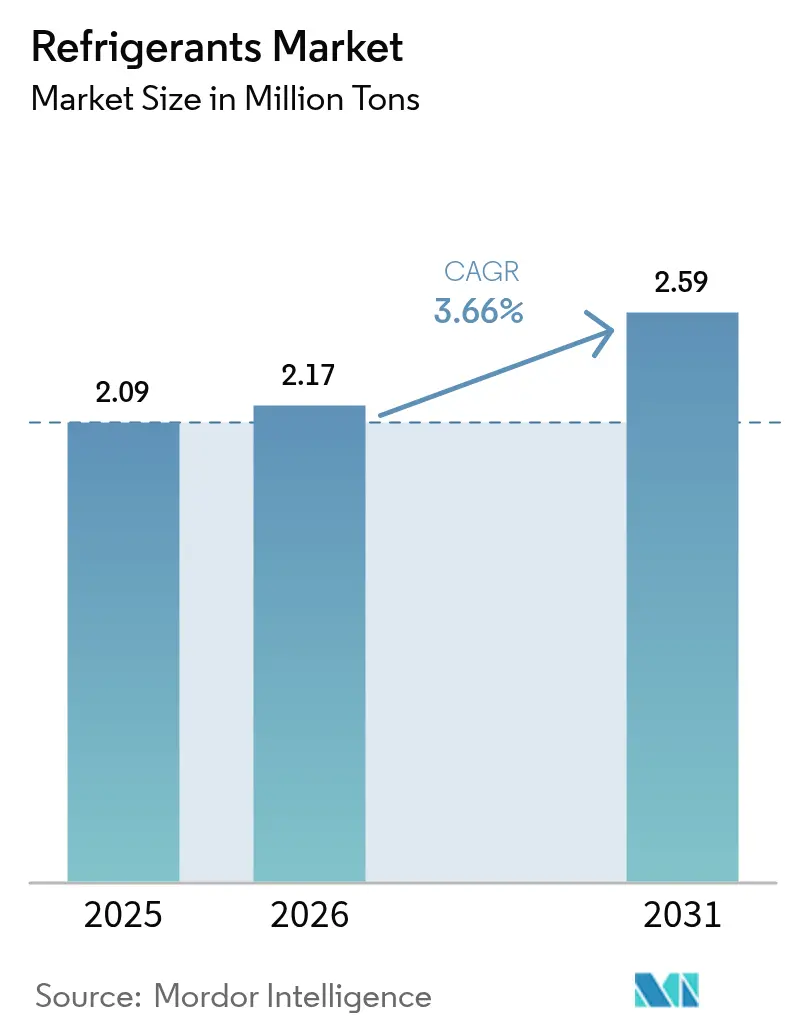
| Market Volume (2026) | 2.17 Million tons |
| Market Volume (2031) | 2.59 Million tons |
| Growth Rate (2026 - 2031) | 3.66 % |
| Fastest Growing Market | Asia Pacific |
| Largest Market | Asia Pacific |
| Market Concentration | Medium |
Major Players *Disclaimer: Major Players sorted in no particular order Image © Mordor Intelligence. Reuse requires attribution under CC BY 4.0. | |
Refrigerants Market Analysis by Mordor Intelligence
The Refrigerants market size is expected to grow from 2.09 million tons in 2025 to 2.17 million tons in 2026 and is forecast to reach 2.59 million tons by 2031 at 3.66% CAGR over 2026-2031. The core growth engines are the accelerated adoption of low-global-warming-potential (GWP) formulations, mandatory phase-downs of hydrofluorocarbons (HFCs), and expanding thermal-management needs across cooling, transport, and cold-chain logistics. Regulation-driven product substitutions, electrified-vehicle heat-pump integration, and multi-temperature pharmaceutical logistics expand the refrigerant market opportunity while intensifying demand for natural and hydrofluoro-olefin (HFO) alternatives. At the same time, raw-material cost swings and quota-induced supply bottlenecks keep price volatility high, prompting manufacturers to optimize capacity footprints and portfolio mixes. Midstream distributors are forming strategic sourcing alliances with chemical majors to secure compliant molecules ahead of regional cut-off dates, while downstream equipment makers fast-track system redesigns compatible with A2L and A3 classifications. These converging forces collectively reinforce a medium-single-digit growth trajectory for the refrigerant market through 2030.
Key Report Takeaways
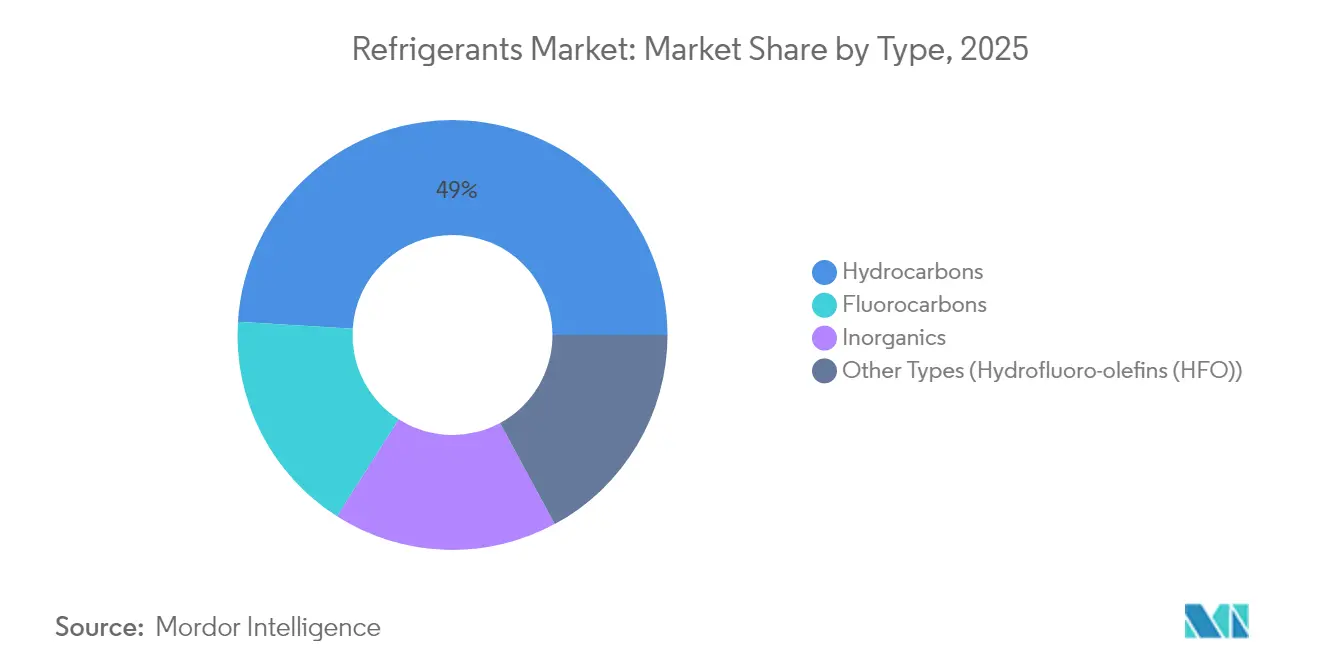
- By type, hydrocarbons led with 49.02% refrigerant market share in 2025, while hydrofluoro-olefins are advancing at a 9.86% CAGR through 2031.
- By application, air-conditioning accounted for 49.88% of the refrigerant market size in 2025 and is expanding at a 3.92% CAGR.
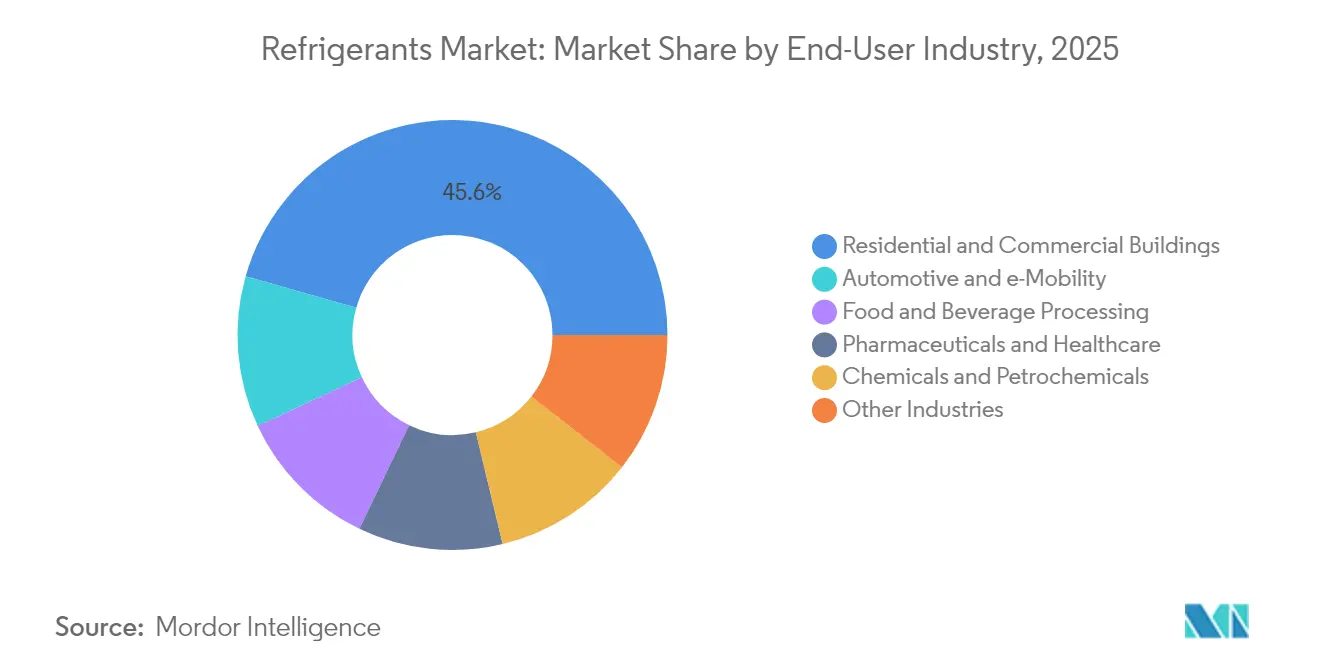
- By end-user industry, residential and commercial buildings led with 45.60% refrigerant market share in 2025. Automotive and e-mobility is projected to post the fastest 5.65% CAGR to 2031, outpacing residential and commercial buildings.
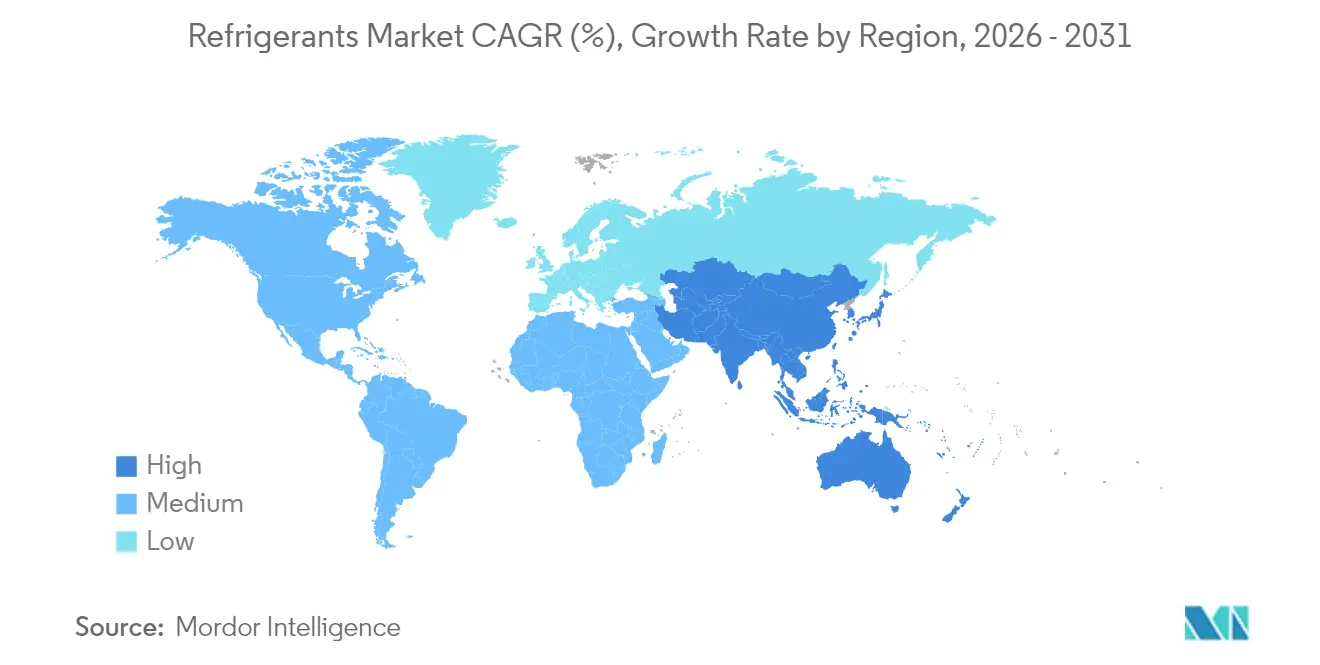
- By geography, Asia-Pacific dominated with 50.10% refrigerant market share in 2025 and is on track for a 3.91% CAGR through 2031.
Note: Market size and forecast figures in this report are generated using Mordor Intelligence’s proprietary estimation framework, updated with the latest available data and insights as of 2026.
Market Trends and Insights
Drivers Impact Analysis of Refrigerants Market*
| Driver | (~) % Impact on CAGR Forecast | Geographic Relevance | Impact Timeline |
|---|---|---|---|
| High demand for room and car air-conditioners in emerging Asia | +1.20% | Asia-Pacific core, spill-over to Middle East & Africa | Medium term (2-4 years) |
| Expansion of refrigerated warehousing and 3PL cold-chain nodes | +0.80% | Global, concentrated in North America & EU | Long term (≥ 4 years) |
| Electrified-vehicle thermal-management requirements | +0.60% | North America & EU, expanding to Asia-Pacific | Medium term (2-4 years) |
| Ultralow-temperature freezers for mRNA-type vaccines | +0.40% | Global, led by developed markets | Short term (≤ 2 years) |
| Carbon-credit monetization for natural refrigerants | +0.30% | EU & North America, pilot programs | Long term (≥ 4 years) |
| Source: Mordor Intelligence | |||
High Demand for Room and Car Air-Conditioners in Emerging Asia
Rapid urbanization is pushing residential cooling deeper into tier-2 and tier-3 city households while the automotive sector simultaneously swaps internal-combustion platforms for electric drivetrains. China’s heat-pump shipments are projected to hit 50 million units annually by 2030, and India’s household air-conditioner penetration remains under 10%, underscoring significant latent demand. Japan’s revised F-Gas Law and South Korea’s efficiency management program impose GWP ceilings that funnel procurement toward propane, R-32, and shortlisted HFO blends. Vehicle OEMs in the region are standardizing R-1234yf for cabin and battery loops, accelerating molecule transition volumes throughout Asia-Pacific. Together, residential uptake and e-mobility adoption underpin the largest absolute tonnage additions in the refrigerant market during the forecast window.
Electrified-Vehicle Thermal-Management Requirements
Electric vehicle (EV) battery chemistries demand narrow temperature windows for longevity and charging speed. R-1234yf enjoys 95% penetration in new U.S. light-duty vehicles, with 220 million cars worldwide now equipped, while legacy fleets adopt retrofit kits that swap out R-134a for the same molecule[1]Chemours, “Chemours Announces Development of a Low GWP Retrofit Approach,” CHEMOURS.COM . Heat-pump architectures unifying cabin heating and battery cooling are spreading into mass-market segments, spurring consumption of blended A2L fluids optimized for –30 °C to +45 °C efficiency curves. Compressor suppliers have cut scroll noise by 6 dBA through housing and inverter tuning, a key specification for premium EV models[2]ChaeSil Kim & NeungGyo Ha, “A Study on the Vibration and Noise Reduction of Scrolling-Type Electric Compressor for Electric Vehicles,” MDPI.COM . The aggregate effect widens the addressable refrigerant market for mobility applications through mid-decade.
Ultralow-Temperature Freezers for mRNA-Type Vaccines
Biopharma pipelines continue to add products with storage requirements below –70 °C. New freezers employ two-stage CO₂/synthetic cascades and incorporate phase-change materials as passive buffers during power disruptions, satisfying regulatory audits while minimizing energy draw. Hospital networks and specialist logistics providers alike are doubling freezer fleets to support upcoming gene-therapy launches. These deployments maintain a steady pull on high-purity CO₂ and partner fluids in the refrigerant market, even as mainstream HFC volumes taper off.
Carbon-Credit Monetization for Natural Refrigerants
Retailers and food processors in North America and the EU now tap verified carbon programs that award credits for switching from HFCs to natural refrigerants. CO₂ transcritical supermarket systems can earn up to 1.5 metric tons of CO₂-equivalent credits per kilogram of HFC displaced, creating an economic delta that offsets installation premiums. Aggregators package these credits for voluntary buyers, inserting a new revenue line into project models and nudging investment committees toward natural options. While early-stage, the mechanism adds incremental momentum to the low-GWP transition narrative in the refrigerant market.
Restraints Impact Analysis of Refrigerants Market*
| Restraint | (~) % Impact on CAGR Forecast | Geographic Relevance | Impact Timeline |
|---|---|---|---|
| Stringent global HFC phase-down (Kigali, EU F-Gas) | –1.8% | Global, led by EU & North America | Medium term (2-4 years) |
| High first-cost and handling risk of flammable A3/A2L gases | –0.9% | Global, acute in developing markets | Long term (≥ 4 years) |
| Boom-bust price swings for next-gen HFO molecules | –0.6% | Global, concentrated in major markets | Short term (≤ 2 years) |
| Source: Mordor Intelligence | |||
Stringent Global HFC Phase-Down (Kigali, EU F-Gas)
EU Regulation 2024/573 cuts HFC quotas from 60% of baseline levels in 2025 to 15% in 2036, with full phase-out targeted by 2050. Similar freezes under the Kigali Amendment pressure all producers simultaneously, tightening supply and elevating spot prices across the refrigerant market. Operators installing new systems must adopt automated leak detection above 500 tCO₂e capacity, raising compliance budgets and reallocating capital away from volume growth. The resulting uncertainty slows decision cycles for large installations, shaving nearly two percentage points from projected CAGR during mid-transition years.
High First-Cost and Handling Risk of Flammable A3/A2L Gases
Propane, isobutane, and other A3 refrigerants require intrinsically safe electrical enclosures, spill-resistant floor plans, and technician certification courses that double deployment budgets versus HFC baselines. Insurance premiums widen further in emerging markets lacking fire-code harmonization, curbing adoption among cost-sensitive users despite clear GWP benefits. Even mildly flammable A2L candidates like R-32 bring fresh tool and recovery-equipment requirements, elongating roll-out schedules in the refrigerant industry.
*Our forecasts treat driver/restraint impacts as directional, not additive. The impact forecasts reflect baseline growth, mix effects, and variable interactions.
Refrigerants Market Segment Analysis
By Type:
Regulatory Tailwinds Boost Natural AlternativesHydrocarbons commanded 49.02% refrigerant market share in 2025 on the back of exemption status under multiple F-Gas schedules and compelling cost-of-ownership economics. Market leaders report double-digit shipment growth into residential heat-pumps and plug-in commercial cabinets, while global roll-outs of R-290 split units accelerate in regions adopting MEPS revisions. Hydrofluoro-olefins are delivering the fastest 9.86% CAGR, propelled by automotive and stationary HVAC debuts where regulatory cut-off dates for GWP greater than 750 fluids are imminent. Collectively, these two low-GWP segments offset contracting fluorocarbon tonnage, anchoring overall refrigerant market growth.
Downstream, the refrigerant market size for inorganic options such as ammonia and CO₂ continues to expand in large food-processing plants and big-box supermarkets. Engineers pair CO₂ in low-stage loops with synthetic high-stage fluids for efficiency gains, an architecture validated by recent COP comparisons across cascade permutations. Data-center immersion cooling and pharma freezers add pocket growth for CO₂, while ammonia remains entrenched in warehouse chillers. Natural-refrigerant carbon-credit programs further sweeten the business case, ensuring sustained share migration away from legacy HFCs.



By Application:
Air-Conditioning Retains Volume PrimeAir-conditioning systems captured 49.88% of the refrigerant market size in 2025 and, despite mature demand in OECD economies, will grow 3.92% annually through 2031. Regulatory deadlines shift split-system charge sizes toward R-32 and upcoming A2L blends, prompting multinational OEMs to localize compliant production lines ahead of cut-in dates. In parallel, vehicle air-conditioning rides the EV adoption wave, integrating reversible heat-pump cycles that elevate per-vehicle fluid charges. Chiller manufacturers target data center cooling as a long-tail growth pocket, especially where urban heat-island effects raise condenser water temperatures.
Refrigeration applications remain a diverse cohort—from convenience-store micro-condensing units to 300 kW cold-store rack systems—each sitting at different points on the phase-down roadmap. CO₂ transcritical systems now clear the 10,000-store mark worldwide, proving economic beyond temperate zones as ejector and parallel compression upgrades shave energy penalties. Transportation refrigeration pivots to lower-GWP blends while exploring liquid nitrogen synergies for last-mile logistics. Across use cases, safety-code revisions and component availability pace the adoption curve, maintaining a staggered but upward trajectory for the refrigerant market.
By End-User Industry:
Mobility Surges AheadResidential and commercial buildings held 45.60% refrigerant market share in 2025 as heat-pump retrofits and smart-thermostat integrations spread across aging building stocks. Building codes that peg maximum leak rates accelerate sensor adoption, intertwining refrigerant selection with digital-building-management procurement. Cold-climate heat-pump breakthroughs extend operational envelopes to –25 °C, inserting new demand rows into utility rebate programs.
Automotive and e-mobility is the pace-setter with a projected 5.65% CAGR through 2031. Global passenger-EV sales crest 20 million units in 2025, each containing low-GWP cabin refrigerants and battery loop fluids. Retrofit aftermarket volumes add upside as R-1234yf kits penetrate legacy fleets. Food and beverage processing, pharmaceuticals and healthcare, and chemical process industries retain steady baseline growth, collectively underpinning demand stability in the broader refrigerant market.
Geography Analysis
APAC Refrigerants Market
Asia-Pacific’s 50.10% refrigerant market share in 2025 reflects the region’s outsized manufacturing base, urban temperature spikes, and supportive policy frameworks. China’s room-air-conditioner exports grow with domestic uptake, locking in bulk R-32 and R-290 flows through vertically integrated supply chains. India’s Production Linked Incentive (PLI) scheme for white goods includes grants for low-GWP refrigerant R&D, expediting local component ecosystems. Japan and South Korea anchor advanced-material development for A2L blends, exporting formulation know-how across the region. Southeast Asian economies follow with cold-chain infrastructure funding, reinforcing Asia-Pacific’s reinforced leadership of the refrigerant market.
North America Refrigerants Market
North America tracks a balanced path as the U.S. AIM Act mandates an HFC consumption-cap glide path while simultaneously turbo-charging demand for HFOs in HVAC retrofits. Chemours logged a 40% surge in Opteon sales during Q1 2025, enabled by its Corpus Christi capacity expansion. Canada’s carbon-pricing architecture further skews equipment specifications toward natural refrigerants in food retail, whereas Mexico’s industrial corridor demands process-cooling fluorocarbons under transitional GWP ceilings.
Europe Refrigerants Market
Europe navigates the tightest regulatory straitjacket. F-Gas 2024 quotas and eco-design rules push OEMs to deploy R-290 heat-pumps at scale, supported by German and French subsidy pools. Transcritical CO₂ has become the default supermarket specification even in southern climates thanks to high-ambient optimization packages. The United Kingdom maintains an independent quota system but mirrors EU timelines, keeping the refrigerant market outlook convergent across the continent.
MEA and South America Refrigerants Market
Emerging regions across South America and Middle East & Africa constitute the long-tail of the refrigerant market. Delayed phase-down schedules prolong HFC demand, yet rising per-capita cooling expectations seed future low-GWP adoption cycles. Infrastructure gaps are being addressed through multilateral development-bank programs that bundle cold-chain logistics with agricultural productivity mandates.

Regulatory Landscape
The regulatory framework for refrigerants is being reshaped by mandatory HFC phase-down and sector-level restrictions tied to the Kigali Amendment and implemented through region-specific rules. In the European Union, Regulation (EU) 2024/573 tightens quota controls and use restrictions, including 2026 effective bans and limits for specific applications. It also maintains time-bound exemptions for niche medical and cold-chain uses through 31 December 2026. In July 2026, Implementing Regulation (EU) 2026/1444 updated leakage-checking rules by repealing legacy requirements and aligning methodologies with the newer F-gas framework.
In the United States, the EPA is implementing the AIM Act through multiple programs that affect both new equipment choices and the installed base. Mandatory leak repair requirements under the Emission Reduction and Reclamation (ER&R) program took effect in January 2026 for appliances with 15 pounds or more of HFCs (or substitutes above specified GWP thresholds). The Technology Transitions program is phasing in sector GWP limits, including an interim GWP limit of 700 becoming effective for cold storage warehouses in July 2026. In May 2026, EPA also finalized amendments that shifted certain compliance dates for industrial process refrigeration chillers and semiconductor equipment to a unified January 1, 2030 timeline, changing near-term conversion schedules for affected end users.
Value Chain Analysis
The refrigerants value chain begins with upstream feedstocks and fluorine chemistry inputs, notably anhydrous hydrogen fluoride, and moves through molecule synthesis (HFCs, HFOs, and blends), packaging, and distribution via specialized gas and chemical networks. Downstream, it connects to OEM charging, aftermarket service, and recovery and reclamation. Regulation-linked quotas and sector bans are already pushing producers to adjust portfolio mixes and invest in next-generation molecules, while distributors and contractors expand compliance-oriented handling, tracking, and cylinder management to support transitions to A2L/A3 and other low-GWP options.
Recent capacity and portfolio moves show how supply security and vertical integration are being used to manage compliance and input volatility. In India, SRF announced an approximately Rs 2,300 crore investment to build a 20,000 tpa HFO plant alongside a 30,000 tpa AHF facility in Odisha (completion targeted for February 2028), tightening control over a key upstream input while adding fourth-generation output. In June 2026, Gujarat Fluorochemicals announced expansion to include R134a production, reflecting continued transitional demand in automotive and thermal-management applications even as high-GWP constraints accelerate substitution elsewhere. On the demand side, EU quota actions and U.S. Technology Transitions requirements increase the importance of application-qualified formulations, OEM approvals, and service readiness (leak repair, recovery equipment, and technician capability) for channel execution.
Competitive Landscape
The refrigerant market remains moderately fragmented. Honeywell, Chemours, and Daikin exercise scale advantages via captive precursor chains, global distribution, and OEM co-development agreements. Honeywell’s planned Advanced Materials spin-off, a USD 4 billion revenue vehicle, underscores the group’s pivot toward specialty refrigerant and thermal-solution verticals. Chemours capitalized on U.S. AIM Act momentum, recording 40% Opteon growth after commissioning its Corpus Christi plant and signing a manufacturing pact with Navin Fluorine for immersion-cooling fluids. Daikin funnels dual investments into R-32 compressor lines and R-290 package-unit factories, aligning its appliance roadmap with incoming F-Gas thresholds.
Midsize challengers concentrate on natural-refrigerant niches, leveraging faster engineering cycles and regional production to undercut incumbents in cost-sensitive contracts. Specialty-gas distributors forge hedging alliances and vertical e-commerce portals to smooth price volatility and ensure compliance traceability. Intellectual-property portfolios and service-infrastructure breadth remain the main barriers to entry, guiding competitive positioning across the refrigerant market spectrum.
Refrigerants Industry Leaders
Arkema
Daikin Industries, Ltd.
Honeywell International Inc
Sinochem Holdings Corporation Ltd
The Chemours Company
- *Disclaimer: Major Players sorted in no particular order

Refrigerants Market Companies Covered in this Report
- A-Gas International Ltd
- AGC Inc.
- Arkema
- Brothers Gas
- Daikin Industries, Ltd.
- Dongyue Group
- Gulfcryo.
- Harp International Ltd
- Honeywell International Inc
- Linde PLC
- Messer SE & Co. KGaA
- Navin Fluorine International Ltd
- Orbia
- Shandong Yuean Chemical Industry Co., Ltd
- Sinochem Holdings Corporation Ltd
- SRF Limited
- The Chemours Company
- Zhejiang Juhua Co. Ltd.

Market Opportunities and Future Outlook
The clearest whitespace centers on compliant molecule supply and application-specific reformulations as regulators move beyond broad phase-downs to enforce sector restrictions and leakage management. In the EU, Regulation (EU) 2024/573 is compressing the addressable window for high-GWP refrigerants in new equipment and servicing, while associated implementing actions tighten quotas for high-GWP commercial refrigeration refrigerants. That shift lifts demand for alternatives that meet application cutoffs and safety codes. In the United States, AIM Act implementation expands the market for low-GWP options through Technology Transitions and ER&R leak repair requirements, with the January 2026 start applying to larger charge systems, supporting demand for refrigerants and services that reduce lifecycle emissions and simplify compliance documentation.
Capital deployment by producers points to where near-term opportunity is being pursued. SRF increased capex for an Odisha complex that combines a 20,000 MTPA HFO unit with a 30,000 MTPA AHF facility (completion target February 2028), and Gujarat Fluorochemicals announced added R134a production capacity in June 2026 to serve automotive, electronics, and advanced cooling needs where transitional fluids still move meaningful volumes. These investments, alongside portfolio broadening moves such as Arkema and Honeywell expanding access to lower-GWP HFO blends under established brands, indicate demand for (i) HFOs and blends that match specific equipment classes and conversion deadlines, (ii) natural refrigerants linked to carbon-credit and retailer decarbonization programs cited in North America and the EU, and (iii) services and infrastructure around reclamation, leak detection, and safe handling that are becoming mandatory cost centers rather than optional upgrades.
Recent Industry Developments in Refrigerants Market
- June 2026: Gujarat Fluorochemicals announced expansion to include R134a production capacity in India, enhancing regional supply for automotive and electronics cooling. The move strengthens feedstock security and signals a shift toward localized capacity in a market transitioning away from high-GWP refrigerants.
- December 2025: Daikin Industries signed an agreement to acquire Anh Nguyen Trading Technical Service in Vietnam to integrate HVAC and building management systems. The acquisition deepens downstream system integration capability in a fast-growing cooling market and links equipment rollouts with control capabilities that influence refrigerant performance and leakage management.
- September 2024: Orbia Fluor & Energy Materials introduced Klea Edge 444A, a low-GWP refrigerant positioned for the EU and UK automotive aftermarket. The launch targets regulatory-driven replacement needs while maintaining compatibility and cost considerations for legacy vehicle fleets.


Refrigerants Market Report Scope and Research Methodology
Market Definition and Coverage
The refrigerants market is defined as the demand and supply of chemical refrigerants used as the working fluid in cooling and heating systems, across manufacturing, distribution, and end-use consumption, tracked on a volume basis (tons) across the covered geographies.
Scope exclusions: It excludes equipment value (compressors, condensers, packaged HVAC units), installation labor, and most aftermarket service fees except the refrigerant itself.
Segments Covered in This Report
- By Type
- Fluorocarbons
- Hydrochlorofluorocarbons (HCFC)
- Hydrofluorocarbons (HFC)
- Inorganics
- Ammonia
- Carbon Dioxide
- Other Inorganics
- Hydrocarbons
- Isobutane
- Propane
- Other Hydrocarbons
- Other Types (Hydrofluoro-olefins (HFO))
- Fluorocarbons
- By Application
- Refrigeration
- Domestic
- Commercial
- Transportation
- Industrial
- Air-Conditioning
- Stationary Room/Packaged
- Chillers
- Mobile
- Other Applications
- Refrigeration
- By End-user Industry
- Residential and Commercial Buildings
- Food and Beverage Processing
- Pharmaceuticals and Healthcare
- Automotive and e-Mobility
- Chemicals and Petrochemicals
- Other Industries
- By Geography
- Asia-Pacific
- China
- India
- Japan
- South Korea
- ASEAN Countries
- Rest of Asia-Pacific
- North America
- United States
- Canada
- Mexico
- Europe
- Germany
- France
- United Kingdom
- Italy
- Russia
- Rest of Europe
- South America
- Brazil
- Argentina
- Rest of South America
- Middle-East and Africa
- Saudi Arabia
- South Africa
- Rest of Middle-East and Africa
- Asia-Pacific
Data Sources, Market Sizing, and Validation
Desk Research
Desk work starts with building the rulebook for what counts as refrigerant volume and where it typically moves through the value chain. For refrigerants, we rely on public statistics and compliance signals, such as UN Comtrade trade flows, US EPA SNAP and AIM Act-related resources, European Environment Agency F-gas reporting summaries, and UNEP ozone and Kigali Amendment documentation.
Next, we use company annual reports, investor presentations, and product technical bulletins to understand capacity additions, product mix shifts (for example, HFC to HFO and natural options), and typical packaging and cylinder movements that influence shipments. Patent databases are also checked to spot where newer molecules and blends are seeing higher activity, which helps validate timing assumptions. Some paid subscriptions for company financials and news intelligence are used to cross-check expansion announcements and ownership changes. The sources listed here are illustrative, and many other public references were used for data collection, validation, and research clarification.
Primary Interviews and Surveys
Primary work is used to convert desk signals into practical assumptions that match how refrigerants are purchased and replenished. We spoke with a mix of refrigerant manufacturers, distributors, reclaimers, and large end users, then tested pricing and adoption expectations with channel-facing roles in major consuming regions.
Because demand can be driven by installed base and servicing cycles as much as new equipment sales, interviews were also used to sanity-check recharge rates, recovery and reclamation penetration, and phase-down timing by application.
Distribution of primary research fieldwork respondents
| Company type | Respondent position | Region |
|---|---|---|
| Top tier: 38% | CXOs: 13% | APAC: 49% |
| Mid tier: 44% | Functional/Unit leaders: 41% | EMEA: 29% |
| Smaller Players: 18% | Managers: 46% | Americas: 22% |
Market-Sizing & Forecasting
The core model uses a top-down demand pool build-up that reconstructs refrigerant consumption from cooling demand indicators, installed base, and replenishment behavior, and then converts the output into annual tons by region. Key inputs include air conditioner and refrigeration equipment stock trends, typical charge sizes by system type, average annual leakage or top-up rates, refrigerant transition schedules tied to regulations, and the share of recovered and reclaimed material that offsets virgin demand.
To keep the result grounded, totals are corroborated with selective bottom-up checks, such as supplier shipment direction, distributor channel checks, and sampled pricing and volume logic for major applications. Where direct volume signals are patchy, gaps are handled using proxy indicators such as import-export balance, announced capacity utilization ranges, and service intensity trends, then re-tested with expert feedback.
For forecasting, scenario analysis is used around phase-down speed and substitution pace. The base case is supported with multivariate regression on cooling equipment stock growth, temperature-linked cooling degree days, and regulatory step-down milestones. Assumptions are refreshed by region because replacement cycles and compliance enforcement do not move at the same speed everywhere.
Data Validation & Update Cycle
Outputs are validated through multiple checks so one noisy data series does not drive the final number. We compare modeled tons against independent signals like trade volumes, reported F-gas activity summaries where available, and the direction of pricing and supply tightness shared by market participants, then review outliers before sign-off.
Reviews are done in steps, where calculations are re-checked by another analyst and key assumptions are challenged against the latest regulatory and capacity updates. The report is refreshed annually, and interim updates are triggered when material events occur, such as major phase-down announcements, large plant start-ups, or policy changes that quickly alter refrigerant mix. Before delivery, a fresh verification pass is completed so clients receive the most current view possible.
Mordor Intelligence's Refrigerants Market Sizing Compared With Other Published Estimates
Published market sizes for refrigerants can vary widely, even when the end topic sounds the same, because sources often measure different items and then label them with one common market name. Differences are usually driven by whether the number is value or volume, how reclaimed refrigerant is treated, the treatment of blends and by-application charge assumptions, and how currency and inflation are handled.
In refrigerants, the biggest gaps tend to come from scope boundaries. Some sources lean on manufacturer revenue in USD and may also fold in adjacent services, while others focus on physical demand in tons tied to installed base and servicing. When leak rates, recharge frequency, and phase-down timing are not aligned to real-world practice, the forecast can shift quickly, and this is why the spread between published figures is often meaningful.
Benchmark comparison
| Source | Market Size | Gaps in Research Methodology |
|---|---|---|
| Mordor Intelligence | USD 2.17 M (2026) | |
| Global Consultancy A | USD 25.90 B (2024) | Uses a value-based revenue lens in USD and a different time window, which can also reflect pricing, inflation, and mix effects rather than only physical refrigerant consumption. |
| Industry Publisher B | USD 28.18 B (2025) | Reports market value and may embed broader pricing assumptions and a more aggressive transition path, so changes in ASP and product mix can lift totals beyond tonnage-led demand. |
The table highlights that value-based publications can look much larger because they capture price and mix swings, not just the underlying physical demand. Here the sizing is anchored on tons and on installed-base recharge behavior. That is why the 2026 figure is presented this way, a modeling choice applied by Mordor Intelligence.


Key Questions Answered in the Report
What is the current global volume of refrigerants sold?
The refrigerant market moved 2.17 million tons in 2026 and is expected to climb to 2.59 million tons by 2031.
Which region is the largest consumer of refrigerants?
Asia-Pacific leads with 50.10% of 2025 demand, driven by air-conditioner adoption and expanding cold-chain infrastructure.
Which refrigerant types are growing fastest?
Hydrofluoro-olefins are expanding at a 9.86% CAGR, followed by CO₂ and propane in natural-refrigerant categories.
How will electric vehicles influence refrigerant demand?
EV thermal-management systems relying on R-1234yf and bespoke blends are propelling a 5.65% CAGR in automotive applications through 2031.
What impact do HFC phase-down regulations have on supply?
EU and Kigali quotas shrink HFC production to 15% of historical baselines by 2036, tightening supply and nudging users toward low-GWP alternatives.
Page last updated on:


 Your data is secure and never sold or shared.


