Market Overview
| Study Period | 2021 - 2031 |
|---|---|
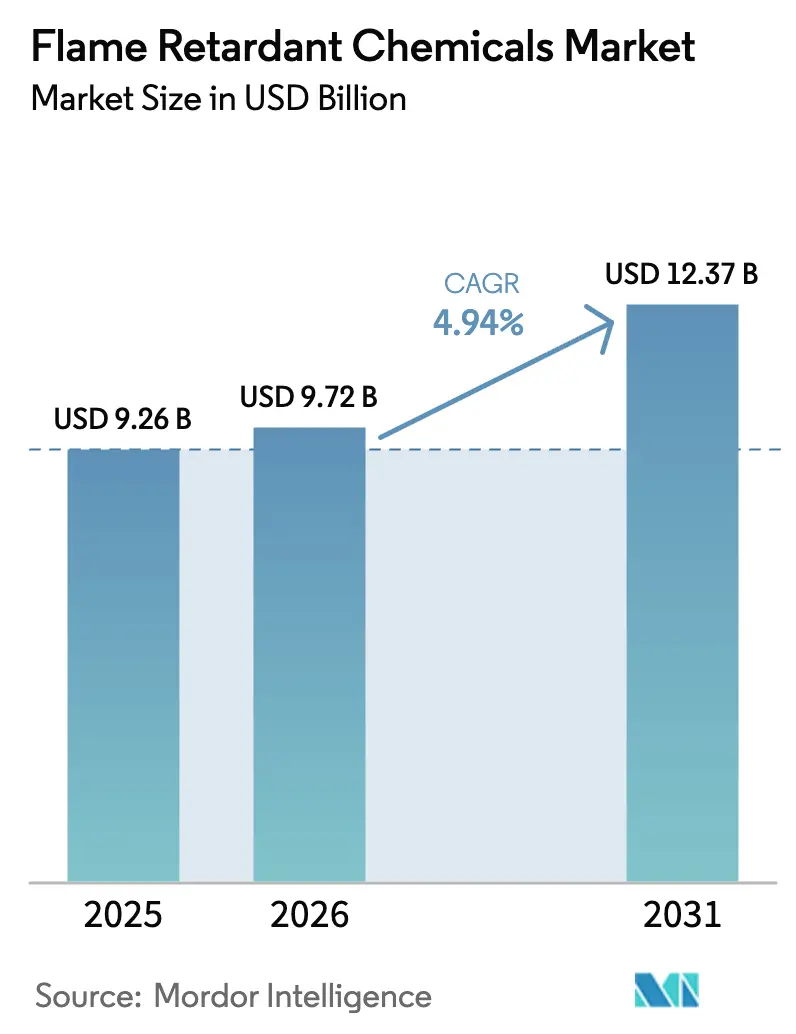
| Market Size (2026) | USD 9.72 Billion |
| Market Size (2031) | USD 12.37 Billion |
| Growth Rate (2026 - 2031) | 4.94% CAGR |
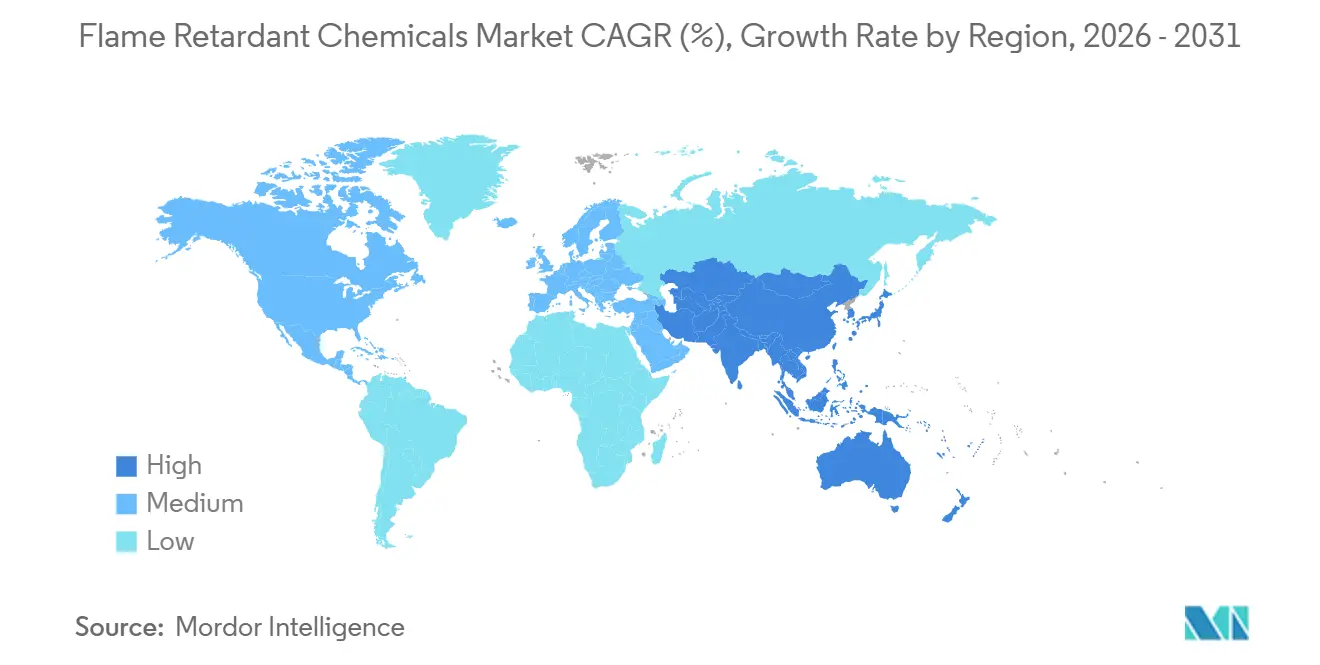
| Fastest Growing Market | Asia Pacific |
| Largest Market | Asia Pacific |
| Market Concentration | Medium |
Major Players *Disclaimer: Major Players sorted in no particular order Image © Mordor Intelligence. Reuse requires attribution under CC BY 4.0. | |
Flame Retardant Chemicals Market Analysis by Mordor Intelligence
The Flame Retardant Chemicals Market size is expected to grow from USD 9.26 billion in 2025 to USD 9.72 billion in 2026 and is forecast to reach USD 12.37 billion by 2031 at 4.94% CAGR over 2026-2031. The expansion stems from regulators and OEMs pivoting toward non-halogenated alternatives, a trend that has already shifted 65.08% of demand to aluminum-, phosphorus- and nitrogen-based systems in 2025. Building-codes that tighten flame-spread indices, surging infrastructure projects throughout Asia-Pacific and rapid growth of electric-vehicle battery packs have collectively lifted additive loadings across polyolefins, polyurethane and engineering thermoplastics. Competitive strategies now emphasize ultra-fine particle engineering, vertical integration for feedstock security and premium positioning in ESG-aligned formulations. At the same time, raw-material volatility and nano-toxicity scrutiny encourage formulators to diversify chemistries and invest in closed-loop phosphorus recovery.
Key Report Takeaways
- By product type, non-halogenated flame retardants led with 65.08% of the flame retardant chemicals market share in 2025, and are expected to grow at the fastest CAGR of 5.15% through 2031.
- By application, polyolefins accounted for 42.28% of the flame retardant chemicals market size in 2025, while polyurethane registered the fastest 5.29% CAGR through 2031.
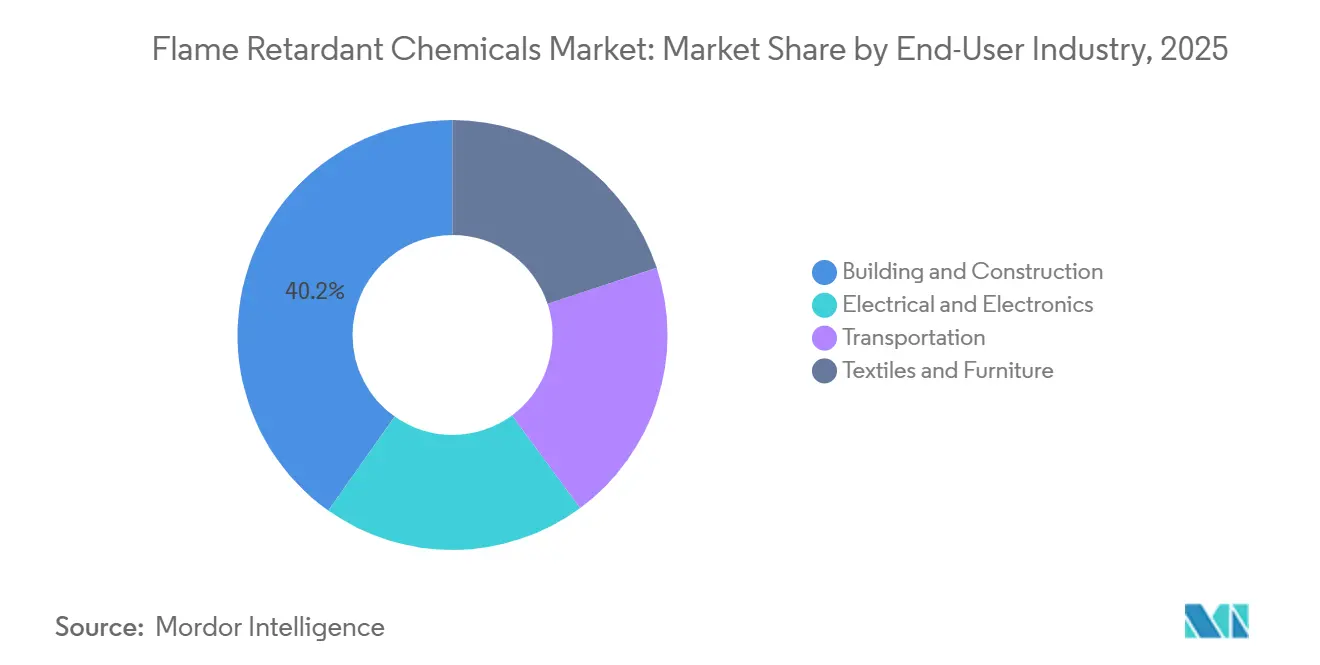
- By end-user industry, building and construction held 40.19% revenue share in 2025; electrical and electronics is projected to expand at a 5.24% CAGR up to 2031.
- By geography, Asia Pacific commanded 50.65% share of the flame retardant chemicals market in 2025 and is advancing at a 5.69% CAGR to 2031.
Note: Market size and forecast figures in this report are generated using Mordor Intelligence’s proprietary estimation framework, updated with the latest available data and insights as of January 2026.
Global Flame Retardant Chemicals Market Trends and Insights
Drivers Impact Analysis*
| Driver | (~) % Impact on CAGR Forecast | Geographic Relevance | Impact Timeline |
|---|---|---|---|
| Stringent fire-safety regulations in building and construction | +1.2% | Global, peak in EU, North America, Australia | Medium term (2-4 years) |
| Rapid infrastructure build-out across Asia-Pacific | +1.5% | China, India, Southeast Asia, Middle East spill-over | Short term (≤2 years) |
| Rising output of consumer electronics and electrical goods | +0.9% | China, Vietnam, South Korea, secondary North America | Medium term (2-4 years) |
| Shift toward non-halogenated solutions for ESG compliance | +1.0% | Europe, North America lead, APAC catching up | Long term (≥4 years) |
| EV-battery enclosure fire-performance standards | +0.8% | China, EU, United States | Medium term (2-4 years) |
| Source: Mordor Intelligence | |||
Stringent Fire-Safety Regulations in Building and Construction
The 2024 International Fire Code lowered permissible flame-spread and smoke-development indices, compelling specifiers to adopt intumescent coatings and halogen-free additives in rigid polyurethane insulation boards. The United Kingdom’s Approved Document B ban on combustible cladding above 11 meters, effective June 2025, shifted demand toward aluminum-trihydrate-filled phenolic foams. Japan’s Building Standard Law revision added a fire-resistance class for multistory timber, accelerating orders for flame-retardant treatments that meet JIS A 1321 peak heat-release limits[1]Ministry of Land, Infrastructure, Transport and Tourism, “Building Standard Law Revision 2024,” mlit.go.jp. South Korea followed in December 2024 by aligning with ISO 5660-1, removing legacy halogenated additives from building boards. Collectively, the rule changes fragmented certification pathways and rewarded suppliers adept at navigating local test protocols.
Rapid Infrastructure Build-Out Across Asia-Pacific
China allocated CNY 17.8 trillion (USD 2.5 trillion) to rail, metro, and housing projects in 2024, consuming 2.1 million t of halogen-free polyolefin cable compounds[2]National Bureau of Statistics of China, “Infrastructure Investment Data 2024,” stats.gov.cn. India’s National Infrastructure Pipeline earmarked USD 1.4 trillion through 2025, with cable and conduit specs mandating low-smoke zero-halogen designs under IS 1554. Indonesia added airport and seaport builds worth USD 40 billion in 2025, adopting non-halogenated epoxy steel coatings that pass ASTM E84 Class A. Vietnam boosted metro-rail budgets by 22% in 2024, raising IEC 60332 cable demand. These projects outstripped Western construction cycles, offsetting slower North American starts.
Rising Output of Consumer Electronics and Electrical Goods
Semiconductor shipments grew 12% to 1.15 trillion units in 2024, lifting the need for flame-retardant epoxy molding compounds. China produced 3.2 billion smart devices, each housing 8–12 g of UL 94 V-0 halogen-free blends. South Korea exported USD 142 billion in consumer electronics, where battery packs employ phosphorus-nitrogen coatings to clear UL 2054. Vietnam assembled 85 million laptops, still reliant on brominated laminates that must transition before 2027 under REACH. Base-station proliferation to 4.8 million sites underscored demand for nano-alumina-filled high-Tg epoxies.
Shift Toward Non-Halogenated Solutions for ESG Compliance
ECHA’s October 2024 restriction proposal for deca-BDE triggered redesigns toward aluminum diethylphosphinate and melamine polyphosphate. California listed TBBPA as a Priority Product in March 2025, launching alternatives analyses under Safer Consumer Products. Investor scrutiny expanded, with 68% of S&P 500 companies disclosing Scope 3 emissions in 2024 and 42% pledging halogen phase-outs by 2028. BASF’s August 2024 Ultradur High Speed, a red-phosphorus-modified PBT, won automotive connector slots at 0.75 mm thickness. Ecolabels such as EPEAT Gold now cap halogen content below 0.1% by weight, steering public procurement across Scandinavia.
Restraints Impact Analysis*
| Restraint | (~) % Impact on CAGR Forecast | Geographic Relevance | Impact Timeline |
|---|---|---|---|
| Regulatory curbs on brominated/halogenated chemistries | -0.8% | Europe, North America lead, APAC following | Medium term (2-4 years) |
| Raw-material cost volatility | -0.6% | Global, acute where bauxite import-dependent | Short term (≤2 years) |
| Emerging toxicity scrutiny on nano-metal hydroxides | -0.3% | Europe, North America, potential APAC extension | Long term (≥4 years) |
| Source: Mordor Intelligence | |||
Regulatory Curbs on Brominated and Halogenated Chemistries
The EU’s POPs Regulation cut allowable HBCD in recycled polymers tenfold in 2024, effectively removing legacy EPS insulation from circular loops. EPA’s March 2025 TSCA rule bans deca-BDE manufacture after January 2027, except in aerospace. Canada added TBBPA to Schedule 1, initiating a 24-month PCB laminate phase-out. Inventory pre-buys depressed bromine spot prices 9% in late-2024, while Japanese controls on chlorinated paraffins diverted 4,200 t toward phosphorus alternatives.
Raw-Material Cost Volatility
Chinese aluminum-hydroxide averaged CNY 2,850/t (USD 400/t) in H1 2025, up 18% after Australian bauxite exports slipped 9% and Indonesia added a 10% alumina duty. European magnesium-hydroxide rose 14% as gas curtailments hit Dutch calcination capacity. A Sichuan red-phosphorus plant fire lifted prices 21%, pushing compounders to ammonium polyphosphate at a 15% cost premium. Turkey’s royalty hike nudged zinc-borate costs 6%. Nabaltec’s fixed-price contracts covered 60% of 2025 ATH needs, safeguarding margins.
*Our forecasts treat driver/restraint impacts as directional, not additive. The impact forecasts reflect baseline growth, mix effects, and variable interactions.
Segment Analysis
By Product Type: Non-Halogenated Formulations Capture Regulatory Tailwinds
Non-halogenated systems commanded 65.08% of the flame retardant chemicals market in 2025, and this share will expand at a 5.15% CAGR through 2031. Aluminum hydroxide remains the volume backbone, decomposing endothermically at 180–200°C to quench heat while releasing water vapor; Huber’s Martinal OL-107 enabled IEC 60754-2 acid-gas emissions below 0.5% for cables in 2024. Magnesium hydroxide covers higher-temperature polyolefins, with Martin Marietta’s MagShield 95 balancing impact and flame properties at 1.8 µm median size.
The flame retardant chemicals market size for non-halogenated products is reflecting customer preference for lower-toxicity materials that support green-building certifications. Suppliers focus on surface treatments that boost polymer-matrix compatibility, while vertically integrated Chinese producers sharpen price competition by controlling bauxite and phosphate feedstocks. Intellectual-property filings concentrate on phosphorus-silicon hybrids for EV battery packs, and early pilots for lignin-derived phenolics demonstrate 30% embodied-carbon cuts sought under Europe’s life-cycle mandates.


By Application: Polyolefins Dominate, Polyurethane Accelerates
Polyolefins held 42.28% of the flame retardant chemicals market in 2025, anchored by low-smoke zero-halogen cable compounds that fold 60–65% aluminum hydroxide into LLDPE matrices to reach 28% limiting oxygen indices. Dow’s Engage-based systems cleared EN 50399 Cca-s1a,d1,a1 for European tunnels while preserving flexibility at –40°C. Growth pockets include photovoltaic wiring, 5G towers, and wind-farm harnesses.
Meanwhile, polyurethane leads growth at 5.29% CAGR as EV seats and building envelopes tap phosphorus-rich polyols like BASF’s Elastopor H 4240/10, achieving DIN 4102 B2 with 35% less smoke. Rigid-foam board retrofits under Italy’s Superbonus and France’s energy codes further lift additive volumes, while flexible foams adopt reactive phosphorus polyols that curb migration and odor.
By End-User Industry: Electrical Sector Accelerates, Construction Stabilizes
Building and construction maintained a 40.19% share in 2025, supported by rigid polyurethane boards, phenolic foams, and PVC profiles certified to flame-spread indices below 25. Asia-Pacific infrastructure counterbalanced an 8% setback in US housing starts, with China alone installing 340,000 tons of flame-retardant polyolefin conduits in social-housing complexes.
Electrical and electronics will register the fastest 5.24% CAGR, fueled by data centers, 5G devices, and consumer miniaturization that necessitate UL 94 V-0 at sub-1 mm walls. Latin-American wind-farm cabling and North-American battery enclosures add momentum, while upholstered furniture remains a niche after California’s switch to smolder-only tests.

Geography Analysis
Asia-Pacific generated 50.65% of 2025 revenue and is forecast to grow at a 5.69% CAGR. China’s GB 31241 battery regulations boosted halogen-free polycarbonate by 22% for device housings, and India’s IS 17156 unlocked metro-rail wiring demand across three megacities. Japan’s timber-building fire codes expanded intumescent-coating sales, and South Korea’s ISO 5660 alignment displaced halogenated board additives. Vietnam, Indonesia, and Thailand, which together added 42 GW of new manufacturing in 2024, intensified the need for IEC 60332-compliant cables across industrial plants.
Europe lagged in growth as PFAS bans forced foam reformulations and deca-BDE restrictions disrupted PCB laminates. Germany directed HBCD-laden recycled polystyrene to incineration only, spurring virgin non-halogenated replacements, while the UK cladding ban steered 14,000 t of phenolic-foam demand to ATH-filled grades. France’s life-cycle mandates and Italy’s Superbonus tax credits mobilized bio-based flame retardants, pointing toward lignin-phenol innovations.
North America delivered a significant 2025 turnover, with U.S. data-center and EV ramps soaking up aluminum diethylphosphinate for connectors. EPA’s deca-BDE ban pushes OEMs toward phosphorus solutions, Canada’s updated National Building Code limits combustible cladding and Mexico’s 12 GW of renewables requests IEC 60332-3 cables. South America and the Middle East & Africa also contributed, led by Brazil’s smoke-detector housing upgrades under ABNT NBR 17240 and Saudi Arabia’s Vision 2030 construction program that specifies SASO 2663-compliant interiors.

Regulatory Landscape
Regulation is tightening around legacy brominated systems and selected organophosphorus chemistries, which is lifting compliance costs and pushing reformulation toward halogen-free and polymeric solutions. In the European Union, the POPs framework increased control over PBDEs through new Unintentional Trace Contaminant (UTC) limit values introduced under Commission Delegated Regulation (EU) 2025/1482 (effective November 17, 2025), while ECHA launched a January 2026 Call for Evidence on non-polymeric aromatic brominated flame retardants used in electrical and electronics, construction, and textiles.
The EU pipeline also moved toward class-based controls on organophosphorus flame retardants, with ECHA publishing a July 2026 draft amendment to REACH Annex XVII (ECHA/RAC/2026/11) covering 12 categories and referencing a 0.1% w/w threshold with a proposed 2027 application. In the United States, EPA actions under TSCA continued to shape product stewardship, including a finalized September 2024 risk evaluation for TCEP finding unreasonable risk and June 2026 updates on TSCA review activity for TBBPA, reinforcing the need for toxicology data, worker-exposure controls, and substitution roadmaps for global suppliers serving EU and US OEMs.
Value Chain Analysis
The value chain begins with upstream feedstocks such as aluminum hydroxide (ATH) and magnesium hydroxide (MDH) minerals, phosphorus derivatives (including ammonium polyphosphate and specialty organophosphorus intermediates), and bromine-based inputs for legacy halogenated products. Midstream players convert these inputs into additive or reactive flame retardants and compounds, then sell to compounders and formulators serving polyolefins, polyurethane, epoxy resins, and engineering thermoplastics across building and construction, electrical and electronics, transportation, and textiles and furniture. Downstream qualification is driven by end-use fire tests and regional standards, which raises the role of application development, documentation (for example REACH dossiers), and in-house testing support as part of commercial delivery.
Key constraints come from feedstock concentration and energy-intensive processing, including reliance on China for yellow phosphorus and exposure to logistical and energy costs for mineral-based systems, alongside the historical use of antimony trioxide as a synergist in some halogenated formulations. Producers are responding with more localized and integrated production footprints: Clariant completed a CHF 100 million expansion at its Daya Bay, China facility in October 2025 to increase Exolit OP halogen-free capacity, and BASF announced commercial production of an Elastollan flame-retardant TPU grade at its Shanghai site in March 2026. Large-scale phosphate integration also remains a lever for supply security and cost control, shown by Xingfa Group advancing a 200,000-ton flame-retardant grade ammonium polyphosphate project in China during 2026.
Competitive Landscape
The Flame Retardant Chemicals market shows moderate fragmentation. Chinese aluminum-hydroxide producers exploited bauxite integration to undercut Western ATH by 12%, eroding margins for Albemarle, BASF, Clariant, ICL, and LANXESS. Ultra-fine ATH niches thrive as Italmatch and Nabaltec engineer ≤1.5 µm distributions for IEC 60332-3 cable jacketing, maintaining tensile strength. Regulatory credentials now drive deal flow; suppliers holding ISO 14001 and full REACH dossiers achieved higher European win rates. As a result, the competitive field tilts toward vertically integrated, compliance-ready producers capable of blending cost efficiency with ESG performance.
Flame Retardant Chemicals Industry Leaders
Albemarle Corporation
BASF
Clariant AG
LANXESS AG
ICL
- *Disclaimer: Major Players sorted in no particular order


Market Opportunities and Future Outlook
One clear opportunity is reformulation and portfolio redesign for EU compliance, where regulatory signals span both brominated chemistries and selected organophosphorus categories. ECHA's July 2026 draft REACH Annex XVII amendment (ECHA/RAC/2026/11) covering 12 categories of organophosphorus flame retardants and referencing a 0.1% w/w threshold has pushed OEMs and compounders to map additives at the formulation level and expand use of non-halogenated systems with stronger documentation and lower migration profiles. At the same time, the European Commission tightened PFAS migration limits for Eco-Polymers under REACH Annex XVII from 10 ppb to 2 ppb (effective October 1, 2026), which increases demand for fluorine-free approaches in high-performance polymer applications where fire performance and ultra-low extractables are purchased together.
Capacity additions and targeted R&D investments also point to whitespace in halogen-free phosphorus and compound solutions for e-mobility, energy storage, and advanced cabling. Clariant's October 2025 Daya Bay expansion, positioned around Exolit OP for e-mobility polymers, and BASF's March 2026 Shanghai production of a flame-retardant TPU grade illustrate ongoing localization near Asia's electronics and EV supply chains. Additional supply-side moves in 2026, including SK Minerals and Additives expanding its Khanna, India site with added land and a dedicated R&D center for advanced fire-safety materials, and Xingfa Group progressing an integrated phosphate-to-APP project, highlight opportunities for suppliers that can secure phosphorus value chains, provide drop-in halogen-free alternatives for polyolefins and polyurethane, and support customer qualification cycles through testing and regulatory documentation.
Recent Industry Developments
- July 2026: ICH completed development of a high-performance flame-retardant polyurethane foam designed for energy storage systems and began supplying it to US-based Flatiron Energy Development. The move highlights growing use of specialty flame-retardant polyurethane solutions in battery-adjacent applications where thermal-event mitigation requirements are tightening.
- November 2025: Clariant announced a joint venture with FUHUA to develop next-generation phosphorus-based, non-halogenated flame retardants. The partnership adds scale and local feedstock access in China, aligning with faster adoption of halogen-free systems in building materials, automotive components, and electronics.
- December 2024: ICL introduced VeriQuel R100, a reactive phosphorus flame retardant for rigid polyurethane insulation. By emphasizing reactive incorporation into the polymer network, the product targets lower migration and improved long-term performance, supporting insulation formulators shifting away from restricted or scrutinized additive packages.


Research Methodology Framework and Report Scope
Market Definition and Coverage
This market covers chemical additives and reactive agents used to reduce flammability and slow fire spread in materials such as plastics, foams, textiles, coatings, and construction products, measured in value terms at the point of sale.
Scope exclusions: We exclude on-site applied specialty fireproofing services and installation labor that are billed as part of construction contracts.
Segmentation Overview
- By Product Type
- Non-Halogenated Flame Retardants
- Inorganic
- Aluminum Hydroxide
- Magnesium Hydroxide
- Boron Compounds
- Phosphorus
- Nitrogen
- Other Product Types
- Inorganic
- Halogenated Flame Retardants
- Brominated Compounds
- Chlorinated Compounds
- Non-Halogenated Flame Retardants
- By Application
- Polyolefins
- PVC
- Epoxy Resins
- Engineering Thermoplastics (PA, PBT, PEEK, etc.)
- Unsaturated Polyester Resins
- Polyurethane
- By End-User Industry
- Electrical and Electronics
- Building and Construction
- Transportation
- Textiles and Furniture
- By Geography
- Asia-Pacific
- China
- India
- Japan
- South Korea
- Rest of Asia-Pacific
- Europe
- Germany
- United Kingdom
- France
- Italy
- Rest of Europe
- North America
- United States
- Canada
- Mexico
- South America
- Brazil
- Argentina
- Rest of South America
- Middle East and Africa
- Saudi Arabia
- South Africa
- Rest of Middle East and Africa
- Asia-Pacific
Data Sources, Market Sizing, and Validation
Desk Research
Desk work starts by mapping how flame retardants move from raw inputs into key end uses, and where demand shows up clearly in public data. We referenced open sources such as fire safety and building code publications, chemical and plastics trade association releases, national statistics offices for industrial production series, customs and tariff-line trade data, and peer reviewed polymer science and materials journals.
To make these inputs usable for sizing, we also screened company annual reports, investor presentations, and reputable news coverage for capacity additions, product mix commentary, and regional exposure. In addition, our analysts used an approved paid subscription for company financials and intelligence, plus a patent database, to cross-check technology shifts (for example, movement toward lower-halogen systems) that can change average selling prices over time. The sources listed here are illustrative, and many other public and paid references were also used to collect data, validate assumptions, and clarify gaps.
Primary Interviews and Surveys
Primary work was used to pressure-test desk assumptions on pricing, substitution, and adoption timing across plastics, electronics, construction materials, and transportation related demand. We spoke with participants across manufacturing, distribution, and downstream specification roles, and then reconciled differences by region so that local regulation and the end-use mix fed the final model.
Distribution of primary research fieldwork respondents
| Company type | Respondent position | Region |
|---|---|---|
| Top tier: 37% | CXOs: 17% | APAC: 45% |
| Mid tier: 44% | Functional/Unit leaders: 24% | EMEA: 34% |
| Smaller Players: 19% | Managers: 59% | Americas: 21% |
Market-Sizing & Forecasting
Sizing begins with a top-down build, using production and trade indicators to reconstruct regional apparent consumption for flame retardant chemistries, and then allocating it into major end-use material systems. Because pricing varies by chemistry and purity, average selling price bands are applied by region and end use, and then cross-checked against interview inputs.
The model is shaped by market-specific signals such as polymer and resin output trends, construction activity and insulation demand, electronics manufacturing momentum, transportation production, and the mix shift between halogenated and non-halogenated systems, which is influenced by regulation and customer specifications. For forecasting, we run scenario analysis supported by short-cycle indicators, align the variable outlook to what industry participants expect for volumes and price progression, and also run selective bottom-up approximations as a control (sampled volume times ASP, plus channel checks). If any coverage gaps appear, we handle them with conservative proxies tied to the closest measurable end-use demand pool.
Data Validation & Update Cycle
Outputs are validated through step-by-step checks where regional totals are compared with independent signals such as trade flows, end-use production series, and known capacity changes. When a number looks off, we revisit assumptions and place follow-up calls to confirm whether the driver is pricing timing, mix change, or a temporary demand dip.
Before sign-off, another analyst reviews the file to confirm calculations, unit consistency, and year-on-year logic, then aligns the narrative to the final dataset. Reports are refreshed annually, and interim updates are made when material events occur, including regulation changes or large supply additions. Right before delivery, a final pass is completed so clients receive the most current view.
Mordor Intelligence's Flame Retardant Chemicals Market Sizing Compared With Other Published Estimates
Published market sizes for flame retardant chemicals can differ even when they use similar labels, because the timing of pricing, the currency conversion month, and whether adjacent fire protection spend is included are handled differently across studies. Some reports also rely more heavily on a single demand proxy, which can exaggerate swings when end-use mix changes during a year.
In our case, the spread is mainly explained by how often price bands are refreshed and validated against recent trade and production signals, and by keeping value conversion tied to the base-year average exchange rate rather than a single spot rate, which is the approach used by Mordor Intelligence to keep the 2025 value aligned to what buyers and sellers actually transacted across regions.
Benchmark comparison
| Source | Market Size | Gaps in Research Methodology |
|---|---|---|
| Mordor Intelligence | USD 9.26 B (2025) | |
| Global Consultancy A | USD 9.82 B (2025) | Uses a longer forecast horizon and a more aggressive price escalation assumption, and its 2025 figure is presented as an estimate year that may blend early-year and late-year pricing without the same cadence of mid-year validation. |
| Regional Consultancy B | USD 9.25 B (2024) | Anchors on a 2024 base year and may apply broader averaging across chemistries, which can understate mix-driven ASP differences when non-halogen adoption rises faster in certain end uses. |
When these estimates are lined up, the remaining differences mostly come down to year selection and how price and mix are updated through the base period. By tying demand to observable end-use signals and then stress-testing ASP bands with field feedback, the resulting number stays traceable to clear inputs and repeatable steps.


Key Questions Answered in the Report
What is the 2026 value of the flame retardant chemicals market?
What is the 2026 value of the flame retardant chemicals market?
Which segment will post the fastest growth through 2031?
Which segment will post the fastest growth through 2031?
How large is Asia-Pacific in this space?
Asia-Pacific captured 50.65% of 2025 revenue and is set to expand at a 5.69% CAGR.
Why are non-halogenated additives gaining share?
Why are non-halogenated additives gaining share?
What impact will EPA’s deca-BDE ban have?
What impact will EPA’s deca-BDE ban have?
Page last updated on:


