Europe Plastic Waste Management Market Size and Share
Market Overview
| Study Period | 2020 - 2031 |
|---|---|
| Forecast Data Period | 2026 - 2031 |
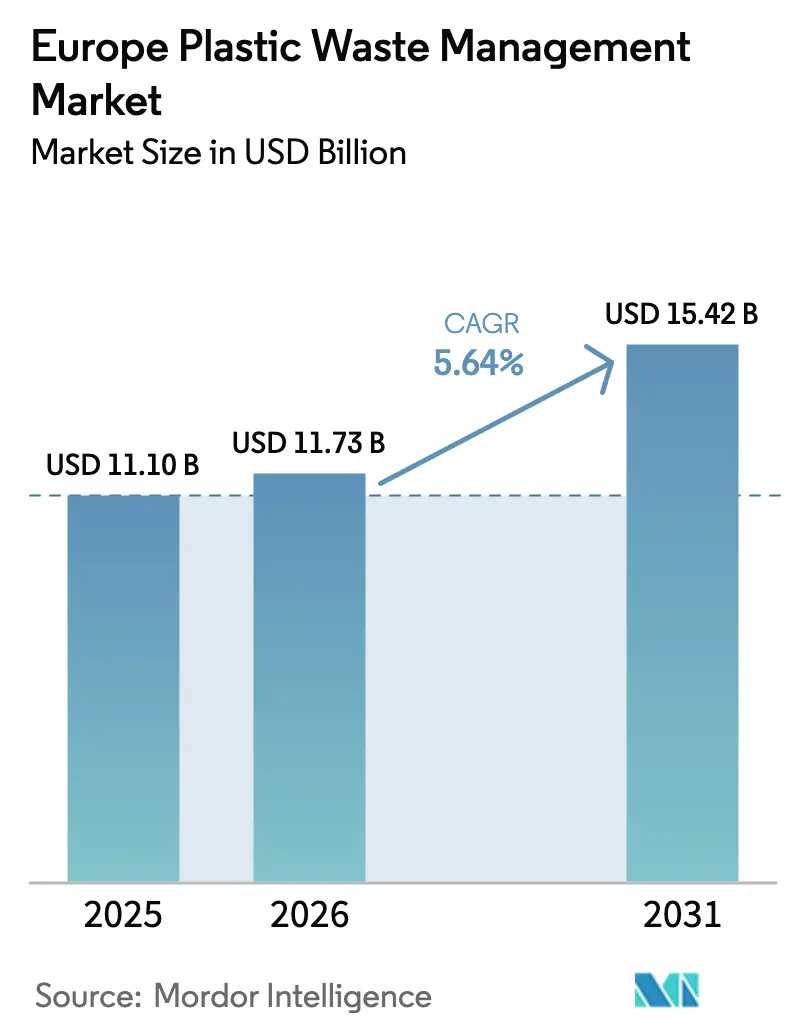
| Base Year Market Size (2025) | USD 11.1 Billion |
| Market Size (2026) | USD 11.73 Billion |
| Market Size (2031) | USD 15.42 Billion |
| Growth Rate (2026 - 2031) | 5.64% CAGR |
| Market Concentration | Medium |
Major Players *Disclaimer: Major Players sorted in no particular order Image © Mordor Intelligence. Reuse requires attribution under CC BY 4.0. | |
Europe Plastic Waste Management Market Analysis by Mordor Intelligence
The European Plastic Waste Management market size in 2026 is estimated at USD 11.73 billion, growing from 2025 value of USD 11.1 billion with 2031 projections showing USD 15.42 billion, growing at 5.64% CAGR over 2026-2031. Growth is rooted in the European Union’s move from linear disposal toward a circular economy, reinforced by the 2025 Packaging and Packaging Waste Regulation that compels full recyclability for all packaging by 2030 and imposes minimum recycled-content thresholds that rise through 2040[1]European Commission, “Packaging and Packaging Waste Regulation Enters Into Force,” ec.europa.eu. Capital is flowing into chemical recycling hubs, deposit-return infrastructure, and smart sorting systems, while tightened export rules force operators to add domestic processing capacity. At the same time, brand-owner commitments for higher recycled content create dependable offtake for recyclers, buffering the market against raw-material price swings and economic downturns.
Key Report Takeaways
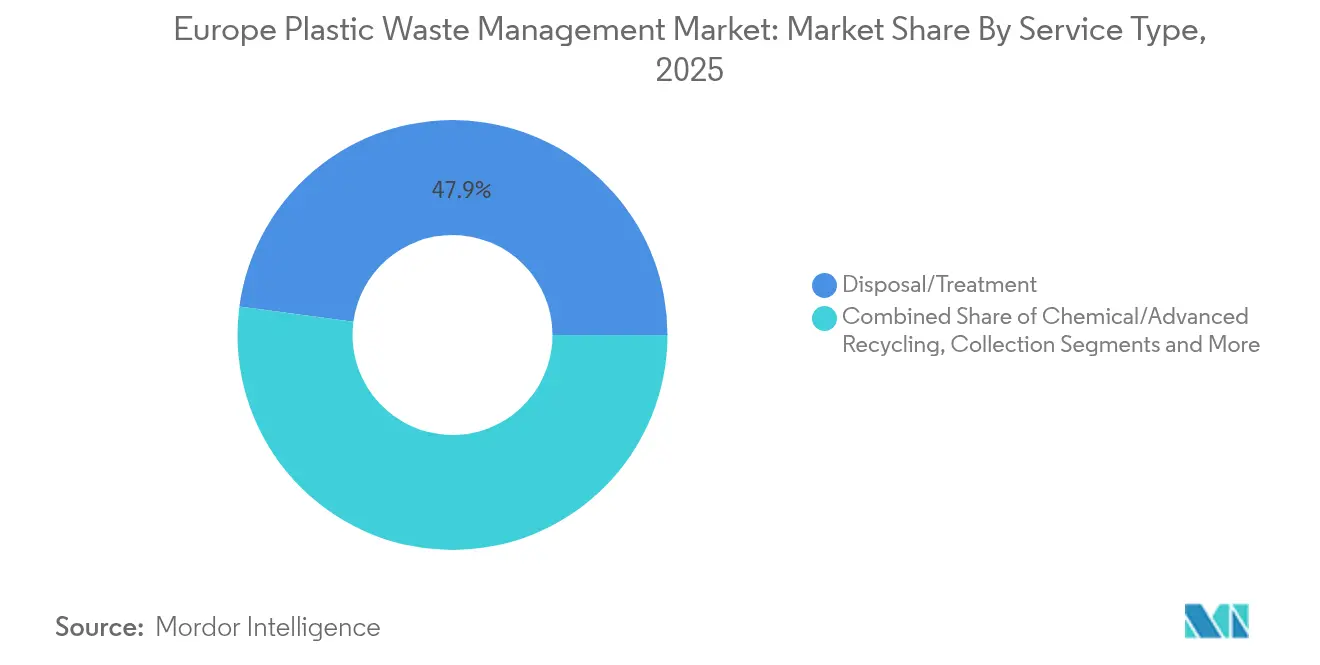
- By service type, Disposal/Treatment captured 47.89% of the European plastic waste management market share in 2025, while Chemical/Advanced Recycling is expanding at a 6.53% CAGR through 2031.
- By geography, Germany led with 21.28% revenue share in 2025; France is projected to post the fastest 6.41% CAGR to 2031.
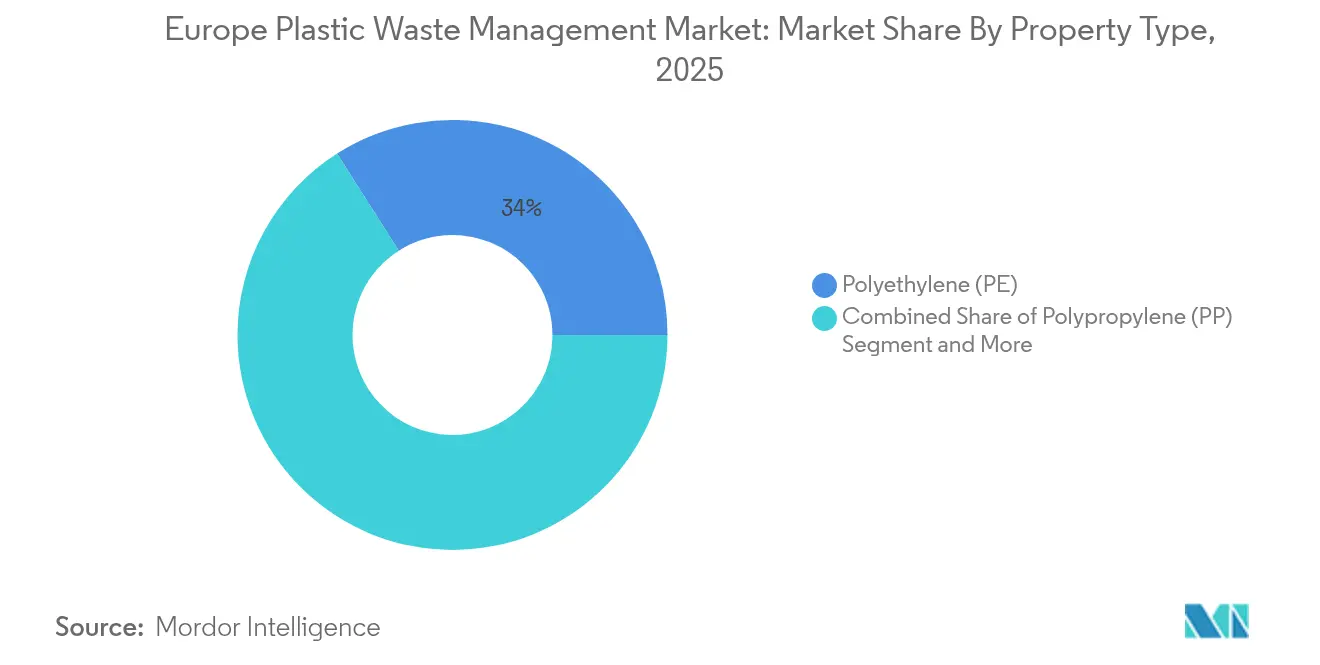
- By polymer, polyethylene held 34.02% share in 2025, whereas polypropylene is on track for the strongest 5.90% CAGR to 2031.
- By source, industrial streams contributed 42.02% of volumes in 2025; the residential segment is growing at 5.12% CAGR on the back of EU-wide deposit-return rollouts.
- By end-use, packaging generated 54.72% of 2025 revenues, while automotive & mobility is forecast to accelerate at a 6.74% CAGR to 2031.
Note: Market size and forecast figures in this report are generated using Mordor Intelligence’s proprietary estimation framework, updated with the latest available data and insights as of 2026.
Global valuation is built by aggregating outputs from multiple regions, with Europe forming one of the important contributors. Mordor Intelligence's global plastic waste management market size report represents that cumulative total.
Europe Plastic Waste Management Market Trends and Insights
Drivers Impact Analysis*
| Driver | (~) % Impact on CAGR Forecast | Geographic Relevance | Impact Timeline |
|---|---|---|---|
| EU Single-Use plastics directive accelerates collection & recycling investments | +1.2% | EU-wide; strongest in Germany & Benelux | Medium term (2-4 years) |
| Build-out of chemical recycling hubs in Benelux & Germany | +0.9% | Netherlands, Belgium, Germany | Long term (≥ 4 years) |
| Brand-owner voluntary rPET content commitments in European packaging | +0.8% | Western Europe | Short term (≤ 2 years) |
| EPR fee differentials favour high-recyclability polymers | +0.7% | EU-wide | Medium term (2-4 years) |
| Automotive OEM recycled-content mandates for EU vehicles | +0.6% | Germany, France, Italy | Long term (≥ 4 years) |
| UK Plastic Packaging Tax reshapes cross-border waste flows | +0.4% | United Kingdom, Ireland, Netherlands | Short term (≤ 2 years) |
| Source: Mordor Intelligence | |||
EU Single-Use Plastics Directive Accelerates Collection & Recycling Investments
Member states are racing to reach a 77% separate-collection target for plastic bottles by 2025 under the Single-Use Plastics Directive. Germany’s Single-Use Plastics Fund Act applies levies on producers and funnels the proceeds into collection projects, signage, and consumer education. The directive also demands 25% recycled PET in beverage bottles by 2025, climbing to 30% by 2030, prompting brand owners to sign long-term contracts with recyclers. These guaranteed offtake agreements underpin financing for new wash-line and flake-to-pellet facilities, especially in Germany and the Benelux, where infrastructure is already advanced. As collection rates rise, mechanical recyclers see higher feedstock quality, reducing residual waste and boosting margins. The resulting closed-loop volumes lower the carbon footprint of packaging portfolios and help companies satisfy Scope 3 reduction targets.
Build-Out of Chemical Recycling Hubs in Benelux & Germany
Policy makers increasingly recognize chemically recycled output as equivalent to virgin for food-contact use, spurring a new wave of large-scale projects. LyondellBasell secured a USD 43 million EU Innovation Fund grant for its Wesseling pyrolysis unit, underlining public backing for this route. The Netherlands follows suit; BioBTX is constructing a USD 86 million waste-to-aromatics plant in Groningen that will supply virgin-grade intermediates to regional converters. These clusters leverage existing petrochemical pipelines, shared utilities, and deep-water ports, cutting logistics costs and enabling reliable feedstock aggregation. Long-term offtake agreements with packaging producers further derisk the projects, anchoring the European plastic waste management market in advanced processing capability.
Brand-Owner Voluntary rPET Content Commitments in European Packaging
Global beverage and consumer-goods majors now outpace regulation with ambitious recycled-content pledges. Coca-Cola HBC, for instance, targets 35% recycled PET across its European range by 2025, rising to 50% in tighter jurisdictions. These commitments create a premium for food-grade rPET, often exceeding virgin prices, as brands prioritize supply security. Transparent scorecards under the Ellen MacArthur Foundation’s Global Commitment increase peer pressure and sharpen investor scrutiny. With reliable demand increments, recyclers secure bank financing for capacity add-ons even during raw-material price dips, lending stability to the European plastic waste management market.
EPR Fee Differentials Favour High-Recyclability Polymers
Extended Producer Responsibility (EPR) fees are now tiered across most member states, making complex multi-layer formats materially more expensive. France lifted eco-contribution charges by up to 37.5% in 2025 on hard-to-recycle items, channeling the receipts into municipal collection upgrades. Similar structures in Spain and Italy encourage converters to shift toward mono-material solutions to lower compliance costs. As design-for-recycling gains traction, demand for high-density polyethylene (HDPE) and polypropylene monomaterial packaging rises, reshaping product specifications in the European plastic waste management market.
Restraints Impact Analysis*
| Restraint | (~) % Impact on CAGR Forecast | Geographic Relevance | Impact Timeline |
|---|---|---|---|
| Down-cycling economics under low virgin polymer prices | -0.9% | EU-wide; strongest in Eastern Europe | Short term (≤ 2 years) |
| Tightened EU waste-shipment rules on mixed plastics | −0.7% | EU-wide | Medium term (2-4 years) |
| Sorting capacity gaps in CEE trigger costly waste shipments | -0.6% | Central & Eastern Europe | Medium term (2-4 years) |
| Fragmented DRS roll-out impedes PET collection scale-up | −0.5% | Select EU member states (primarily CEE) | Short term (≤ 2 years) |
| Source: Mordor Intelligence | |||
Down-Cycling Economics under Low Virgin Polymer Prices
When crude prices slump, virgin polymer values fall and squeeze recycle-to-virgin price spreads, undermining recycler margins. Eurostat shows secondary plastic traded at USD 490 per tonne in 2022 and lost much of that premium during 2023 oil softness[2]Eurostat, “Secondary Plastics Material Prices in the EU,” ec.europa.eu. Polyolefins can also lose mechanical properties after four processing loops, limiting the material to lower-value uses such as garden products. Investors, therefore, defer upgrades at moments of weak spreads, slowing capacity rollouts in the European plastic waste management market.
Sorting Capacity Gaps in CEE Trigger Costly Waste Shipments
Romania’s 2023 deposit-return launch exposed rural deficits in return-point density, forcing shipments to Western Europe and inflating logistics costs. With exports to non-OECD markets banned from late 2026, Eastern states must add domestic plants quickly or confront growing stockpiles. Until those assets come online, the European plastic waste management market absorbs higher transport expenses and faces uneven feedstock quality, especially for PET and film grades.
*Our forecasts treat driver/restraint impacts as directional, not additive. The impact forecasts reflect baseline growth, mix effects, and variable interactions.
Segment Analysis
By Polymer Type: PE Dominance Faces PP Growth Challenge
Polyethylene commanded 34.02% of the European plastic waste management market share in 2025 because of its ubiquity in flexible and rigid packaging streams. Long-standing mechanical recycling lines tailored for PE create cost advantages, while deposit-return programs channel high-purity HDPE bottles into closed loops. Yet, polypropylene is projected to advance at a 5.90% CAGR to 2031 as carmakers source recycled PP for interior trims to hit the End-of-Life Vehicles targets. The European plastic waste management market size reached USD 11.1 billion in 2025, and polyethylene therefore represents a material value pool for recyclers aiming to secure stable bale inflows.
In response, converter alliances such as NEXTLOOPP trial food-grade recycled PP, combining decontamination chemistry with digital watermarking that lifts sorting purity above 99%. Meanwhile, material suppliers supply automotive-grade PP compounds with stable mechanical properties across temperature ranges, enlarging the addressable segment for recyclers. Strategic tie-ups between refiners and chemical-recycling start-ups accelerate the shift, ensuring that polypropylene’s growth does not cannibalize markets for other polyolefins but rather broadens the European plastic waste management market.


By Source: Industrial Leadership Challenged By Residential Growth
Industrial waste streams delivered 42.02% of 2025 volumes owing to predictable bale quality and captive take-back loops in manufacturing hubs. Factories separate production scrap at origin, minimizing contamination and enabling cost-effective pelletizing. However, the residential channel is on track for a 5.12% CAGR as every member state must operate a deposit-return system by 2029. Slovakia’s rollout, which collected 100 million containers within five months, illustrates the scale of consumer participation once convenience barriers fall. This broadening feedstock portfolio boosts the European plastic waste management market by diversifying material flows and reducing reliance on industrial offcuts.
Still, uneven infrastructure remains. Southern Europe grapples with lower household-sorting engagement, while Nordic nations exceed 95% bottle-return rates. Companies are piloting smart bins with QR code technology that award instant refunds and gamify recycling. These digital tools grow public engagement and enhance data visibility for local authorities, reinforcing confidence in the European plastic waste management market.
By Service Type: Treatment Dominance Yields to Advanced Processing
Disposal and Treatment services retained a 47.89% share in 2025 because the continent still landfilled or incinerated a significant fraction of post-consumer plastics. Over the forecast horizon, Chemical/Advanced Recycling is expected to grow at 6.53% CAGR, reflecting the limitations of mechanical routes for multilayer films and contaminated streams. Neste’s USD 120 million Pulse project expansion in Finland, designed for 450,000 tons per year, typifies the shift toward liquefaction and pyrolysis pathways. These technologies cut dependency on virgin naphtha by returning hydrocarbon feedstock to crackers, strengthening the European plastic waste management market.
Collection, Transportation & Sorting, nevertheless, gains momentum as AI-driven optical sorters now push accuracy to 99.99% at industrial speeds. Operators deploy cloud-enabled monitoring to optimize bale routing and maximize plant uptime. Adjacent consulting and compliance services flourish as firms navigate diverging national fee structures and traceability rules. Together, the upgraded ecosystem supports progressively higher recycling yields and underpins investor confidence across the European plastic waste management market.
By End-Use Industry: Packaging Leads While Automotive Accelerates
Packaging accounted for 54.72% of market activity in 2025, reflecting stringent EU content targets and visible consumer preferences for recycled solutions. Brand owner roadmaps already point to 30% recycled content in PET bottles for major beverage lines by 2026, hard-wiring demand into the European plastic waste management market. Automotive & Mobility, meanwhile, is poised for the quickest expansion at a 6.74% CAGR. The shift to electric vehicles multiplies the number of interior and under-hood components that can utilize recycled polypropylene and polyamide, opening a fresh avenue for value creation.
Automakers collaborate with recyclers to certify traceable, low-odor compounds that match virgin performance. BMW, for example, sources recycled PP for interior trims while Renault tests closed-loop bumper-to-bumper programs. Construction likewise ups its share as green-building norms push for recycled content in pipes and insulation. Though smaller today, textiles rise on the back of separate collection rules effective across the bloc by 2025. This diversification spreads risk and expands the addressable European plastic waste management market size for technology vendors and waste operators alike.
Geography Analysis
Germany remained the largest national player with 21.28% of 2025 revenues, underpinned by mature EPR infrastructure, robust automotive demand for recycled polymers, and early adoption of chemical recycling. Mura Technology’s 120-kiloton plant at Dow’s Böhlen site underscores Germany’s leading role in scaling pyrolysis, while public levies from the Single-Use Plastics Fund Act feed a continuous pipeline of municipal projects. Rapid permitting processes and coordinated state-level subsidies make the country the anchor of investment for the European plastic waste management market.
France records the fastest projected 6.41% CAGR to 2031, propelled by a USD 540 million state-aid scheme for chemical recycling that covers up to 40% of eligible capital outlays. Higher eco-fees, rising by as much as 37.5% on hard-to-recycle items, nudge brand owners toward mono-material formats. The government’s textile EPR program, already achieving 30% collection, adds a multifaceted feedstock base and widens the scope of the European plastic waste management market.
The Benelux and Nordic regions combine high consumer environmental awareness with dense petrochemical clusters. Freepoint Eco-Systems’ 80,000-ton project in Ghent benefits from deep-sea port access and the ambition to double capacity within five years. The Netherlands, via Groningen’s BioBTX aromatics facility, demonstrates policy alignment that accelerates advanced-recycling uptake. Conversely, Central and Eastern Europe grapple with sorting deficits; EU cohesion funds are now channelled toward modern material-recovery facilities, promising medium-term catch-up and deeper integration into the wider European plastic waste management market.
Coverage of the plastic waste management market by Mordor Intelligence spans a wide geographic footprint, with regional analysis available for North America and Asia, alongside detailed country-level intelligence for India, each shaped by local operating conditions.
Competitive Landscape
Competition remains fragmented in collection and municipal sorting where regional specialists leverage long-standing contracts and low-cost logistics. Veolia, SUEZ, and REMONDIS anchor these networks, yet face pressure from city councils that increasingly split tenders into smaller lots to spur local participation and job creation. Margins in this tier depend on route density and technology solutions that cut contamination, a dynamic that keeps barriers to entry moderate in the European plastic waste management market.
Higher up the value chain, chemical recycling shows rapid consolidation because of capital intensity and technology risk. OMV’s strategic link-up with Borealis integrates feedstock procurement from municipal waste routes with cracker output, securing scope and scale. LyondellBasell advances mass-balance certified resins through joint ventures, locking in demand from packaging and automotive clients eager for carbon-footprint cuts. Such vertical alliances raise financial thresholds and concentrate bargaining power.
Digitalization is an emerging battleground. TOMRA’s AI-assisted sorters enable near-real-time bale certification, becoming a de facto industry standard. Indorama Ventures and ALPLA deploy digital product passports that document origin, composition, and recycled content, capturing a traceability premium. Smaller innovators like MBA Polymers commercialize specialty compounds for electronics, carving profitable niches. The convergence of feedstock control, advanced processing, and data transparency creates a competitive moat that shapes the future structure of the European plastic waste management market.
Europe Plastic Waste Management Industry Leaders
Veolia Environnement SA
SUEZ SA
REMONDIS SE & Co. KG
Biffa plc
FCC Environment (FCC Servicios Medio Ambiente)
- *Disclaimer: Major Players sorted in no particular order

Recent Industry Developments
- February 2025: European Commission approves USD 540 million French state-aid scheme for chemical recycling of contaminated plastic waste.
- February 2025: EU Packaging and Packaging Waste Regulation enters force, mandating full recyclability by 2030 and setting 30% recycled-content floors for PET food packaging.
- February 2025: Freepoint Eco-Systems signs concession with North Sea Port to build an 80,000-ton advanced recycling unit in Ghent, Belgium, with expansion plans to 160,000 tons.
- January 2025: Neste completes the first phase of USD 120 million Pulse project, doubling liquefied plastic waste processing in Porvoo, Finland.


Research Methodology Framework and Report Scope
Market Definitions and Key Coverage
Our study defines the Europe plastic waste management market as all revenue earned when public or private operators collect, transport, sort, mechanically or chemically recycle, incinerate with energy recovery, or landfill post-consumer and post-industrial plastic streams across the EU-27, the United Kingdom, Norway, Switzerland, and Iceland. According to Mordor Intelligence, this unified lens captures the full service chain that converts discarded plastics into either recovered resources or controlled residues.
Scope exclusions: We exclude non-plastic municipal refuse, biodegradable polymers outside standard resin codes, and the sale of equipment or plant design services.
Segmentation Overview
- By Polymer Type
- Polyethylene (PE)
- Polypropylene (PP)
- Polyethylene Terephthalate (PET)
- Polystyrene (PS)
- Polyvinyl Chloride (PVC)
- Other Polymers (ABS, PA, etc.)
- By Source
- Industrial
- Commercial (Retail & Office)
- Residential
- Construction & Demolition
- Others(Institutional, Healthcare, Curb-side waste, etc.))
- By Service Type
- Collection, Transportation & Sorting
- Disposal/ Treatment
- Mechanical Recycling
- Chemical / Advanced Recycling
- Incineration with Energy Recovery
- Controlled Landfilling
- Others (Consulting, Audit & Training, etc.)
- By End-Use Industry
- Packaging
- Construction
- Automotive & E-Mobility
- Electrical & Electronics
- Textiles & Fashion
- Healthcare
- Others (Agriculture, Consumer Goods, etc.)
- By Geography
- United Kingdom
- Germany
- France
- Italy
- Spain
- BENELUX (Belgium, Netherlands, and Luxembourg)
- NORDICS (Denmark, Finland, Iceland, Norway, and Sweden)
- Rest of Europe
Detailed Research Methodology and Data Validation
Primary Research
We spoke with regulators, producer-responsibility scheme managers, mechanical recyclers, chemical-recycling start-ups, and waste-to-energy operators across Germany, France, the Nordics, and the United Kingdom. These interviews clarified hidden losses, contract price dispersion, and commissioning timelines, helping us validate and fine-tune every assumption.
Desk Research
We began by mining authoritative portals such as Eurostat waste statistics, European Environment Agency recycling indicators, PlasticsEurope circular-economy dashboards, national environment ministry releases, and UN Comtrade shipment logs. Company filings and reputable press accessed through Dow Jones Factiva and D&B Hoovers added facility capacities, gate-fee bands, and cross-border flow clues. This evidence base shaped country-level generation volumes, treatment splits, and fee curves. The sources listed are illustrative; our desk review tapped many further documents for checks and context.
In a second sweep, our team aligned time series, harmonized currencies, and mapped regulatory milestones so the numbers rest on comparable frames.
Market-Sizing & Forecasting
A top-down and bottom-up blend underpins the model. We start with Eurostat plastic waste generation, adjust for under-reporting and exports, and multiply each treatment route by averaged processing fees to build 2025 revenue. Supplier roll-ups and sampled average selling price by tonnage checks anchor the bottom-up sense test. Key model drivers include recycled-content mandates, EPR fee trajectories, incineration gate-fee inflation, chemical-recycling capacity ramps, and per-capita waste generation shifts. Multivariate regression that links revenue to GDP, packaging demand, and dated policy triggers carries the forecast to 2030.
Data Validation & Update Cycle
Outputs face variance checks versus historic disposal rates, currency conversions, and margin benchmarks before a two-stage analyst review. We refresh each dataset annually and issue interim updates when material policy or capacity events occur so clients always receive our latest grounded view.
Why Mordor's Europe Plastic Waste Management Baseline commands confidence
Published estimates often differ because each firm chooses its own service basket, geography cuts, and fee assumptions.
By standardizing definitions, applying consistent currency years, and refreshing inputs yearly, Mordor Intelligence delivers a midpoint that decision-makers can trace and reproduce.
Benchmark comparison
| Market Size | Anonymized source | Primary gap driver |
|---|---|---|
| USD 11.10 bn (2025) | Mordor Intelligence | - |
| USD 7.90 bn (2024) | Regional Consultancy A | Omits energy-from-waste revenues and excludes Norway and Switzerland |
| USD 13.75 bn (2024) | Industry Portal B | Adds recycled-resin sales and applies one blended EU fee without country splits |
The comparison shows that once service definitions and country coverage are normalized, our carefully triangulated figure stands as the most transparent and dependable baseline for strategic planning.


Key Questions Answered in the Report
What is the value of the European plastic waste management market today?
The market stands at USD 11.73 billion in 2026 and is projected to reach USD 15.42 billion by 2031.
How fast is the market expected to grow?
It is forecast to expand at a 5.64% compound annual growth rate during 2026-2031.
Which country currently leads in market share, and which one is growing the fastest?
Germany holds the largest share at 21.28% in 2025, while France is set to grow the quickest with a 6.41% CAGR through 2031.
What service type accounts for the biggest revenue share?
Disposal/Treatment dominates with 47.89% of 2025 revenues; Chemical/Advanced Recycling is the fastest-rising service at a 6.53% CAGR.
Which polymer commands the greatest share and which polymer is gaining momentum?
Polyethylene leads with a 34.02% share in 2025; polypropylene shows the strongest growth outlook at a 5.90% CAGR.
How are EU regulations influencing market growth?
Measures such as the Single-Use Plastics Directive and the Packaging and Packaging Waste Regulation mandate higher collection targets and recycled-content thresholds, directly boosting infrastructure investment and recycled-material demand across Europe.
Page last updated on:


