
Recycled Furniture Market Size and Share
Market Overview
| Study Period | 2020 - 2031 |
|---|---|
| Market Size (2026) | USD 12.28 Billion |
| Market Size (2031) | USD 17.40 Billion |
| Growth Rate (2026 - 2031) | 7.21 % |
| Fastest Growing Market | Asia-Pacific |
| Largest Market | Europe |
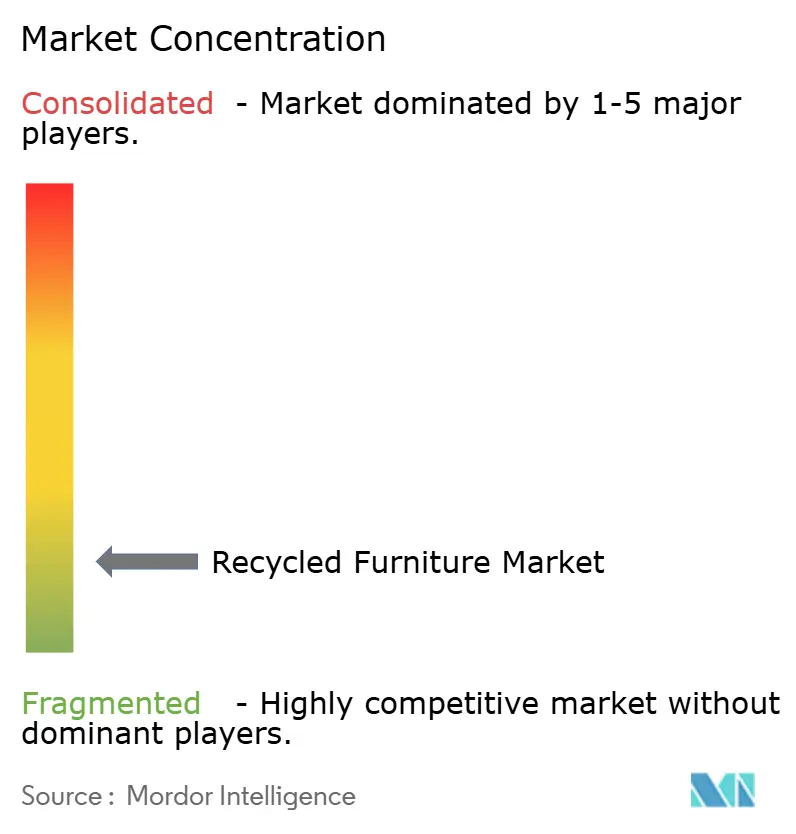
| Market Concentration | Low |
Major Players *Disclaimer: Major Players sorted in no particular order Image © Mordor Intelligence. Reuse requires attribution under CC BY 4.0. | |
Recycled Furniture Market Analysis by Mordor Intelligence
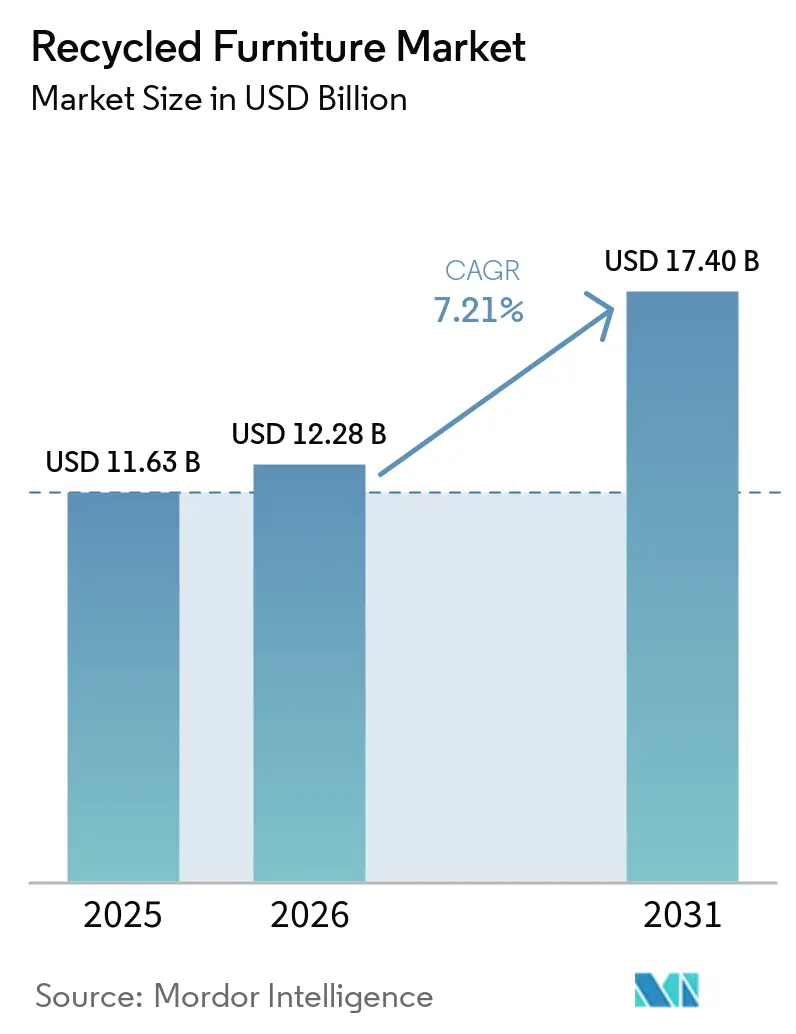
The recycled furniture market size is projected to expand from USD 11.63 billion in 2025 and USD 12.28 billion in 2026 to USD 17.40 billion by 2031, registering a CAGR of 7.21% between 2026 and 2031. The recycled furniture market is gaining support from rules that are making repairability, recycled content, and product traceability more important in furniture purchasing decisions across Europe. Colorado's requirement that state agencies procure furniture with a minimum of 30% post-consumer recycled content, adopted in 2025, and the University of California's Sustainable Procurement Guidelines (February 2026), embedding mandatory indoor furniture green spend criteria, illustrate how subnational public-sector mandates are creating structurally guaranteed demand pools that did not exist in the prior growth cycle[1]. The recycled furniture market also benefits from hybrid work, which releases large volumes of usable commercial furniture into secondary channels while keeping sustainability documentation important for office buyers. Large manufacturers are responding by expanding circular programs and scale, and the HNI acquisition of Steelcase in 2025 shows that competitive advantage is moving toward firms that combine refurbishment capability, procurement access, and verified sustainability credentials. This leaves the recycled furniture market with a stronger medium-term demand base, but it also raises the importance of sorting quality, product documentation, and efficient recovery systems.
Key Report Takeaways
- By product type, home furniture accounted for 55.25% of the recycled furniture market share in 2025, whereas office furniture is forecast to grow at a 7.95% CAGR through 2031.
- By material type, reclaimed/recycled wood held 46.52% of the recycled furniture market share in 2025 and is simultaneously forecast to grow at 8.11% CAGR through 2031, making it the only segment that leads on both dimensions.
- By distribution channel, online marketplaces held 39.81% of the recycled furniture market share in 2025, whereas brand-owned buyback and refurbishment channels are forecast to grow at 7.80% CAGR through 2031.
- By geography, Europe held 33.54% of the recycled furniture market share in 2025, whereas Asia-Pacific is forecast to grow at 8.42% CAGR through 2031.
Note: Market size and forecast figures in this report are generated using Mordor Intelligence’s proprietary estimation framework, updated with the latest available data and insights as of January 2026.
Market Trends and Insights
Drivers Impact Analysis of Recycled Furniture Market*
| Driver | (~) % Impact on CAGR Forecast | Geographic Relevance | Impact Timeline |
|---|---|---|---|
| Rising Corporate ESG Procurement for Furniture | +1.6% | Global, strongest in North America and Europe | Short term (≤ 2 years) |
| Expansion of Recommerce, Buyback, and Reverse Logistics Models | +1.4% | North America, Europe, Asia-Pacific | Short term (≤ 2 years) |
| Premiumization of Traceable Reclaimed and Upcycled Materials | +0.9% | Europe, North America | Medium term (2-4 years) |
| Modular, Repairable Furniture Extending Product Life Cycles | +0.7% | Global, with a strong regulatory push in Europe | Medium term (2-4 years) |
| Hybrid Work and Space Compression | +0.8% | North America, Europe, and the core Asia-Pacific markets | Short term (≤ 2 years) |
| Digital Product Passports and Traceability Infrastructure | +0.6% | Europe mandatory first, then broader adoption | Long term (≥ 4 years) |
| Source: Mordor Intelligence | |||
Rising Corporate ESG Procurement for Furniture
Corporate procurement policies are becoming stricter, and that is giving the recycled furniture market a more stable demand base. The University of California updated its Sustainable Procurement Guidelines in February 2026 and embedded green spend rules for indoor furniture, recycled-content expectations, chemical disclosure requirements, and take-back service requirements into its purchasing practices. That kind of framework makes sustainability documentation part of vendor qualification rather than a soft preference. As more institutional buyers use similar rules, the recycled furniture market gains stronger access to budgeted and recurring procurement flows. Certified suppliers are also better positioned to protect margins because buyers cannot easily trade away compliance-linked features once they are written into contract terms.
Expansion of Recommerce, Buyback, and Reverse Logistics Models
The recycled furniture market is also growing as resale and recovery channels become more organized and less informal. Large furniture companies are building formal take-back and resale systems, and IKEA’s FY2025 circularity update showed continued progress in buyback, resale, and spare-parts support across its system[2]. Steelcase has also developed a long-running recovery and reconditioning model through Circular by Steelcase, which helps extend product life and keep more furniture in managed reuse channels. Vitra has widened access to pre-owned and buy-back options through its Vitra Circle model for both private and contract customers. As these systems spread, the recycled furniture market gets better control over supply quality, customer trust, and value retention.
Premiumization of Traceable Reclaimed and Upcycled Materials
Traceable reclaimed inputs are helping the recycled furniture market move beyond a discount-only position. Research published in Sustainability in 2025 confirmed that furniture components can be manufactured from wood waste to commercial quality when production is designed around input variability[3]. BioResources also described reclaimed wood businesses as operating across both remanufacturing and as-new upcycled production models, which supports broader pricing options. Vepa has turned that logic into products by using upcycled coffee sacks, ocean-bound PET, and circular materials in commercial furniture ranges. This mix of design appeal, verifiable origin, and circular value helps the recycled furniture market attract buyers who want both sustainability and product differentiation.
Digital Product Passports and Traceability Infrastructure
Traceability systems are becoming increasingly important in the recycled furniture market as regulations move toward clearer product information. The EU Ecodesign for Sustainable Products Regulation, which entered into force in July 2024, created the framework for stronger product information, repairability, and circularity requirements across priority product groups, including furniture-related applications[4]. NORNORM has already deployed circular passports across its subscription furniture model, showing that digital tracking can support asset management, reuse optimization, and customer reporting before full regulatory enforcement arrives. Early movers can use these systems to improve inventory visibility and strengthen tender readiness. Over time, the recycled furniture market is likely to reward operators that can verify material history and reuse performance in a simple and auditable format.
Restraints Impact Analysis of Recycled Furniture Market*
| Restraint | (~) % Impact on CAGR Forecast | Geographic Relevance | Impact Timeline |
|---|---|---|---|
| Inconsistent Feedstock Quality and Provenance Verification | -0.9% | Global, most acute in Asia-Pacific and Middle East, and Africa | Medium term (2-4 years) |
| High Refurbishment, Sorting, and Logistics Costs | -1% | Global, with greater pressure outside dense metro areas | Short term (≤ 2 years) |
| Limited Standardization for Safety, Durability, and Fire Compliance | -0.7% | Europe, the United Kingdom, North America | Long term (≥ 4 years) |
| Brand Perception Gaps in Used and Refurbished Furniture | -0.6% | Emerging markets and residential channels globally | Medium term (2-4 years) |
| Source: Mordor Intelligence | |||
Inconsistent Feedstock Quality and Provenance Verification
The recycled furniture market still faces a major operational constraint: inconsistent inbound supply. Research from Chalmers University found that remanufacturing remains uncommon in the Swedish furniture sector because reverse logistics are underdeveloped, product designs are often not suited to circular recovery, and procurement systems are not yet aligned with these flows. That problem matters because used furniture often enters secondary channels without clear material records or service history. The absence of reliable provenance makes quality control slower and can weaken customer confidence. It also favors larger firms that control both the first-sale and take-back channels, leaving smaller recyclers at a structural disadvantage in the recycled furniture market.
High Refurbishment, Sorting, and Logistics Costs
High handling costs remain another clear restraint on the recycled furniture market. Furniture is bulky, condition varies from item to item, and products often need inspection, disassembly, repair, cleaning, and reassembly before resale. Chalmers University identified high per-unit handling costs and the lack of standardized disassembly protocols as core reasons why many furniture companies still see remanufacturing as economically difficult. Those cost pressures are harder to manage outside dense urban corridors where collection volumes are lower, and transport legs are longer. As a result, the recycled furniture market expands faster, enabling operators to cluster supply, labor, refurbishment, and resale demand within the same network.
*Our forecasts treat driver/restraint impacts as directional, not additive. The impact forecasts reflect baseline growth, mix effects, and variable interactions.
Recycled Furniture Market Segment Analysis
By Product Type:
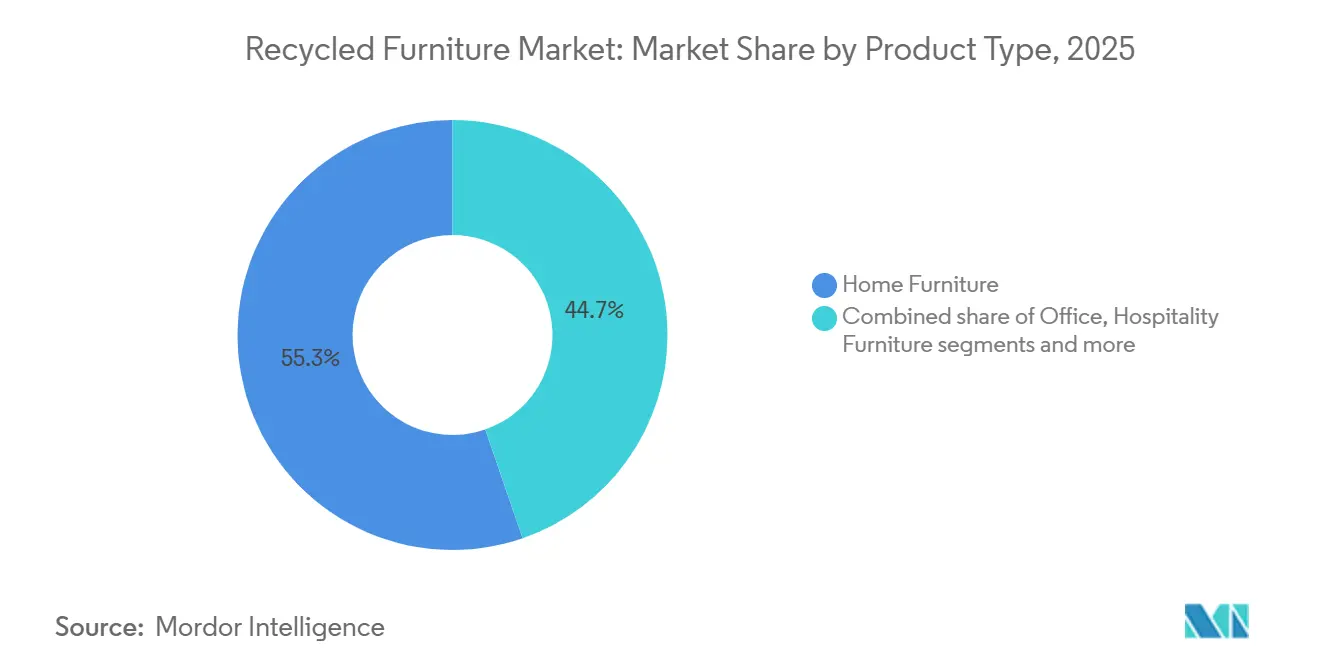
Office Sector Reshapes the Premium Recovery TierHome Furniture led the product mix with 55.25% of the recycled furniture market share in 2025, while office furniture is projected to grow at 7.95% CAGR through 2031. Home Furniture remains the largest segment because household buyers are already familiar with second-hand tables, seating, storage units, and bedroom furniture. That familiarity is helping the recycled furniture market maintain a broad volume base even as buyers become more selective about appearance and condition. Office Furniture is growing faster as it enters reuse channels in larger, more standardized lots. Hybrid work is releasing more commercial furniture from corporate sites, which gives refurbishers access to premium inventory that can be resold with clear performance value.
Commercial furniture also has a design advantage for circular recovery. The 2026 EPJ Web of Conferences study confirmed that modular design and design-for-disassembly methods support component recovery and longer material use cycles in furniture systems. That suits office chairs, workstations, and desks better than many mixed-material household items. In the recycled furniture industry, that means office products can move into a premium refurbishment tier with stronger margins and clearer technical claims. Hospitality, education, and healthcare furniture still represent smaller shares, but each of these categories benefits when tender-based buying, durability requirements, and budget pressure align around verified reuse.

By Material Type:
Reclaimed Wood Anchors Both Scale and Margin SimultaneouslyReclaimed/Recycled Wood accounted for 46.52% of the recycled furniture market in 2025 and is projected to expand at a 8.11% CAGR through 2031. This makes wood both the largest and the fastest-growing material type in the recycled furniture market. Its position reflects a strong fit between design demand, established craftsmanship, and the ability to market visible circularity to buyers. MDPI research published in 2025 showed that wood waste can be processed into high-quality furniture components at a commercial scale when production geometry is designed around material variation. That gives the segment a technical base that goes beyond artisan or niche production.
BioResources further showed that reclaimed wood businesses can operate through both product-life extension and as-new production using upcycled inputs. That dual role gives wood a wider pricing range than many competing materials in the recycled furniture industry. Recycled metal remains important for durable contract and outdoor uses, while recycled plastic and composite materials are gaining attention as manufacturers test broader circular-material portfolios. Vepa’s Circular Center and related product development work show that component-level reuse and alternative circular inputs can be commercialized within modern furniture manufacturing systems. Even so, reclaimed wood still sets the pace because it combines scale, visual appeal, and easier buyer recognition within the recycled furniture market.
By Distribution Channel:
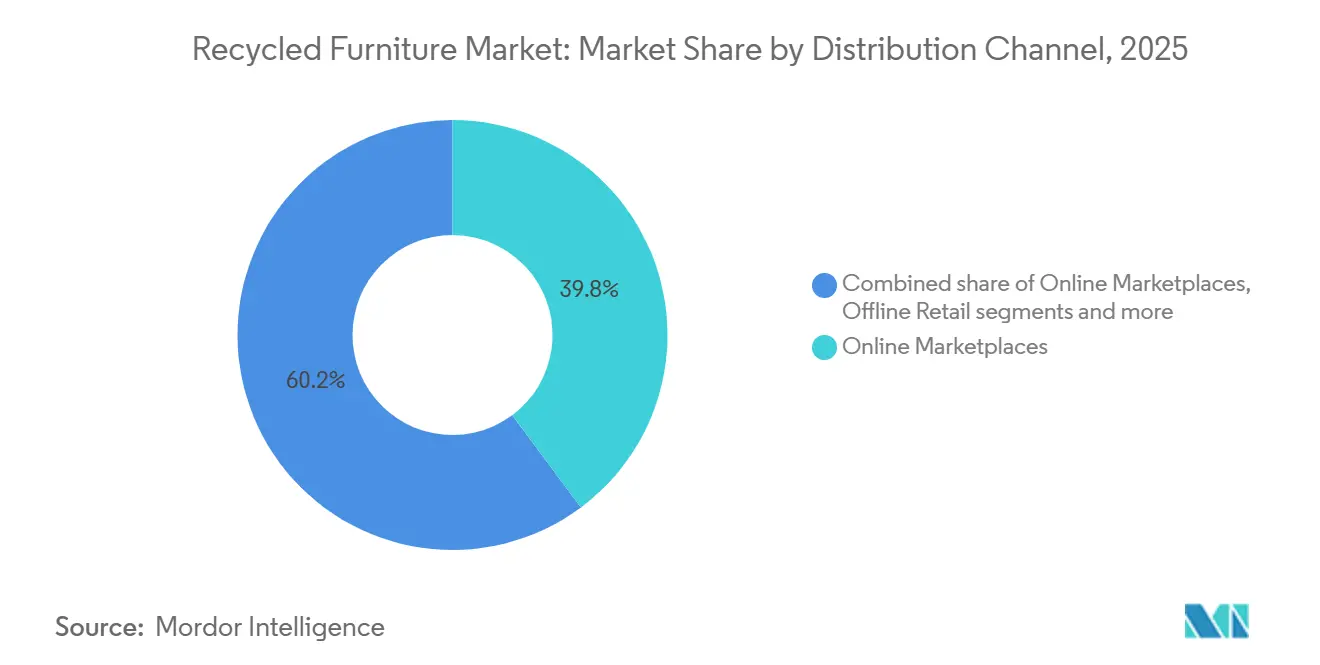
Brand-Owned Channels Accelerate Value RetentionOnline Marketplaces accounted for 39.81% of the recycled furniture market in 2025, while brand-owned buyback and refurbishment channels are forecast to grow at a 7.80% CAGR through 2031. Online platforms lead because they offer a broad assortment of visibility, easy comparison, and lower search costs for household buyers. This keeps them central to the recycled furniture market, especially in residential categories where convenience often drives the first transaction. Brand-owned channels are growing faster because manufacturers are trying to retain more value from products after the first sale. IKEA’s global circularity work and Vitra’s Circle model both demonstrate how major brands are establishing more formal pathways for returns, repairs, resale, and re-entry into use.
Steelcase offers another strong example through Circular by Steelcase, which provides reconditioning and reuse options that support authenticated resale. These models improve trust because the original manufacturer can verify condition, compatibility, and service potential. Specialty resale stores and offline project sales still matter for customers who need inspection, project coordination, or logistics support. Over time, the recycled furniture market is likely to see more share shift toward channels that combine digital discovery with documented quality assurance. That shift is especially relevant in the recycled furniture market, where procurement teams increasingly need evidence, not only price.
Geography Analysis
Europe Recycled Furniture Market
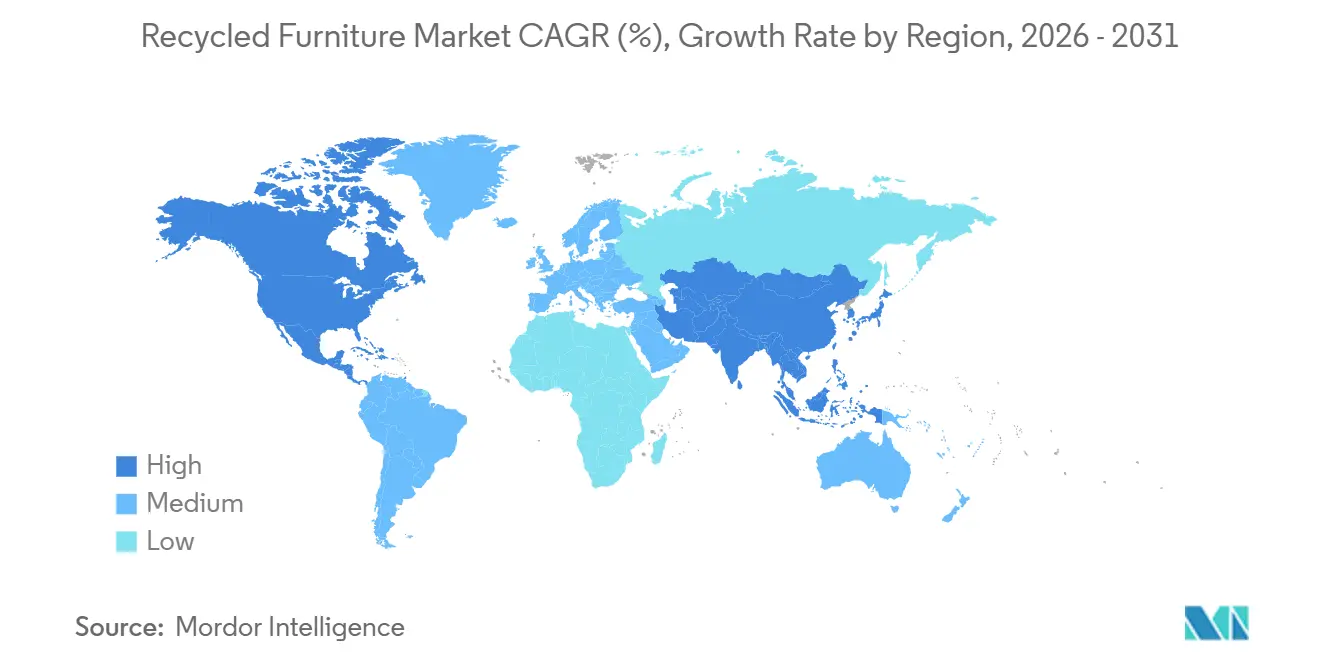
Europe held 33.54% of the recycled furniture market in 2025 and accounted for 33.54% share of the recycled furniture market size in the same year. The region leads because regulation, procurement policy, and refurbishment capacity are more developed than in most other regions. The EU Ecodesign for Sustainable Products Regulation has increased the importance of repairability, recycled content, and product information in furniture-related compliance planning. Kinnarps is participating in the GRACE research project and continues to position circular product development as part of its wider sustainability work. NORNORM is also operating a profitable circular subscription model across multiple European countries, which shows that reuse-led furniture service models can scale within the region.
APAC Recycled Furniture Market
Asia-Pacific is the fastest-growing region, with the recycled furniture market in this geography projected to grow at a 8.42% CAGR through 2031. Japan is an important driver because its circular-economy policies and development of recycled wood are supporting new material applications in furniture manufacturing. The region also benefits from urban growth, expanding corporate office footprints, and rising acceptance of structured reuse channels in major cities, supporting the development of the second hand furniture market alongside organized refurbishment and resale models. That combination supports the simultaneous creation of both supply and demand. The recycled furniture market grows faster here because newer business districts, higher office churn, and the adoption of digital resale create favorable conditions for organized recovery and resale.
The Americas and MEA Recycled Furniture Market
North America remains a mature but active region in the recycled furniture market, supported by institutional procurement and growing circular service models. The University of California’s 2026 guidelines show how public and quasi-public buyers are embedding formal sustainability conditions into furniture sourcing. Massachusetts also showed the reuse potential of public-sector office assets by repurposing 3,364 workstations and diverting more than 841 tons of material from landfill between 2022 and 2025. South America remains earlier in development, while the Middle East and Africa present longer-term opportunities as sustainability standards, urbanization, and modern procurement systems deepen. Across these regions, the recycled furniture market tends to accelerate where procurement rules, refurbishment networks, and verified reuse channels develop together.
Competitive Landscape
The recycled furniture market includes fragmented regional refurbishers, specialized circular brands, and large manufacturers with formal recovery programs. This structure keeps the market open, but it also raises pressure on middle-tier players that lack either scale or strong documentation. HNI’s completion of the Steelcase acquisition in December 2025 shifted the competitive landscape by creating a much larger workplace furnishings platform with broader reach and greater operating leverage. That move matters because large contract buyers increasingly want suppliers that can combine volume, service, and verified sustainability performance within the same relationship.
Large manufacturers are also embedding circularity into their brand strategies rather than treating it as a side program. MillerKnoll reported diverting 4.2 million pounds of furniture from landfills in FY2025 and achieving 100% renewable electricity across its global manufacturing operations, followed by an EcoVadis Gold Medal announcement in April 2026. Steelcase continues to use Circular by Steelcase as a practical benchmark for manufacturer-led reconditioning and resale services. NORNORM is pushing a different model that retains asset ownership and uses subscription-service economics to capture value across repeated use cycles. These examples show that the recycled furniture market is rewarding both scale-based operators and service-led circular specialists.
A second layer of competition is forming around traceability and design credibility. Sedus strengthened its climate positioning in 2025 and 2026 through its SBTi commitment, carbon footprint reduction efforts, and broader sustainability partnerships. Nowy Styl’s RE: THINK Design Competition also showed that traditional producers are using open design initiatives to improve the circularity of product architecture. In the recycled furniture market, that means future advantage will come not only from recovery volume, but also from the ability to prove how products were designed, reused, and documented. Companies that cannot verify those claims will face a more difficult path through institutional and contract channels as buyer requirements become more formal.
Recycled Furniture Industry Leaders
-
IKEA
-
Steelcase Inc.
-
MillerKnoll, Inc.
-
Haworth, Inc.
-
HNI Corporation
- *Disclaimer: Major Players sorted in no particular order
Recycled Furniture Market Companies Covered in this Report
- IKEA
- Steelcase Inc.
- MillerKnoll, Inc.
- Haworth, Inc.
- HNI Corporation
- Teknion Corporation
- Kinnarps AB
- Vitra International AG
- Sedus Stoll AG
- Nowy Styl Group
- KI
- Fursys Co., Ltd.
- Martela Oyj
- Ahrend
- Vepa The Furniture Factory
- NORNORM
- Wilkhahn
- Inter IKEA Systems B.V.
- Green Standards
- Emeco
Recent Industry Developments in Recycled Furniture Market
- April 2026: MillerKnoll received an EcoVadis Gold Medal, placing the company in the top 5% of firms globally assessed for business sustainability. The recognition reflected validated SBTi greenhouse gas reduction targets, 100% renewable electricity across all global manufacturing facilities.
- January 2026: Sedus Stoll Group partnered with Wilderness International to support the legally secured preservation of threatened primary forests and separately partnered with regenerative agriculture platform Klim to increase carbon storage in agricultural soils. These efforts extended the climate compensation program beyond the Scope 1 and 2 carbon neutrality achieved at the Dogern and Geseke production sites by the end of 2025.
- November 2025: MillerKnoll released its 2025 Better World Report, documenting 4.2 million pounds (1.9 million kilograms) of furniture diverted from landfills in FY2025 through take-back, refurbishment, and donation programs. It was equivalent to keeping 102,439 Aeron Chairs in active use. The company also confirmed achieving 100% renewable electricity across global manufacturing ahead of the FY2026 deadline.
- October 2025: NORNORM secured USD 58.81 million (EUR 50 million) in new funding from existing investors, including Inter IKEA, Verdane, Philian AB, and Banco Santander, bringing total capital raised to USD 58.81 million (EUR 170 million). The company reported USD 16.46 million (EUR 14 million) in annual subscription revenue, over 360,000 m2 of furnished office space, and profitability across all core markets, operating in 17 countries and 59 cities.
Global Recycled Furniture Market Report Scope
Segmentation Overview
| Home Furniture | Chairs |
| Tables (side tables, coffee tables, dressing tables, etc.) | |
| Beds | |
| Wardrobes | |
| Sofas | |
| Dining Tables/Dining Sets | |
| Kitchen Cabinets | |
| Other Home Furniture (bathroom furniture, outdoor furniture, etc.) | |
| Office Furniture | Chairs |
| Tables | |
| Storage Cabinets | |
| Desks | |
| Sofas and Other Soft Seating | |
| Other Office Furniture | |
| Hospitality Furniture | |
| Educational Furniture | |
| Healthcare Furniture | |
| Other Applications |
| Reclaimed/Recycled Wood |
| Recycled Metal |
| Recycled Plastic |
| Recycled and Composite Materials |
| Other Materials |
| Online Marketplaces |
| Specialty Re-Sale Stores |
| Brand-Owned Buyback and Refurbishment Channels |
| Offline Retail and Project Sales |
| Other Distribution Channels |
| North America | Canada |
| United States | |
| Mexico | |
| South America | Brazil |
| Peru | |
| Chile | |
| Argentina | |
| Rest of South America | |
| Europe | United Kingdom |
| Germany | |
| France | |
| Spain | |
| Italy | |
| BENELUX (Belgium, Netherlands, and Luxembourg) | |
| NORDICS (Denmark, Finland, Iceland, Norway, and Sweden) | |
| Rest of Europe | |
| Asia-Pacific | India |
| China | |
| Japan | |
| Australia | |
| South Korea | |
| South East Asia (Singapore, Malaysia, Thailand, Indonesia, Vietnam, and the Philippines) | |
| Rest of Asia-Pacific | |
| Middle East and Africa | United Arab Emirates |
| Saudi Arabia | |
| South Africa | |
| Nigeria | |
| Rest of the Middle East and Africa |
| By Product Type | Home Furniture | Chairs |
| Tables (side tables, coffee tables, dressing tables, etc.) | ||
| Beds | ||
| Wardrobes | ||
| Sofas | ||
| Dining Tables/Dining Sets | ||
| Kitchen Cabinets | ||
| Other Home Furniture (bathroom furniture, outdoor furniture, etc.) | ||
| Office Furniture | Chairs | |
| Tables | ||
| Storage Cabinets | ||
| Desks | ||
| Sofas and Other Soft Seating | ||
| Other Office Furniture | ||
| Hospitality Furniture | ||
| Educational Furniture | ||
| Healthcare Furniture | ||
| Other Applications | ||
| By Material Type | Reclaimed/Recycled Wood | |
| Recycled Metal | ||
| Recycled Plastic | ||
| Recycled and Composite Materials | ||
| Other Materials | ||
| By Distribution Channel | Online Marketplaces | |
| Specialty Re-Sale Stores | ||
| Brand-Owned Buyback and Refurbishment Channels | ||
| Offline Retail and Project Sales | ||
| Other Distribution Channels | ||
| By Geography | North America | Canada |
| United States | ||
| Mexico | ||
| South America | Brazil | |
| Peru | ||
| Chile | ||
| Argentina | ||
| Rest of South America | ||
| Europe | United Kingdom | |
| Germany | ||
| France | ||
| Spain | ||
| Italy | ||
| BENELUX (Belgium, Netherlands, and Luxembourg) | ||
| NORDICS (Denmark, Finland, Iceland, Norway, and Sweden) | ||
| Rest of Europe | ||
| Asia-Pacific | India | |
| China | ||
| Japan | ||
| Australia | ||
| South Korea | ||
| South East Asia (Singapore, Malaysia, Thailand, Indonesia, Vietnam, and the Philippines) | ||
| Rest of Asia-Pacific | ||
| Middle East and Africa | United Arab Emirates | |
| Saudi Arabia | ||
| South Africa | ||
| Nigeria | ||
| Rest of the Middle East and Africa | ||
Key Questions Answered in the Report
What is the current outlook for recycled furniture demand through 2031?
The recycled furniture market is projected to grow from USD 12.28 billion in 2026 to USD 17.40 billion by 2031 at a 7.21% CAGR, supported by procurement rules, reuse systems, and stronger traceability expectations.
Which product category leads sales, and which one is growing the fastest?
Home Furniture led with 55.25% share in 2025, while Office Furniture is projected to grow the fastest at 7.95% CAGR through 2031.
Why is reclaimed wood so important in this space?
Reclaimed and recycled wood held a 46.52% share in 2025 and is also the fastest-growing material segment, with an 8.11% CAGR, helped by design appeal, commercial feasibility, and stronger circular positioning.
Which sales channel is changing the fastest?
Online Marketplaces led in 2025 with a 39.81% share, but Brand-Owned Buyback and Refurbishment Channels are growing faster at a 7.80% CAGR, as manufacturers seek to retain more value after the first sale.
Which region leads the global landscape?
Europe held the largest regional share at 33.54% in 2025 because regulation, procurement structures, and refurbishment ecosystems are more established there.
What is the main operational challenge for suppliers?
The biggest issues are inconsistent feedstock quality, weak provenance records, and high refurbishment and logistics costs, which make scaling harder for smaller operators.