
Market Overview
| Study Period | 2020 - 2031 |
|---|---|
| Forecast Data Period | 2026 - 2031 |
| Base Year Market Size (2025) | USD 12.72 Billion |
| Market Size (2026) | USD 13.39 Billion |
| Market Size (2031) | USD 17.31 Billion |
| Growth Rate (2026 - 2031) | 5.27 % |
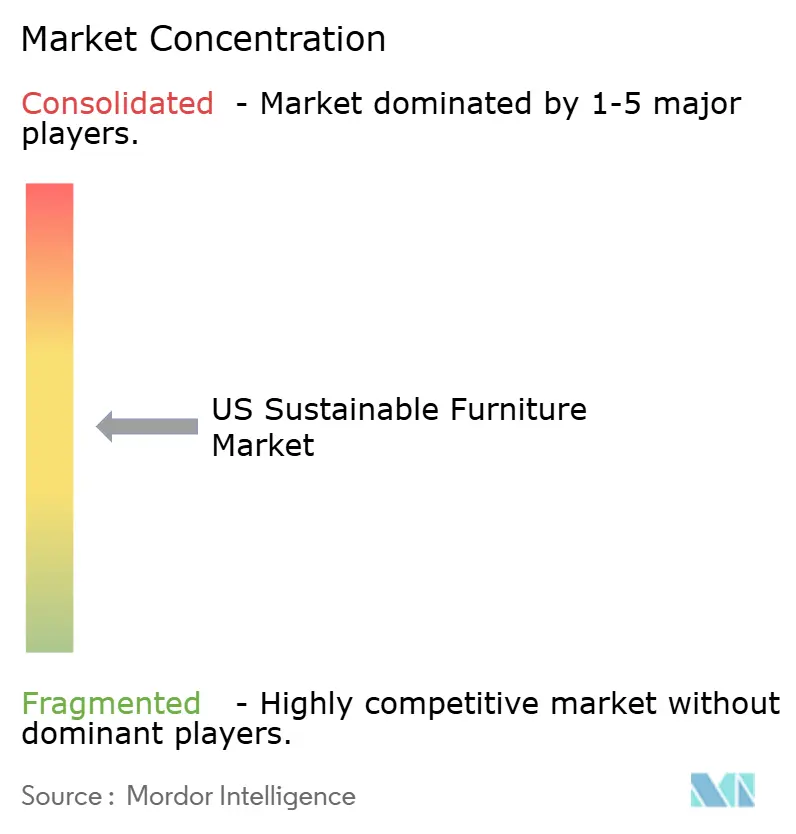
| Market Concentration | Medium |
Major Players
*Disclaimer: Major Players sorted in no particular order Image © Mordor Intelligence. Reuse requires attribution under CC BY 4.0. |
|
US Sustainable Furniture Market Analysis by Mordor Intelligence
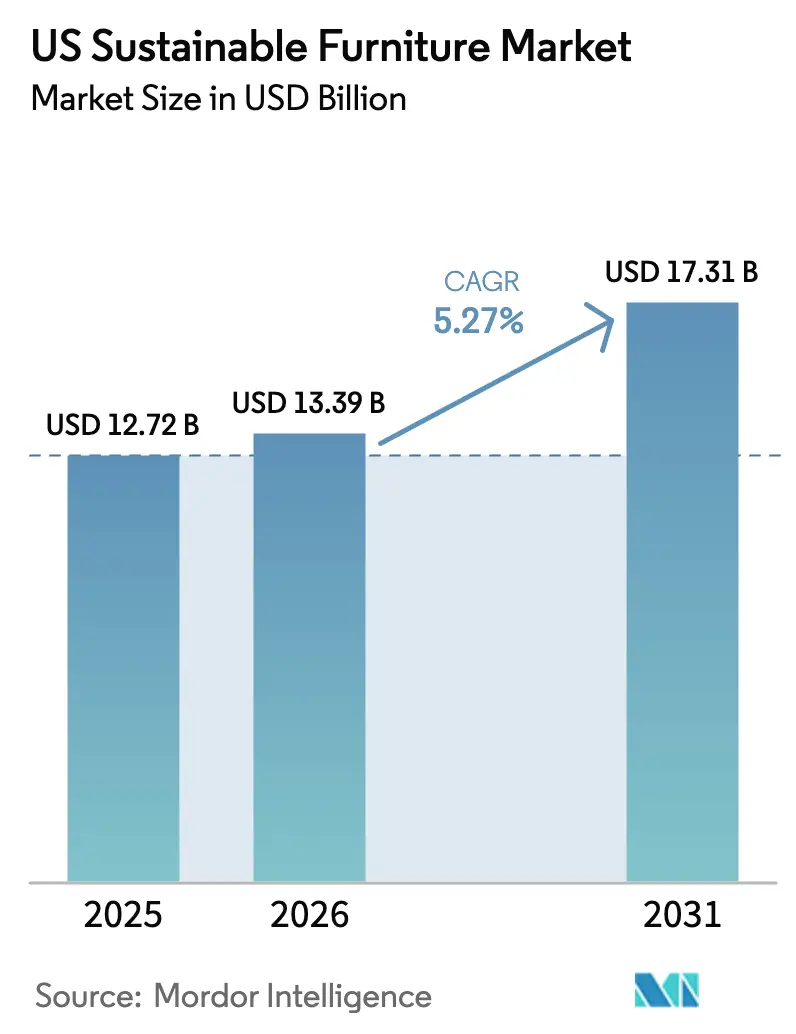
The US sustainable furniture market size is expected to grow from USD 12.72 billion in 2025 to USD 13.39 billion in 2026 and is forecast to reach USD 17.31 billion by 2031 at 5.27% CAGR over 2026-2031. Strong consumer demand for certified low-impact products, new federal procurement rules, and the popularity of digital sales platforms are pushing the segment ahead of the broader furniture sector. Chairs remain the largest revenue generator, but tables, bamboo-based designs, and multi-functional products account for most incremental growth. Supply chain control and credible third-party labels such as FSC and Greenguard are shaping competitive advantage, while material innovation is bringing renewable grasses, recycled metals, and bio-based plastics into mainstream furniture lines. Manufacturers procuring raw materials with verifiable sourcing are capitalising on a willingness among US consumers, especially millennials and Gen Z, to pay a premium for sustainable pieces.
Key Report Takeaways
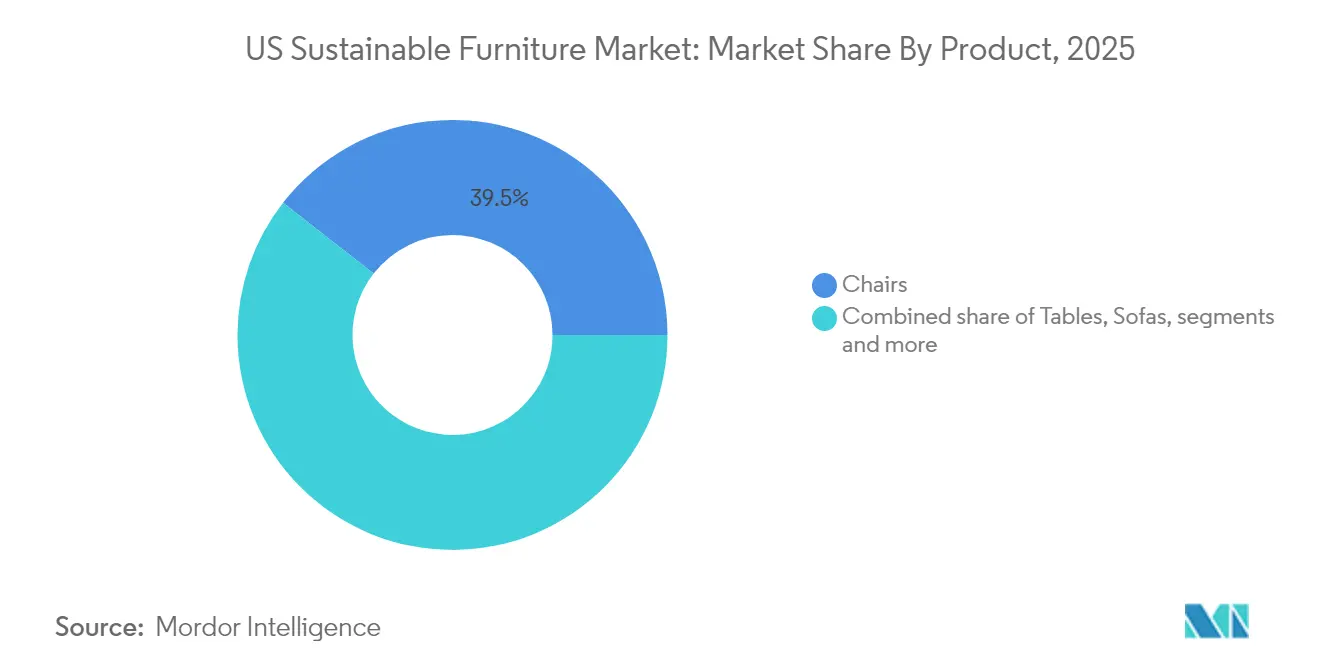
- By product category, chairs led with 39.45% market share in 2025, while tables are projected to expand at a 6.42% CAGR to 2031.
- By material, reclaimed wood commanded 34.60% of the US sustainable furniture market share in 2025; bamboo and rapidly renewable grasses are forecast to grow at 6.66% CAGR through 2031.
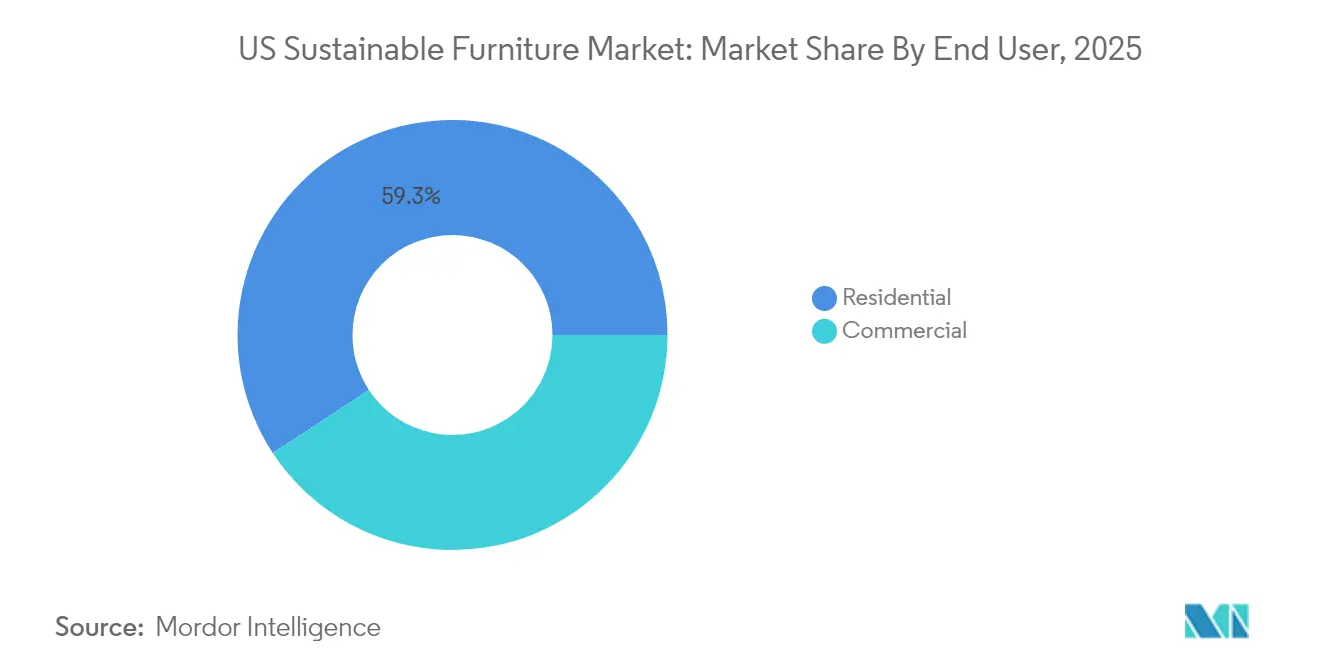
- By end user, the residential segment accounted for 59.25% share of the US sustainable furniture market size in 2025, whereas commercial offices are advancing at a 5.98% CAGR through 2031.
- By distribution channel, B2C/Retail held 67.20% of the US sustainable furniture market in 2025, and the B2B/Project segment is set to rise at 5.58% CAGR from 2026 to 2031.
- By geography, the South region accounted for 37.60% share of the US sustainable furniture market size in 2025; the West region is forecast to grow at 6.63% CAGR through 2031.
Note: Market size and forecast figures in this report are generated using Mordor Intelligence’s proprietary estimation framework, updated with the latest available data and insights as of 2026.
US Sustainable Furniture Market Trends and Insights
Drivers Impact Analysis*
| Driver | (~) % Impact on CAGR Forecast | Geographic Relevance | Impact Timeline |
|---|---|---|---|
| Growing consumer awareness of sustainability | +1.3% | National, higher in urban coastal areas | Medium term (2–4 years) |
| Federal “Buy Clean” requirements accelerating recycled-content sourcing | +1.1% | National, emphasis in government-dense regions | Medium term (2–4 years) |
| Surge in millennial/Gen Z homeowners seeking FSC & Greenguard-labeled products | +1.0% | Urban centres and college towns | Long term (≥ 4 years) |
| Expansion of municipal furniture take-back/recycling programs | +0.8% | California, New York, Massachusetts, Washington | Medium term (2–4 years) |
| Growth of e-commerce and online transparency | +0.6% | National | Short term (≤ 2 years) |
| Source: Mordor Intelligence | |||
Growing Consumer Awareness of Sustainability
A majority of US shoppers actively research a product’s environmental footprint before purchase. Capgemini’s January 2024 consumer-behavior tracker, which surveyed 11,300 shoppers in 11 countries (including 1,000 respondents in the United States), found that 60 % of US consumers had bought from companies they regarded as sustainable, a figure that rose to 71 % among Gen Z buyers. This interest is now influencing real purchase decisions: 80 % of environmentally motivated shoppers review a product’s verifiable sustainability data before choosing furniture [1] Capgemini, "What matters to today’s consumer," prod.ucwe.capgemini.com/ . A March 2025 Britopian study of 2,500 US consumers aged 18–26 reported that 64 % would pay a premium for eco-friendly goods, while 77 % deliberately avoid brands seen as environmentally irresponsible. In response, manufacturers are replacing basic green marketing with supply-chain transparency, deploying blockchain-based tracing systems that allow buyers to confirm the origin of wood, upholstery, and finishes in near real time. These measures help firms defend brand trust and position certified products more competitively as sustainable furniture moves from niche to mainstream demand.
Federal “Buy Clean” Requirements Accelerating Recycled-Content Sourcing
The US General Services Administration began applying “Buy Clean” rules to federal furniture purchases in 2024, requiring public bids to include Environmental Product Declarations for low-carbon materials [2]U.S. General Services Administration." GSA pilots Buy Clean Inflation Reduction Act Requirements". By mid-2024, suppliers had filed more than 17,000 extra EPDs, enabling recycled metal frames, reclaimed wood substrates, and certified bio-based foams to scale across the US sustainable furniture market. Commercial suppliers are now standardising these materials across whole catalogues to meet both public and private demand.
Surge in Millennial/Gen Z Homeowners Seeking FSC & Greenguard-Labeled Products
Younger homeowners continue to favour independent verification. The Sustainable Furnishings Council reports that 97% of buyers show interest in certified products, and 64% of Gen Z will pay more for eco-friendly goods. Retailers, therefore, highlight certification logos prominently, boosting sales of low-volatile organic compounds (VOCs) finishes and responsibly sourced hardwoods in the US sustainable furniture market.
Expansion of Municipal Furniture Take-Back/Recycling Programs in Coastal States
California’s SB 707 and Boston’s city-wide disposal rules mandate the recovery of furniture's textiles and components before landfill [3] The City of Boston, "Clothing and Textile Recovery. "www.boston.gov. These circular initiatives supply reclaimed inputs back to manufacturers and reinforce regional demand for repairable, modular products. The US sustainable furniture market benefits from lower raw-material costs and new brand narratives focused on extended product life.
Restraints Impact Analysis*
| Restraint | (~) % Impact on CAGR Forecast | Geographic Relevance | Impact Timeline |
|---|---|---|---|
| Higher up-front pricing vs. conventional imports | −1.0% | National, stronger in price-sensitive regions | Medium term (2–4 years) |
| Limited domestic supply of sustainable hardwood | −0.6% | National, acute in manufacturing hubs | Medium term (2–4 years) |
| Fire-safety regulatory variability | −0.5% | State-specific, notably California | Long term (≥ 4 years) |
| Source: Mordor Intelligence | |||
Limited Domestic Supply of Sustainable Hardwood Increasing Lead Times
FSC-certified oak and maple stocks remain tight, extending delivery cycles for customised projects and favouring suppliers with secure forestry partnerships. Manufacturers in North Carolina and Michigan are diversifying into bamboo, recycled metals, and engineered grass composites to relieve pressure on scarce hardwood reserves within the US sustainable furniture market.
Fire-Safety Regulatory Variability Hindering Bio-Based Material Adoption
California’s flammability codes still differ from those of many states, compelling producers to meet multiple test regimes. Some bio-based foams and fabrics, therefore, need additional flame-retardant treatments, dampening adoption in the US sustainable furniture market until harmonised standards emerge.
*Our forecasts treat driver/restraint impacts as directional, not additive. The impact forecasts reflect baseline growth, mix effects, and variable interactions.
Segment Analysis
By Product: Chairs Lead While Tables Gain Momentum
In 2025, chairs held 39.45% of revenue in the US sustainable furniture market. Frequent replacement cycles at offices and restaurants sustain this dominance. Tables follow as the fastest-growing item at a 6.42% CAGR to 2031, driven by modular tops and tool-free repair features. Sofas remain a staple of residential demand, particularly those upholstered with plant-based leather substitutes. Beds featuring organic latex mattresses and solid wood frames free from formaldehyde are gaining share among health-focused households.
Circular design principles are spreading across categories. Flat-pack connectors allow components to separate easily for refurbishment, while QR-coded parts guide customers to replacement kits. The biophilic style-natural textures, curved lines, and visible grain-aligns aesthetic trends with sustainability goals. Vegan cactus leather and recycled cotton bouclé fabrics are appearing on lounge chairs and headboards, broadening material diversity in the US sustainable furniture market.



By Material: Reclaimed Wood Dominates as Bamboo Surges
Reclaimed and FSC-certified wood accounted for 34.60% of 2025 sales, reflecting mature supply chains. The US sustainable furniture market share for bamboo and rapidly renewable grasses is increasing fastest, at a 6.66% CAGR to 2031, supported by the raw material’s five-year maturity cycle and compressive strength comparable to steel. Recycled aluminum frames and low-carbon steel bases are gaining popularity in contract seating. Research on cotton-alginate composites signals a future where fire safety and biodegradability converge. Natural fibers such as hemp and jute expand upholstery choices, appealing to buyers looking to avoid polyurethane foam.
Innovation within the “other materials” group includes rubberwood derived from spent latex plantations and parawood treated with water-based stains. These inputs help manufacturers secure cradle-to-cradle certification, heightening differentiation in the US sustainable furniture market.
By End User: Residential Dominates While Commercial Accelerates
Residential buyers generated 59.25% of revenue in 2025, propelled by consumer preferences, lifestyle trends, and market dynamics that favor eco-friendly choices in home settings. Commercial applications, especially corporate offices, advance at a 5.98% CAGR as employers target WELL (The WELL Building Standard) and LEED (Leadership in Energy and Environmental Design) points. Carbon-neutral workplace fit-outs favor modular desks with recycled aluminum legs, height-adjustable systems, and non-toxic surface coatings. Hospitality venues upgrade guest rooms with reclaimed barn-wood headboards, while healthcare facilities specify cleanable fabrics free from halogenated flame retardants.
Education campuses embed sustainability into procurement charters, driving volume orders for stackable chairs made of post-consumer recycled polypropylene. These commercial commitments reinforce structural demand in the US sustainable furniture market.
By Distribution Channel: Retail Leads as B2B Projects Expand
Retail outlets collected 67.20% of the 2025 revenue for the US sustainable furniture market. Specialist stores educate buyers on labels and care tips, whereas big-box home centers broaden reach through in-aisle scanners that reveal material origins. Enhanced AR visualisation and sample-swatch mailing boost online conversion, supporting direct-to-consumer brands. Subscription furniture services allow users to rotate products and return items for refurbishment, cutting lifetime ownership costs.
The B2B/Project channel grows at 5.58% CAGR through 2031 as architects and interior designers specify certified products during bid phases. Shared digital libraries of 3D models with embedded EPDs simplify compliance reporting. Corporate purchasers employ total cost of ownership analyses that include energy savings from lighter shipping weights and tax incentives on certified items, strengthening momentum in the US sustainable furniture market.
Geography Analysis
The South led regional sales with 37.60% of the US sustainable furniture market share in 2025, reflecting the region’s large population base and the rapid expansion of urban hubs such as Houston, Austin, Miami, and Orlando. These metropolitan areas are attracting younger homebuyers who prioritize certified low-VOC products, lifting household spending on eco-friendly décor. Tier-one manufacturers have also scaled new plants in Tennessee, Georgia, and Texas, shortening lead times and anchoring supply chains closer to end users. This clustering is expected to keep the region’s contribution to the US sustainable furniture market size through 2031, even as other regions narrow the gap.
The West is posting the fastest growth due to progressive environmental policies in California, Oregon, and Washington that ban certain flame retardants and incentivize recycled-content procurement. State and municipal take-back programs feed reclaimed wood and metal back to local makers, reinforcing circular-economy narratives that resonate with environmentally conscious consumers. High technology adoption in the Bay Area and Seattle allows brands to showcase blockchain-verified sourcing data at the point of sale, further accelerating uptake. Retailers in Los Angeles and Portland now dedicate entire showroom floors to FSC- and Greenguard-certified lines, making sustainable options the default choice for many shoppers.
Regulatory Landscape
US sustainable furniture compliance is shaped by federal chemical-emissions limits for wood composites and air-emissions controls at manufacturing facilities. Under TSCA Title VI, composite wood products used in furniture (hardwood plywood, MDF, and particleboard) must meet formaldehyde emission limits and third-party certification requirements, and laminated products not exempted from the hardwood plywood definition have been subject to mandatory testing and certification since March 22, 2024. In February 2026, the US EPA proposed updates to the Formaldehyde Emission Standards for Composite Wood Products to incorporate updated voluntary consensus test methods (including ISO 12460-2:2024), which changes the test and documentation expectations that manufacturers and suppliers must plan around.
On the production side, the National Emission Standards for Hazardous Air Pollutants for Wood Furniture Manufacturing Operations (40 CFR Part 63 Subpart JJ) applies to major source facilities, and state VOC rules continue to overlay federal requirements in certain jurisdictions (for example, Ohio Administrative Code Rule 3745-21-15 and Vermont ANR requirements such as Section 5-253-16). Federal purchasing also brings sustainability requirements into bid processes: EPA federal procurement guidance and model contract language for office furniture reference recognized standards and ecolabels such as BIFMA e3 (LEVEL) and Cradle to Cradle, reinforcing third-party verification for manufacturers selling into government and other specification-driven channels.
Value Chain Analysis
The value chain starts with feedstock sourcing and verification, including reclaimed and FSC-certified wood, rapidly renewable bamboo and grasses, recycled metals, and lower-VOC adhesives, coatings, and foams. Material qualification and chain-of-custody documentation are central to sustainable claims, with industry bodies setting shared language for performance reporting. BIFMA administers the LEVEL sustainability standard and the BIFMA Compliant program to verify product and sustainability attributes, while the Sustainable Furnishings Council (SFC) provides assessment tooling such as its Eco-Insight framework; in September 2025, Cascale announced the acquisition of key SFC assets to scale sustainability tools and data practices across the furnishings ecosystem.
Midstream, manufacturers convert panels, frames, and upholstery into finished goods, increasingly combining domestic production with automation to improve traceability, responsiveness, and waste control. Downstream, distribution splits between B2C retail (including online) and B2B/project specification, where documentation such as EPDs and certification logos influences selection. Circularity remains a bottleneck at end-of-life: municipal take-back and textile recovery initiatives in coastal states help redirect materials, but national-scale infrastructure for refurbishing and recycling case goods and upholstery is still uneven. As a result, partnerships with reclaimers and specialty processors are a differentiator for brands building closed-loop programs.
Competitive Landscape
The competitive field comprises large multi-line manufacturers, mid-sized specialist brands, and digitally native entrants. Ashley Furniture, MillerKnoll, and Steelcase integrate recycled plastics, closed-loop metals, and responsibly sourced wood into expanding green lines. Their scale ensures consistent inventory for nationwide rollouts.
Direct-to-consumer newcomers, including Sabai Design and Floyd LLC, grow quickly by offering repair parts, buy-back guarantees, and flat-packed reclaimed-wood frames that ship efficiently. Technology partnerships enhance competitiveness: Leggett & Platt consolidated US upholstery plants in 2024, aligning capacity with regional demand while lowering Scope 1 emissions. Breton collaborated with Mixcycling to 3D-print seating shells from recycled cork plus bio-resins, creating custom geometries with minimal waste.
Mergers and licensing deals centre on sustainable IP, such as low-VOC adhesives and rapid-assembly connectors. Marketing narratives highlight quantified carbon savings and end-of-life recovery plans, establishing trust across diverse buyer groups in the US sustainable furniture market.
US Sustainable Furniture Industry Leaders
-
Williams Sonoma Inc.
-
MillerKnoll Inc.
-
Steelcase Inc.
-
Haworth Inc.
-
IKEA
- *Disclaimer: Major Players sorted in no particular order

Market Opportunities and Future Outlook
Procurement-led compliance is creating room for suppliers to bundle verifiable sustainability documentation with safety and chemical requirements. The GSA Buy Clean initiative has already pushed EPD usage into federal furniture bids (with more than 17,000 additional EPDs filed by mid-2024), and in February 2026 the US Green Building Council published LEED v5 Building Product Selection and Procurement criteria that elevate multi-attribute screening, including circular economy and climate and health considerations, for building projects. Separately, March 2026 is the mandatory enforcement date for the STURDY Act requirements (ASTM F2057-23) for clothing storage units entering the US market, which increases the need for product engineering discipline and third-party testing, and favors manufacturers that can meet both sustainability credentials and compliance-ready design specifications.
Materials innovation and circular feedstock programs also present opportunity areas, particularly where domestic supply constraints exist for certified hardwood. Federal support is moving forest-derived bioproducts from lab validation toward commercial readiness, illustrated by the Maine Forest Bioproducts Tech Hub receiving USD 22 million in federal funding in January 2025 (including USD 10.5 million for the University of Maine) to advance forest-product processes toward commercialization. Retailer and association scorecards are tightening expectations on responsible sourcing: the Sustainable Furnishings Council released its 2026 Wood Furniture Scorecard (June 2026), and retailer requirements such as Room & Board's Sustainable Materials Guidelines (Version 4.0, effective January 2026) set minimum preferred-material thresholds for vendor textiles. Together, these updates support near-term demand for recycled, upcycled, and renewable fiber supply and increase pressure for stronger supplier disclosure.
Recent Industry Developments
- May 2026: Plantd commenced supplying grass-based structural panels for the Studio TK Clique Luxe bench collection, marking its move into the commercial furniture supply chain. The partnership commercializes alternative panels as a substitute for traditional engineered wood inputs and widens the addressable material set for sustainability-focused specifiers.
- February 2025: MillerKnoll unveiled a new sustainability strategy with near-term goals that include eliminating added PFAS in North America by FY2025 and moving to 100% renewable electricity by FY2026. The roadmap sets clearer requirements for materials, supplier disclosure, and manufacturing energy inputs across its product portfolio, influencing competitive baselines for large contract-furniture programs.
- July 2024: Williams-Sonoma released its 2023 Impact Report, updating disclosure on its sustainability programs and sourcing approach for home categories that include furniture. Expanded reporting supports retailer-led demand for traceable materials and third-party validation, reinforcing how documented sourcing policies shape customer and procurement decisions.


Research Methodology Framework and Report Scope
Market Definition and Coverage
For this study, the market covers the value of brand-new sustainable furniture sold in the United States, across indoor and outdoor use, where the main materials and finishes are positioned as lower impact and are verified through recognized sustainability checks.
Scope exclusions: Antique furniture, rental fleets, and peer-to-peer resale are excluded from the market value.
Segmentation Overview
-
By Product
- Chairs
- Tables
- Sofas
- Beds
- Storage Cabinets
- Other Products
-
By Material
- Reclaimed / FSC-Certified Wood
- Bamboo & Rapidly Renewable Grass
- Recycled Metals (Steel & Aluminum)
- Recycled & Bio-Based Plastics
- Organic / Natural Fibers (Rattan, Jute, Hemp)
- Other Materials (parawood, rubberwood, natural fabrics, etc.)
-
By End User
- Residential
-
Commercial
- Offices
- Hospitality
- Healthcare Facilities
- Educational Institutes
- Other Commercial Users (public places, retail malls, government offices, etc.)
-
By Distribution Channel
-
B2C/Retail
- Home Centers
- Specialty Furniture Stores
- Online
- B2B /Project
-
B2C/Retail
-
By Geography
- Northeast
- Midwest
- South
- West
Data Sources, Market Sizing, and Validation
Desk Research
Desk work started with defining what qualifies as sustainable furniture in the US context, and then building the data backbone that explains demand and pricing. We referenced public sources such as US EPA guidance on chemicals and emissions, USDA and US Forest Service materials context, and USTR and USITC trade releases that help explain furniture and material inflows. Broader spending and housing signals were also checked using sources such as the US Census Bureau (housing starts and construction releases) and BEA personal consumption tables to keep the demand story grounded.
On the supply and pricing side, we reviewed company annual reports, investor presentations, sustainability reports, and product documentation that discusses certifications and material claims. We also used paid subscriptions for company financials and intelligence, news and financials, and patent databases to cross-check product direction and to spot changes that could shift adoption (for example, recycled content targets and low-VOC finishing trends). These desk sources are not exhaustive, and many other public documents and datasets were also used for data collection, validation, and clarification.
Primary Interviews and Surveys
Primary work focused on validating what sellers and buyers treat as sustainable in practice, and how that affects price premiums and volumes across channels. We spoke with manufacturers, retailers, material and component suppliers, and commercial buyers (such as workplace and hospitality procurement teams) to test assumptions and fill gaps left by public data. Since the scope is US-only, interviews were balanced across major furniture-consuming regions and across online and offline routes to market so we could pressure-test the final totals.
Distribution of primary research fieldwork respondents
| Company type | Respondent position |
|---|---|
| Top tier: 37% | CXOs: 15% |
| Mid tier: 47% | Functional/Unit leaders: 26% |
| Smaller Players: 16% | Managers: 59% |
Market-Sizing & Forecasting
Sizing starts with a top-down build where US furniture demand is reconstructed from consumer spending and housing activity, and then filtered by the portion that meets sustainable material and verification requirements. To keep the result realistic, the totals are corroborated with selective bottom-up checks, such as sampled average selling prices by product group multiplied by channel volumes, and supplier and retailer channel checks on sustainable share.
A few inputs that mattered in this market included: US housing starts and remodeling momentum (which influence replacement cycles), the share of furniture buyers willing to pay for certified or low-VOC products, online versus offline mix (since assortment and labeling differ), the spread of third-party eco labels and corporate due-diligence programs, and observed price premiums for reclaimed, bamboo, and recycled-content items. Forecasting was done using scenario analysis supported by expert views on how these drivers move together, followed by smoothing to avoid unrealistic year-to-year jumps when housing or discretionary spending swings. Where bottom-up points were missing (for example, small brand volumes that are not disclosed), gaps were handled through proxy shares anchored to channel assortment and then validated through interviews.
Data Validation & Update Cycle
Outputs were checked against independent signals, including broader US furniture consumption direction, housing-linked demand indicators, and observed pricing behavior for sustainable materials and finishes. When variances looked high, assumptions were revisited and experts were re-contacted to confirm whether the shift was real or caused by definition drift or timing differences. Before sign-off, the model goes through multi-step analyst review where outliers are traced back to the driver that created them, and corrections are documented.
Reports are refreshed annually, and interim updates are made when material events occur (such as major certification rule changes, sharp input cost swings, or clear demand shocks). Before delivery, an analyst performs a fresh pass on key inputs so clients receive the latest updated view.
Mordor Intelligence's US Sustainable Furniture Market Size Compared With Other Published Estimates
Published market sizes for sustainable furniture in the US can differ because the term sustainability is applied differently, and because some sources blend adjacent furniture spending pools into the same number. Timing also matters since base years, inflation treatment, and how price premiums are carried forward can shift the value even when unit demand is similar.
By tracking certification and material verification rules and refreshing them in the market model, the Mordor Intelligence approach keeps the US sustainable furniture total focused on brand-new products that meet defined sustainability checks, instead of mixing in general furniture consumption or resale-driven activity.
Benchmark comparison
| Source | Market Size | Gaps in Research Methodology |
|---|---|---|
| Mordor Intelligence | USD 12.72 B (2025) | |
| Industry Research Publisher A | USD 14.06 B (2026) | Uses a later starting year and a broader interpretation of sustainable coverage, with less explicit separation between verified sustainability criteria and general eco-claims, which can lift the total value. |
| Data Platform B | USD 257.20 B (2025) | Represents buyer-side US furniture consumption (including furnishings and floor coverings) across channels, which is a much wider scope than only sustainable furniture that meets defined verification requirements. |
The spread is mainly explained by what gets counted and the year being referenced, not by a disagreement that furniture demand exists. When the scope is narrowed to verified sustainable materials and labeled products, the market value sits far below total furniture consumption, and it also tracks a different price-premium curve over time.


Key Questions Answered in the Report
What is the current value of the US sustainable furniture market?
The market is worth USD 13.39 billion in 2026 and is projected to reach USD 17.31 billion by 2031.
Which product category dominates US sustainable furniture sales?
Chairs lead with a 39.45% revenue share, supported by high replacement cycles in both residential and commercial spaces.
How fast is bamboo furniture growing in the United States?
Bamboo and other rapidly renewable grasses are forecast to grow at a 6.66% CAGR between 2026 and 2031 due to their strong sustainability profile.
What is driving commercial demand for sustainable furniture?
Corporate sustainability goals, LEED and WELL certification targets, and employee wellness initiatives are accelerating commercial office adoption at a 5.98% CAGR.
How are federal policies affecting the US sustainable furniture market?
“Buy Clean” rules mandate low-carbon materials in government purchases, driving wider industry adoption of recycled and responsibly sourced inputs.
Are consumers willing to pay more for sustainable furniture?
Surveys show an average willingness to pay a 9.7% premium, especially among millennial and Gen Z buyers who prioritize certified products.
Page last updated on:





