
Ready-to-Eat Food Market Analysis by Mordor Intelligence
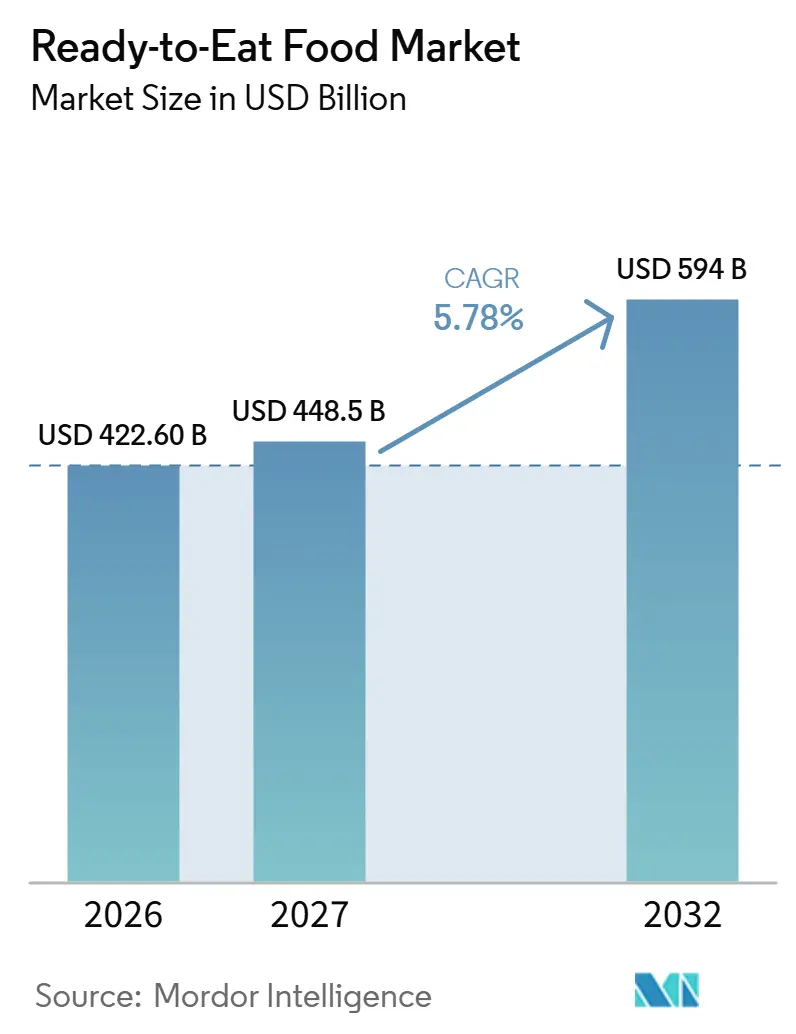
The ready-to-eat food market size is projected to expand from USD 422.6 billion in 2026 and USD 448.5 billion in 2027 to USD 594 billion by 2032, registering a CAGR of 5.78% between 2027 and 2032.
A large base of individual households and wider grocery delivery reach support demand for meals that fit independent eating schedules. In India, quick-commerce fulfillment makes packaged ready meals useful within a broader grocery order, linking food-preparation convenience with easier access. Suppliers can build on that opportunity through suitable portions, regionally relevant recipes, and production tied to a defined delivery area. For packaged-snack suppliers, ingredient restrictions can also determine access to school sales, making channel eligibility a separate constraint on convenience-led expansion.
Key Report Takeaways
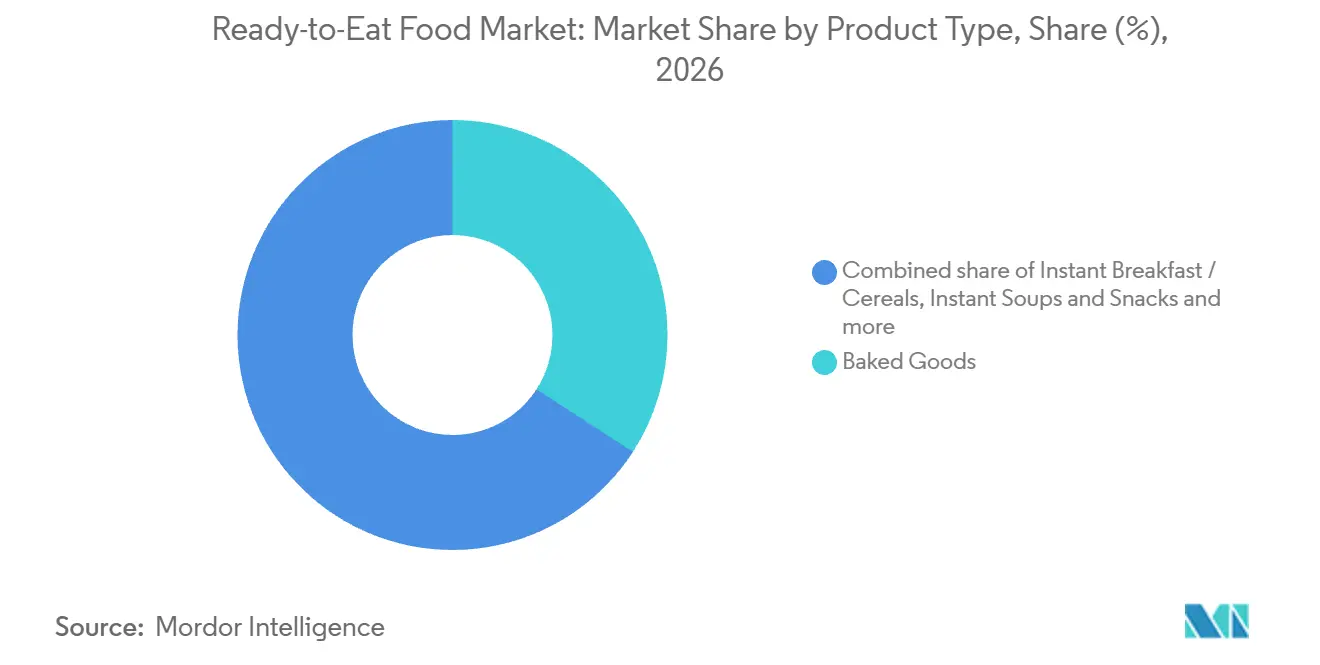
- By product type, baked goods held a 34.14% ready-to-eat food market share in 2026, while the instant soups and snacks segment is forecast to grow fastest at a CAGR of 6.4% between 2027 and 2032.
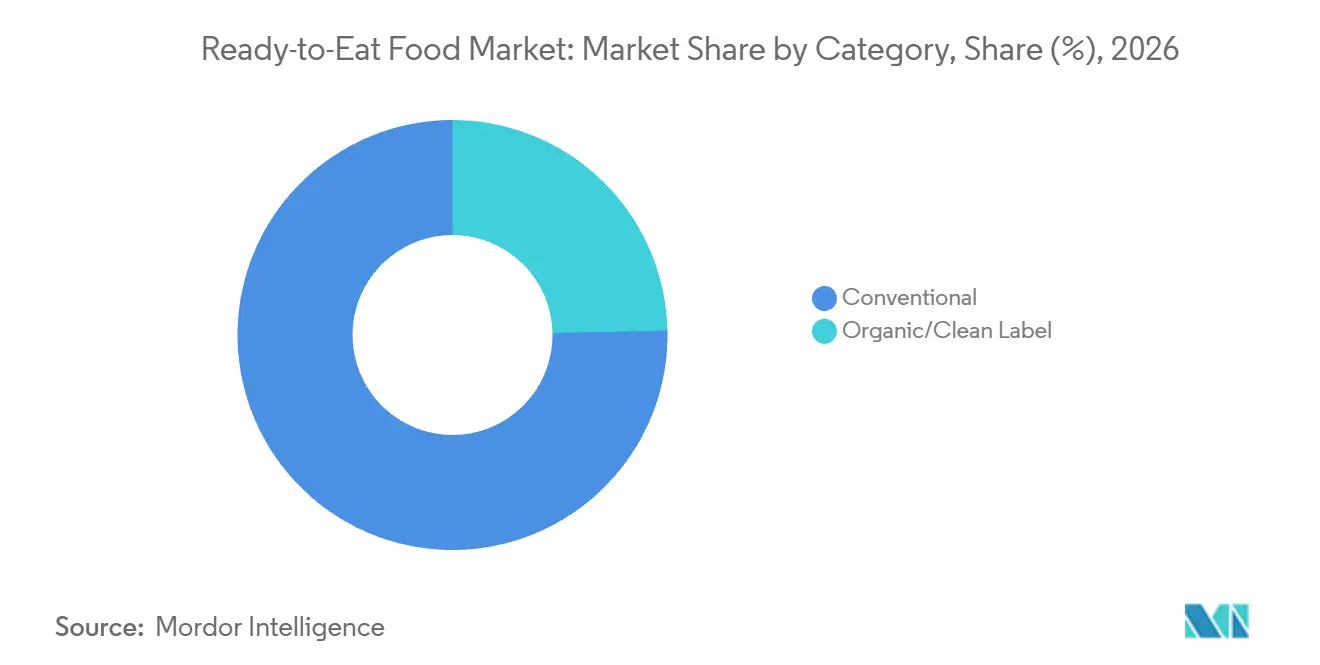
- Conventional foods led the category with a 75.33% share of the ready-to-eat food market size in 2026, and the segment is forecast to grow fastest at a CAGR of 5.8% between 2027 and 2032.
- Distribution channels were led by supermarkets and hypermarkets with 45.44% of market sales in 2026, while online retail stores are forecast to grow fastest at a CAGR of 7.4% between 2027 and 2032.
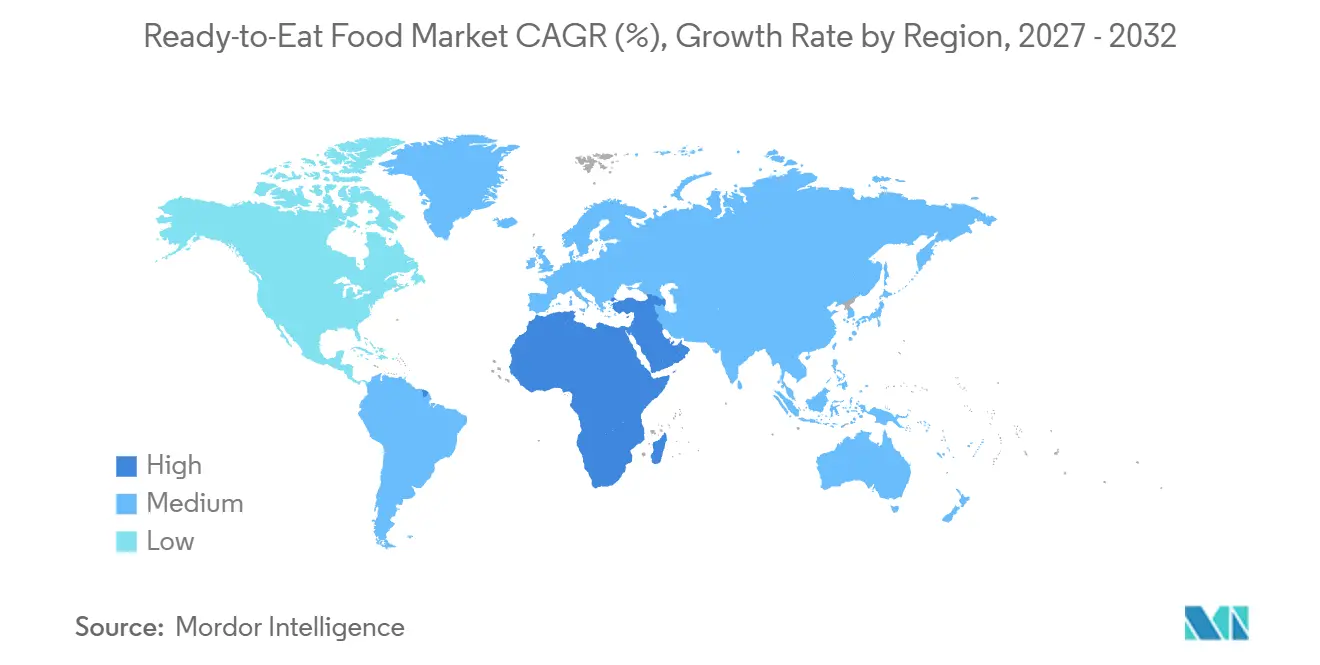
- Across geographies, Asia-Pacific held 41.4% of market sales in 2026, and the Middle East and Africa region is forecast to grow fastest at a CAGR of 6.65% between 2027 and 2032.
Note: Market numbers in this report are based on Mordor Intelligence's proprietary estimation framework, which combines nine months of actuals with Q4 projections for base year 2026.
Market Trends and Insights
Drivers Impact Analysis of Ready-to-Eat Food Market*
| Driver | (~) % Impact on CAGR Forecast | Geographic Relevance | Impact Timeline |
|---|---|---|---|
| Rising number of single-person households and dual-income families | +2% | Across the United States | Long term (≥ 4 years) |
| Rising penetration of e-grocery and q-commerce fulfillment | +1.9% | United States and India | Medium term (2-4 years) |
| Changing consumer lifestyles | +1.7% | Across the United Kingdom | Long term (≥ 4 years) |
| Growth in food processing industry | +1.4% | Canada and the European Union | Medium term (2-4 years) |
| Advancements in packaging technology | +0.8% | France and the United Kingdom | Medium term (2-4 years) |
| Product innovation and flavor diversification | +0.7% | United States and Spain | Short term (≤ 2 years) |
| Source: Mordor Intelligence | |||
Rising number of single-person households and dual-income families
Cooking for one makes portion suitability a different problem from preparing food for a shared household. The United States had 39.7 million one-person households in 2025, representing 29% of all households.[1] A prepared individual meal can serve that buyer without requiring the preparation of a larger dish. For dual-income households, the same format can also let household members choose a meal independently when their eating schedules differ. The scale of the US one-person household base gives suppliers a commercial reason to develop dedicated single-serve pack sizes.
Rising penetration of e-grocery and q-commerce fulfillment
Digital grocery fulfillment makes packaged meals accessible without a separate shopping trip, extending their usefulness for short-notice eating occasions. US online food sales rose nearly 19% in 2025. Swiggy expanded Instamart from 27 to 124 Indian cities in FY 2024-25, offering 10-minute delivery of groceries alongside other categories. That wider service footprint creates additional routes through which packaged ready meals and snacks can reach consumers. For suppliers, the demand opportunity lies in making an immediately usable food purchase part of an existing digital grocery order. Converting geographic reach into meal purchases therefore depends on an assortment suited to rapid fulfillment.
Changing consumer lifestyles
Meals requiring only reheating let households separate the eating occasion from the work of cooking a dish. UK household purchases of meat ready meals rose from around 27 grams per person per week in 1974 to 182 grams in the financial year ending 2025. For producers, the opportunity extends to a complete meat-based main meal, making the whole eating occasion the focus of product development.
Growth in food processing industry
Food-processing expansion supports prepared-food demand most directly when new production is connected to a defined delivery region. EU sold-production value for food products increased 3.8% at constant prices in 2025 compared with 2024. A more specialized expansion came on June 18, 2026, when Factor Meals, a HelloFresh Canada subsidiary, opened a 50,000-square-foot kitchen and distribution center in Calgary. The facility established localized production and supported delivery of ready-to-heat meals across Western Canada. Combining these functions can help meal producers build a regional offer around an operational production and distribution base. Regional delivery capability consequently becomes part of the manufacturing investment proposition for a ready-to-heat meal operator.
Restraints Impact Analysis of Ready-to-Eat Food Market*
| Restraint | (~) % Impact on CAGR Forecast | Geographic Relevance | Impact Timeline |
|---|---|---|---|
| Growing ultra-processed-food regulation momentum | -1% | Participating school campuses in Arizona | Short term (≤ 2 years) |
| Health and nutritional transparency issues | -0.8% | Across the United States | Medium term (2-4 years) |
| Consumer skepticism about additives and preservatives | -0.5% | Across the United States | Short term (≤ 2 years) |
| Stringent food safety and regulatory compliance | -0.4% | Across the United States | Long term (≥ 4 years) |
| Source: Mordor Intelligence | |||
Growing ultra-processed-food regulation momentum
Ingredient-based restrictions can make a convenient packaged product ineligible for a particular sales channel. From the 2026-27 school year, Arizona law prohibits schools participating in federally funded or assisted meal programs from serving, selling, or allowing third-party sales of covered foods on campus during the normal school day. The definition covers foods or beverages containing any of 11 listed additives. Parents and guardians may provide these foods to their own students. For suppliers of packaged snacks sold through affected campus channels, that distinction makes ingredient composition a condition of access. Reformulating an affected product or forgoing that channel adds a commercial burden that convenience alone cannot overcome.
Health and nutritional transparency issues
Nutrition transparency can constrain packaged-food suppliers through the cost of changing how products are presented. The FDA estimated annualized US packaged-food industry costs of USD 191 million to USD 530 million over 2025-2034, in 2023 dollars at a 2% discount rate, if its proposed front-of-package nutrition rule is finalized. Reformulation is not a requirement or goal of the proposal. Nevertheless, the cost model included reformulation, linking the labeling decision with possible changes to the food itself. The FDA said some costs could be passed through to consumers in higher prices. A nutrition-label redesign can therefore become a product-economics decision even when recipe changes remain optional.
*Our forecasts treat driver/restraint impacts as directional, not additive. The impact forecasts reflect baseline growth, mix effects, and variable interactions.
Ready-to-Eat Food Market Segment Analysis
By Product Type:
Baked Goods Lead and Instant Formats Add CapacityBaked goods accounted for a 34.14% share of the ready-to-eat food market size in 2026. The largest segment includes substantial branded businesses, illustrated by Mondelēz International, Inc.'s USD 18.4 billion in global net revenue for Biscuits & Baked Snacks in 2025. North America contributed USD 9.33 billion of that category's 2025 net revenue, about half of the total. Europe added USD 4.97 billion, so North America and Europe together supplied most of the category's global net revenue.
Instant soups and snacks are forecast to be the fastest-growing segment, with a CAGR of 6.4% between 2027 and 2032. The World Instant Noodles Association (WINA) estimated worldwide instant-noodle demand at 123.4 billion servings in 2025. On June 11, 2025, Samyang Foods began full-scale operation at its second Miryang plant in South Korea, with 6 production lines and annual capacity of 830 million Buldak noodle units. The lines comprised 3 packet-noodle lines and 3 cup-noodle lines. By accommodating both formats in one expansion, a supplier can broaden its product offer while keeping manufacturing investment concentrated in instant noodles.

By Category:
Conventional Foods Lead a Varied Prepared-Food OfferConventional foods represented a 75.33% ready-to-eat food market share in 2026 and are forecast to be the fastest-growing segment, with a CAGR of 5.8% between 2027 and 2032. Their commercial proposition can be built around the meal itself, allowing product development to emphasize preparation simplicity, portion suitability, and taste. Manufacturers can offer a prepared main meal or snack without making organic positioning the reason to buy. With such a large starting base, improvements to familiar meals can address a substantial customer pool without requiring buyers to adopt a new food category.
Organic and clean-label foods offer a separate basis for differentiation through ingredient positioning. In US frozen prepared foods, organic products generated USD 2.1 billion in consumer sales in 2025, down 3.4% from 2024. Organic positioning therefore did not insulate this US frozen subcategory from a sales decline.
By Distribution Channel:
Supermarket Scale and Online Grocery EfficiencySupermarkets and hypermarkets were the largest segment with 45.44% of market sales in 2026. US supermarkets recorded USD 1 trillion in total sales in 2025. In the 2 weeks after its September 10, 2025 launch, Marks & Spencer's Italian meals range sold 2.8 million units. All 49 meals in the revamped Italian range were new or upgraded, including 17 brand-new lines. For supermarket suppliers, coordinated meal-range development can therefore be a commercial proposition in its own right, supported by the retailer's ability to sell many related dishes.
Online retail stores are forecast to be the fastest-growing segment, with a CAGR of 7.4% between 2027 and 2032. In a 2025 survey of online supermarket grocery shoppers in Australia and New Zealand, 53.7% cited convenience and 50.2% cited efficiency and time savings. Respondents could choose multiple reasons, and 32.2% cited easier budgeting. A meal offer designed for this route can combine a short food-preparation task with the time saved in obtaining groceries. Clear portion and preparation information can consequently make a ready meal easier to select within a time-saving online grocery order.
Geography Analysis
Asia-Pacific Ready-to-Eat Food Market
Asia-Pacific accounted for 41.4% of the ready-to-eat food market size in 2026, making it the largest region. WINA estimated instant-noodle demand in China/Hong Kong at 43.27 billion servings in 2025. In Malaysia, OTS Holdings, a ready-to-eat and ready-to-cook meat-products group, opened a food manufacturing facility through its wholly owned subsidiary, Ellaziq (Malaysia), on October 28, 2025. The facility had stated capacity of up to 200 metric tons per month, although in the first half of fiscal 2026 it had not fully ramped up and local certifications and approvals remained pending. The noodle consumption and manufacturing investment illustrate Asia-Pacific's combination of substantial product demand and efforts to expand regional supply.
Middle East and Africa Ready-to-Eat Food Market
The Middle East and Africa region is forecast to be the fastest-growing, with a CAGR of 6.65% between 2027 and 2032. In 2025, Almarai Bakery said its daily production of 5 million items reached consumers through an increasing number of retail locations in Saudi Arabia and the wider Gulf Cooperation Council. The business used traditional and modern trade channels, creating different retail routes for its bakery output. This distribution-led mechanism can broaden the buyer base for established bakery products, making outlet reach an important commercial lever alongside the scale of daily production.
In North America, US food-at-home expenditures by consumers, businesses, and government entities reached USD 1.1 trillion in 2025. Guatemala had a local snack-production base, with GRUMA reporting a small corn-chip plant within Gruma Centroamérica in 2025. Retail represented the majority of Brazil's domestic food-industry sales in 2025, giving retail distribution particular weight for suppliers serving that South American country. Elsewhere in South America, Uruguay's free-zone branch 107B for prepared meals and dishes recorded a 13.0% year-over-year increase in physical production in August 2026. In Europe, HKFoods started production on its new Vantaa meal line in Finland in the third quarter of 2025, addressing growing ready-meal demand from foodservice buyers as well as retailers.
Regulatory Framework and Outlook
The comparison covers selected jurisdictions from the perspective of large manufacturers selling packaged ready-to-eat foods through retail. The United Kingdom column distinguishes Great Britain's assimilated Food Information to Consumers framework from Northern Ireland's EU food law. US covered facilities must maintain written hazard analyses, showing that compliance work extends beyond the consumer-facing label.
Regulatory Table of Ready-to-Eat Food Market
| Decision factor | United States | Brazil | United Kingdom | China | South Africa |
|---|---|---|---|---|---|
| Primary authority | Food and Drug Administration | Anvisa | Local authorities under the Food Information Regulations | State Administration for Market Regulation and local market-supervision authorities | Department of Health Food Control for administration; district and metro Municipal Health Services for enforcement |
| Key instruments or direction | 21 CFR Part 117; proposed front-of-package nutrition labels with a December 2026 rulemaking target | RDC 429/2020 and IN 75/2020; 2026-2027 labeling-policy development | Food Information to Consumers framework; Department of Health and Social Care plans for consultation on large-business healthy-food sales reporting | GB 7718-2011; GB 7718-2025 effective March 16, 2027 | R146 (2010), as amended; draft R3337 |
| Commercial effect | Written hazard analysis at covered facilities; potential labeling work if the proposal is finalized | Packaged-food nutrition panels and applicable front-of-package information | Territory-specific food information; potential additional reporting for large food businesses | Allergen information on covered prepackaged foods moves from recommended to mandatory in 2027 | Legible composition information; proposed front-of-pack logos for qualifying foods |
| Current policy attractiveness | Medium | Medium | Medium | Medium | Medium |
| Future direction of policy attractiveness | Hardening | No change | Hardening | Hardening | Hardening |
| Source: Mordor Intelligence | |||||
US manufacturers face a possible additional front label, while June 2026 UK plans for large-business healthy-food sales reporting in England, Northern Ireland, and Wales could add work beyond product labels. Brazil's nutrition-panel and front-of-package rules, in force since October 2022, support continuity because Anvisa's April 2026 dialogue concerned proposals for a future consultation rather than adopted duties. China's assessment reflects GB 7718-2025, under which allergen marking on covered prepackaged foods changes from recommended to mandatory when the standard takes effect on March 16, 2027. South Africa's proposed front-of-pack logos could require redesigns for qualifying products, although task-team and legal-review steps were outstanding on October 7, 2026.
Value Chain Stages
Ingredient formulation, branded production, wholesale replenishment, and retailing capture value through different capabilities. ADM supplies ready-meal components such as sauces, dressings, dips, and soups, placing formulation expertise upstream of finished-product manufacturing. Nestlé supplies prepared foods through brands including Stouffer's in the United States, linking production with consumer-facing brand value. The distinction matters because a recipe supplier earns from component sales, while a finished-food producer must also turn that formulation into a saleable packaged product.
Value Chain Analysis Table of Ready-to-Eat Food Market
| Primary activity | Key participants | Value capture | Bottleneck | Resilience response |
|---|---|---|---|---|
| Ingredient and formulation supply | Meal-component suppliers such as ADM | Ingredient and custom component sales | Consistency across recipe variants | Validate replacement components within the final meal recipe |
| Prepared-food manufacturing | Branded food producers such as Nestlé S.A. and Conagra Brands Inc. | Branded packaged-food sales | Risk of third-party manufacturing disruptions | Qualify backup producers for critical products |
| Wholesale replenishment | Convenience-retail distributors such as McLane Company Inc. | Wholesale packaged-food sales | Chilled selling life consumed during distribution | Coordinate commissary output with refrigerated replenishment |
| Retail sale | US grocery retailers such as Walmart Inc. | Retail packaged-food sales | Explaining meal portions and preparation requirements | Present clear meal-size and heating information across selling channels |
| Source: Mordor Intelligence | ||||
On July 15, 2025, McLane announced a US commissary program delivering individually wrapped, fresh, never-frozen grab-and-go foods with a 7-day refrigerated shelf life to convenience stores through its cold-chain network.[2] This model makes the retailer's remaining selling window part of the distributor's commercial proposition. Closer coordination between meal preparation and replenishment can therefore give chilled-food distributors a stronger role in protecting saleable product life.
Competitive Landscape
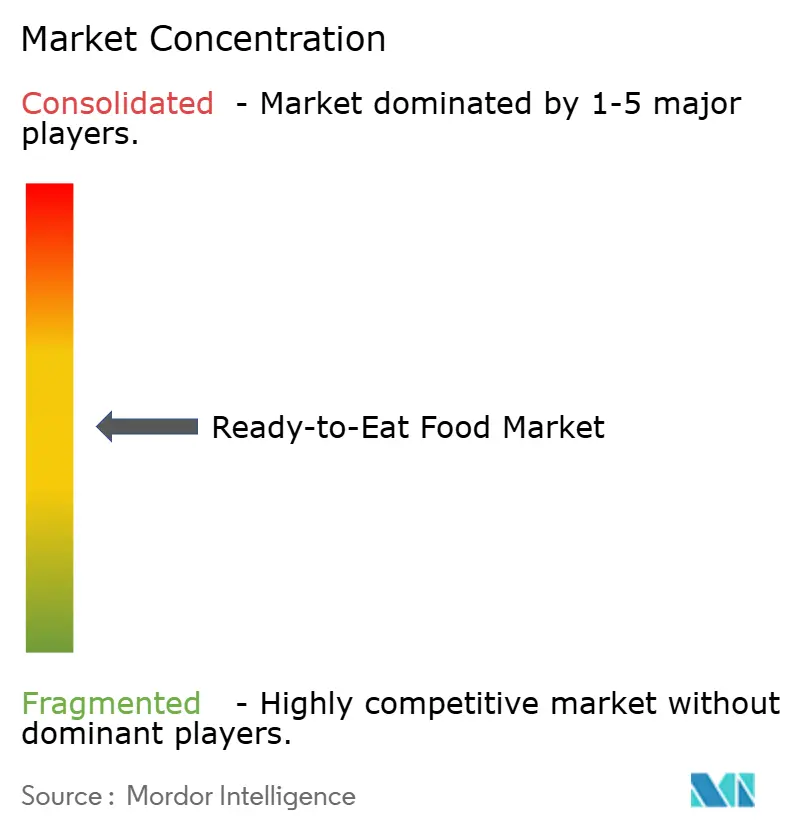
The moderately fragmented industry includes Conagra Brands Inc., Nestlé S.A., General Mills Inc., Tyson Foods Inc., and Mars Inc among its leading branded-food producers. General Mills supplies frozen entrees, frozen breakfast products, pizza, and soup, while Mars acquired Kellanova on December 11, 2025, adding Pringles, Pop-Tarts, Rice Krispies Treats, and Kellogg's international cereals. In the first quarter of fiscal 2027, ended August 30, 2026, Conagra's US Refrigerated & Frozen segment net sales decreased 2.1% to USD 1.1 billion, including a 0.5% decrease from mergers and acquisitions. Organic net sales fell 1.6%, with price/mix down 1.5% and volume down 0.1%. Price/mix therefore accounted for nearly all of Conagra's organic sales decline in this segment, with only a small contribution from lower volume.
In 2025, Nestlé launched Maggi Saucy Noodles in Europe with Japanese Teriyaki and Pad Thai recipes, and reported that noodles were the largest growth driver for its food category. Tyson Foods' fully cooked Chicken Cups offer a prepared chicken format that is ready to eat after heating. These propositions address different product-development choices, with an instant small meal built around regional recipes and a prepared chicken product built around a simple heating step. That makes preparation format a competitive design choice because it determines how much of the meal task remains with the buyer.
Ingredient execution adds a separate dimension of regulatory positioning to competition across large food portfolios. On August 26, 2026, General Mills reported that all its US cereals were made without certified colors, completing its summer 2026 commitment. Carrying a specific formulation change across a cereal portfolio can make ingredient control part of the producer's scale capability.
Ready-to-Eat Food Industry Leaders
-
Conagra Brands Inc.
-
Nestlé S.A.
-
General Mills Inc.
-
Tyson Foods Inc.
-
Mars Inc
- *Disclaimer: Major Players sorted in no particular order
Ready-to-Eat Food Market Companies Covered in this Report
- Nestlé S.A.
- Conagra Brands Inc.
- General Mills Inc.
- The Kraft Heinz Company
- Tyson Foods Inc.
- Nomad Foods Ltd.
- McCain Foods Limited
- The Campbell's Company
- The J.M. Smucker Co.
- Dr. August Oetker Nahrungsmittel KG
- Amy's Kitchen Inc.
- Mars Inc
- ITC Ltd.
- Orkla India Limited
- Gits Food Products Pvt Ltd.
- Hormel Foods Corp.
- Ajinomoto Co. Inc.
- BRF SA
- Charoen Pokphand Foods Public Company Limited
- Ready Pac Foods Inc.
Key Opportunities for Market Participants
The comparison examines how an expanding ready-meal offer can serve different retail buying occasions. In September 2026, Waitrose began a 3-year improvement of its range, introducing new and refreshed dishes in selected stores and online. That month, Waitrose reported ready-meal sales growth of 8% year over year, including 11% across its premium ranges.[3] Retailers can organize premium recipes around specific household eating occasions, giving a multiyear range refresh a commercial purpose beyond adding dishes.
Market Opportunities Table of Ready-to-Eat Food Market
| Opportunity | Why now | Buyer / lead segment | Recommended play | Main barrier | Likely beneficiaries |
|---|---|---|---|---|---|
| Premium ready-meal range extensions | Premium sales momentum accompanies a multiyear range improvement | Premium prepared-meal shoppers | Develop differentiated recipes with a clear quality step-up | Delivering the quality difference at a viable product cost | Waitrose and premium prepared-meal producers |
| Coherent store and online meal ranges | New dishes launched through both selected stores and online | Grocery shoppers using both retail routes | Align recipe descriptions, portions, and product presentation across channels | Making the same product proposition clear in both settings | Waitrose and retail-ready meal suppliers |
| Weekend meal-at-home propositions | Waitrose reported higher Friday and Saturday ready-meal sales in September 2026 | Shoppers choosing prepared weekend meals | Create coordinated dishes around a distinct evening-meal occasion | Distinguishing the occasion from routine meal replacement | Waitrose and prepared-food range developers |
| Source: Mordor Intelligence | |||||
Premium range development offers the clearest opening because it combines a demonstrated sales signal with a multiyear retail improvement program. Waitrose launched the improved range in selected stores and on Waitrose.com together, making a premium meal family available through both channels from the start. Because Waitrose reported premium ready-meal sales growing faster than its ready-meal sales overall, premium recipes rather than the standard range are the first place for a retailer to add dishes.
Recent Industry Developments in Ready-to-Eat Food Market
- Sep 2026: Mars Inc opened its first Pringles factory in Chonburi, Thailand, and began operating a second production line for regional exports.
- Aug 2026: General Mills Inc. reported that all its US cereals were made without certified colors, completing its summer 2026 commitment.
- Aug 2026: PepsiCo launched Alvalle ready-to-eat refrigerated gazpacho, made with vegetables and extra-virgin olive oil, in the United States at select Whole Foods Market locations.
Ready-to-Eat Food Market Report Scope and Research Methodology
Market Definition and Coverage
The global ready-to-eat food market measures annual consumer spending worldwide on packaged foods prepared for direct consumption, including products eaten as sold or after simple preparation such as reheating or adding hot water. Sales are classified by product type, category, retail channel and geography.
Scope exclusions: Raw foods and ingredients sold for home cooking, unprepared foods that require cooking, and foodservice meal revenue not sold as packaged ready-to-eat products are excluded.
Segments Covered in This Report
- By Product Type
- Instant Breakfast / Cereals
- Instant Soups and Snacks
- Ready Meals
- Baked Goods
- Meat Products
- Other Product Types
- By Category
- Conventional
- Organic/Clean Label
- By Distribution Channel
- Supermarkets/Hypermarkets
- Convenience Stores
- Online Retail Stores
- Other Retail Channels
- By Geography
- North America
- United States
- Canada
- Mexico
- Rest of North America
- South America
- Brazil
- Argentina
- Colombia
- Chile
- Rest of South America
- Europe
- United Kingdom
- Germany
- France
- Italy
- Spain
- Russia
- Sweden
- Belgium
- Poland
- Netherlands
- Rest of Europe
- Asia-Pacific
- China
- Japan
- India
- Thailand
- Singapore
- Indonesia
- South Korea
- Australia
- New Zealand
- Rest of Asia-Pacific
- Middle East and Africa
- United Arab Emirates
- South Africa
- Saudi Arabia
- Nigeria
- Egypt
- Morocco
- Turkey
- Rest of Middle East and Africa
- North America
Data Sources, Market Sizing, and Validation
Desk Research
Illustrative sources such as FAO Food Outlook provide a regular view of global food market conditions, while Eurostat industrial production statistics offer official manufacturing and sold-production indicators that help contextualize packaged-food supply. The World Instant Noodles Association demand tables give a product-specific volume signal, and the joint WHO and FAO assessment of Listeria in ready-to-eat foods informs food-safety and handling considerations.
Company annual reports, 10-K filings, regulatory disclosures, public investor materials and reputable food-industry reporting can clarify product portfolios, facility changes, channel exposure and reported sales trends alongside those sources. The named sources are not exhaustive, and further sources inform collection, validation and clarification.
Primary Interviews and Surveys
Interviews and structured surveys can include food manufacturers, packaged-food retailers, distributors and food-safety or category specialists, with senior executives and functional leaders asked to explain market definitions, channel coverage, pricing and product mix. Their input can test secondary-source interpretations, clarify gaps in value and category evidence, and be triangulated against public sales, production and trade indicators before an assumption is retained.
Distribution of primary research fieldwork respondents
| Company type | Respondent position | Region |
|---|---|---|
| Top tier: 30% | CXOs: 20% | APAC: 40% |
| Mid tier: 45% | Functional/Unit leaders: 35% | EMEA: 30% |
| Smaller Players: 25% | Managers: 45% | Americas: 30% |
Market-Sizing & Forecasting
Analysts can estimate global annual retail value with a top-down model, starting from packaged-food spending and retail-food sales, then isolating ready-to-eat purchases by product type, category, channel and geography. Public category sales and production indicators, household and population patterns, online-grocery reach, food-processing output, and price and product-mix changes help estimate the market's level and explain changes over time. Once category and channel signals have been reconciled with the global retail boundary, segment shares can be built and checked against the total. Multivariate regression can relate annual value to these demand, supply and price indicators, with scenario analysis used when historical coverage is uneven, while selective checks such as sampled retail selling price multiplied by observed or reported sales volume can test major product and channel estimates. Analysts can ask primary experts to challenge variable definitions and the direction of forecast changes, then investigate gaps in the selective checks through additional public evidence and keep unsupported assumptions out of the estimate.
Data Validation & Update Cycle
Analysts triangulate retailer, manufacturer, trade, production and public statistical signals, checking that each describes consumer retail sales rather than adding intermediate transfers of the same product. They flag outliers and variances by year, product, channel and region, trace each anomaly to its source and unit, and resolve it through a source check, a revised assumption or targeted respondent re-contact before multi-step analyst review and sign-off. The evidence set is refreshed annually, revisited between cycles after material market or regulatory events, and given a fresh source and calculation review immediately before delivery.
Mordor Intelligence's Ready to Eat Food Market Estimate Compared With Other Published Estimates
Published estimates can differ in the transactions and products they count and the inputs used to model demand. The global ready-to-eat food market measures annual consumer spending worldwide on packaged foods prepared for direct consumption, including products eaten as sold or after simple preparation such as reheating or adding hot water.
Key Gap Drivers include the study's defined coverage and market-specific modeling choices. Public category sales and production indicators, household and population patterns, online-grocery reach, food-processing output, and price and product-mix changes help estimate the market's level and explain changes over time.
Benchmark comparison
| Source | Market Size | Gaps in Research Methodology |
|---|---|---|
| Mordor Intelligence | USD 448.5 B (2027) | |
| Global Consultancy A | USD 412.68 B (2024) | At its 2024 base, this estimate is 8.0% below this report's 2027 value of USD 448.5 B, 3 years later. The published amount uses a 2024 base, three years before the report's comparison year, and its stated forecast projects continued market growth after that base. |
| Industry Research Publisher B | USD 149.21 B (2024) | At its 2024 base, this estimate is 66.7% below this report's 2027 value of USD 448.5 B, 3 years later. The estimate covers precooked packaged meals that require heating, a narrower product set than the full ready-to-eat food market. |
Mordor Intelligence's analysts triangulate retailer, manufacturer, trade, production and public statistical signals, checking that each describes consumer retail sales rather than adding intermediate transfers of the same product.
Key Questions Answered in the Report
What is the Ready-to-Eat Food market size and growth outlook?
The market is projected to rise from USD 448.5 billion in 2027 to USD 594 billion by 2032, registering a CAGR of 5.78% between 2027 and 2032.
What is driving demand for packaged ready-to-eat meals and snacks?
Individual portions and wider e-grocery access support demand, illustrated by 39.7 million one-person households in the United States in 2025.
Which packaged ready-to-eat product type leads sales?
Baked goods held 34.14% of market sales in 2026.
Which companies are major packaged ready-to-eat food suppliers?
Major participants include Conagra Brands Inc., Nestlé S.A., General Mills Inc., Tyson Foods Inc., and Mars Inc.
What is a key cost challenge for packaged ready-to-eat food producers?
Nutrition-label changes are a potential cost pressure. The FDA estimated annualized US packaged-food industry costs of USD 191 million to USD 530 million over 2025-2034, in 2023 dollars at a 2% discount rate, if its proposed rule is finalized.
Which region leads packaged ready-to-eat food sales, and where is growth fastest?
Asia-Pacific held 41.4% of market sales in 2026. The Middle East and Africa region is forecast to grow fastest at a CAGR of 6.65% between 2027 and 2032.