Rare Earth Elements Market Size and Share
Market Overview
| Study Period | 2019 - 2030 |
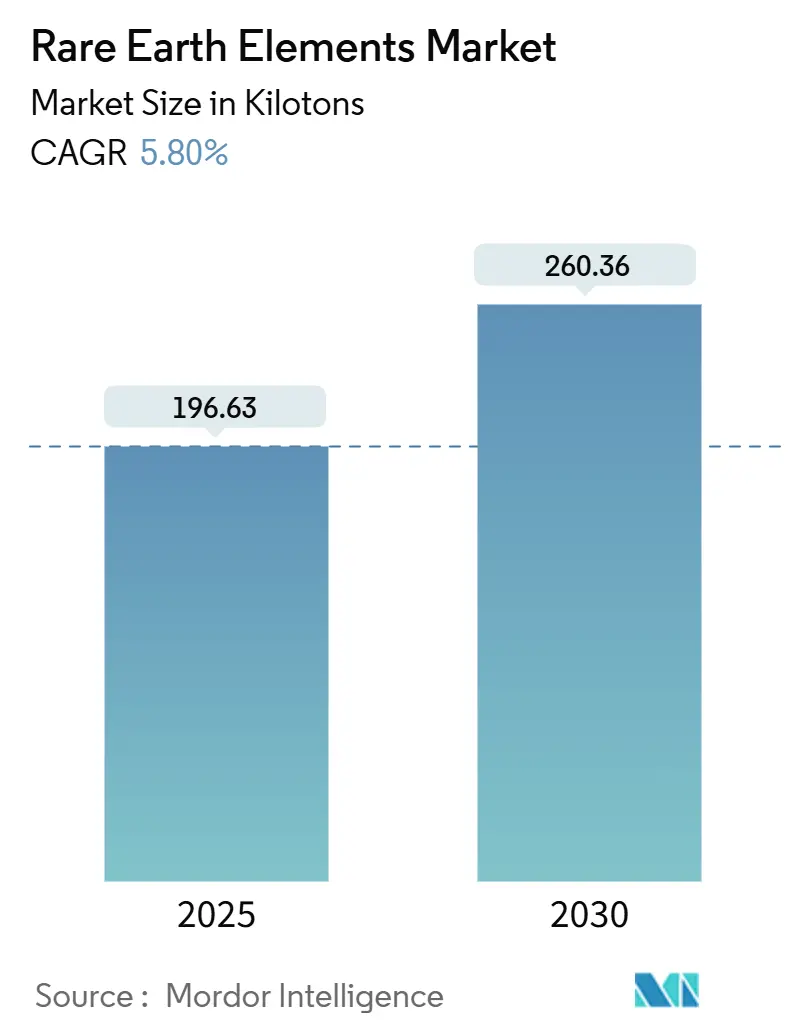
| Market Volume (2025) | 196.63 kilotons |
| Market Volume (2030) | 260.36 kilotons |
| Growth Rate (2025 - 2030) | 5.80% CAGR |
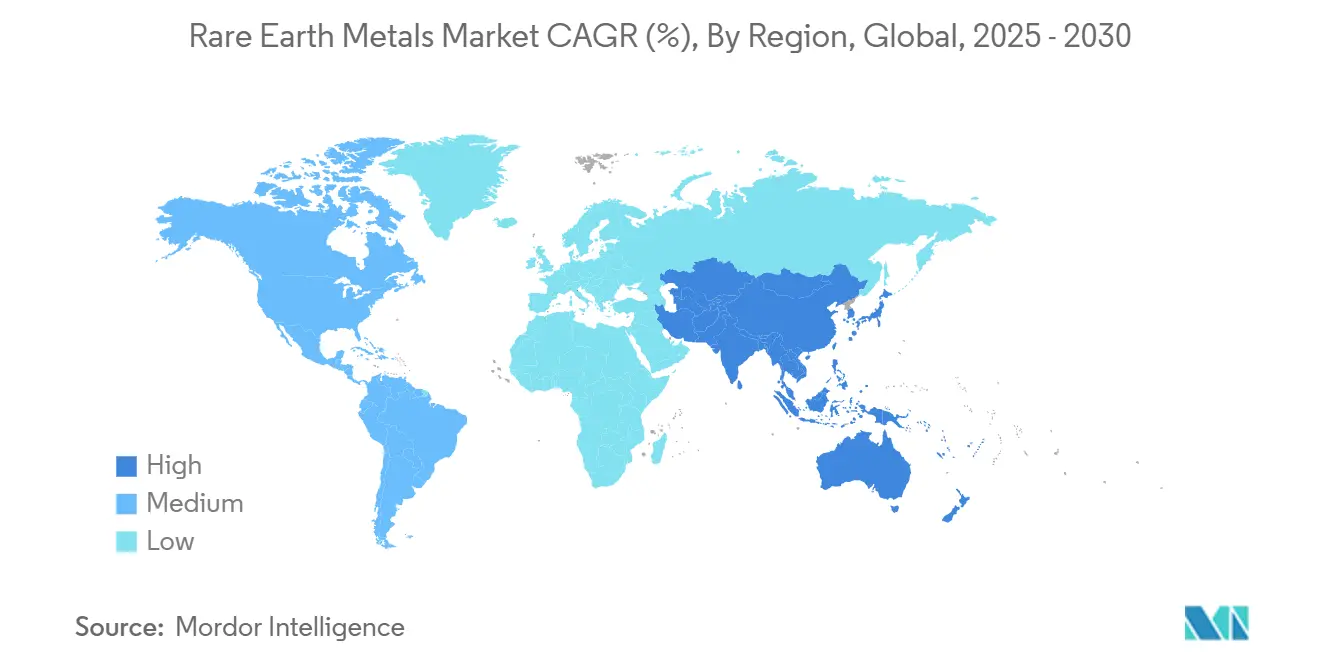
| Fastest Growing Market | Asia-Pacific |
| Largest Market | Asia-Pacific |
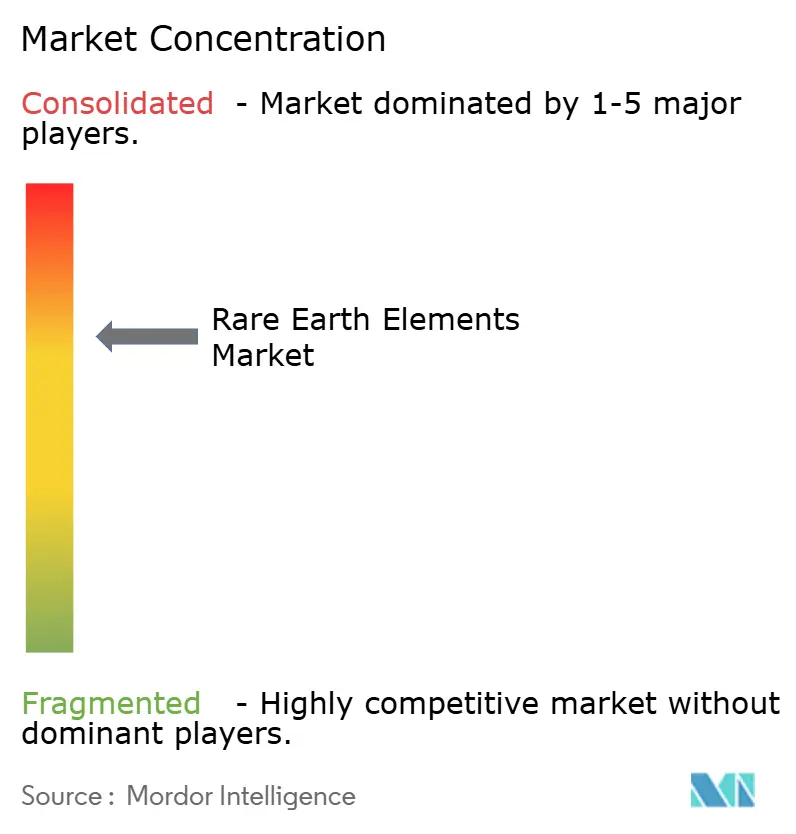
| Market Concentration | Medium |
Major Players*Disclaimer: Major Players sorted in no particular order Image © Mordor Intelligence. Reuse requires attribution under CC BY 4.0. |
|
Rare Earth Elements Market Analysis by Mordor Intelligence
The rare earth metals market stood at 196.63 kilotons in 2025 and is projected to reach 260.36 kilotons by 2030, expanding at a 5.80% CAGR over the forecast period. Robust demand from clean-energy technologies, consumer devices, and defense platforms continues to lift volumes, while the rapid scale-up of electric vehicles (EVs) threatens to outstrip current neodymium and praseodymium production by 2036 if new capacity or large-scale recycling fails to materialize. Asia-Pacific remains the production and processing hub, anchored by China’s dominant position, yet policy support in the United States, Canada, and the European Union is opening investment pathways that could reduce concentration risk. Magnet applications post the strongest growth because high-performance NdFeB magnets are indispensable in EV traction motors and direct-drive wind turbines, giving this segment an 8.02% forecast CAGR. Mounting geopolitical friction is prompting Western governments to subsidize domestic projects; the U.S. Department of Defense alone has committed more than USD 439 million since 2020 to shore up supply chains.
Key Report Takeaways
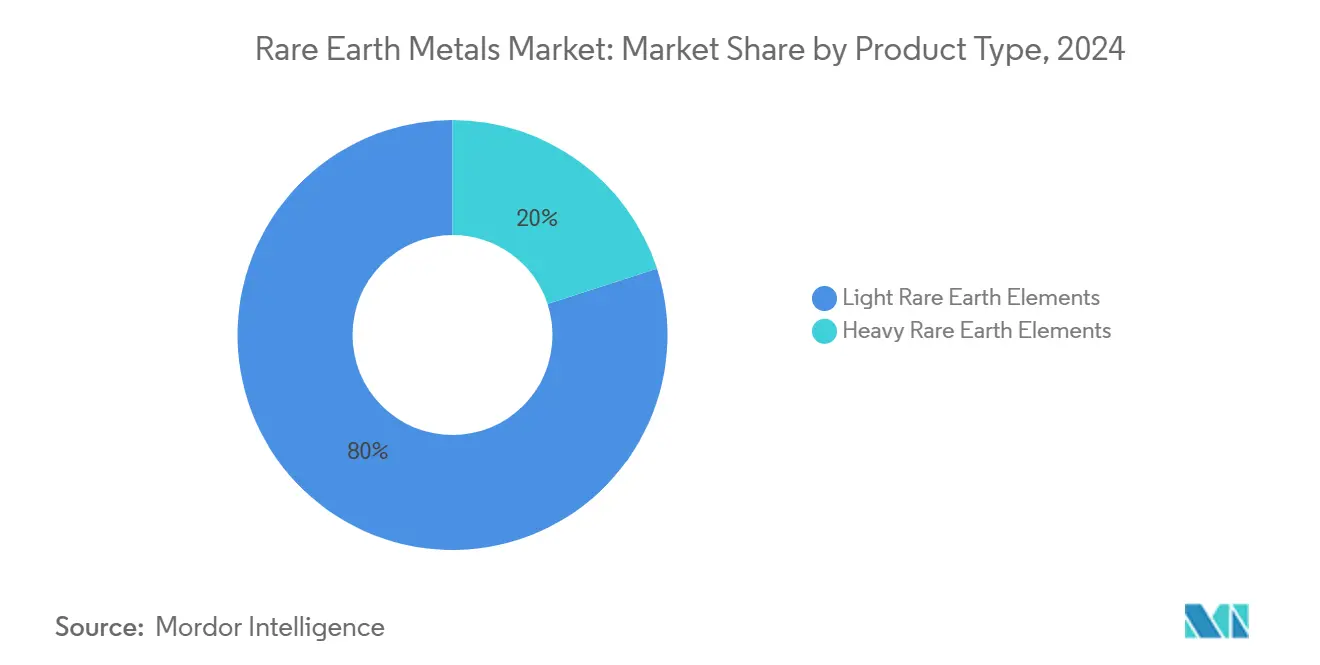
- By product type, light rare earth elements commanded 80% of the rare earth metals market share in 2024, and are expected to deliver a 5.98% forecast CAGR to 2030.
- By element, cerium led with a 40% share in 2024; neodymium is set to advance at a 9.20% CAGR through 2030.
- By application, magnets accounted for 32% of the rare earth metals market size and are set to grow at 8.02% CAGR, outpacing all other uses.
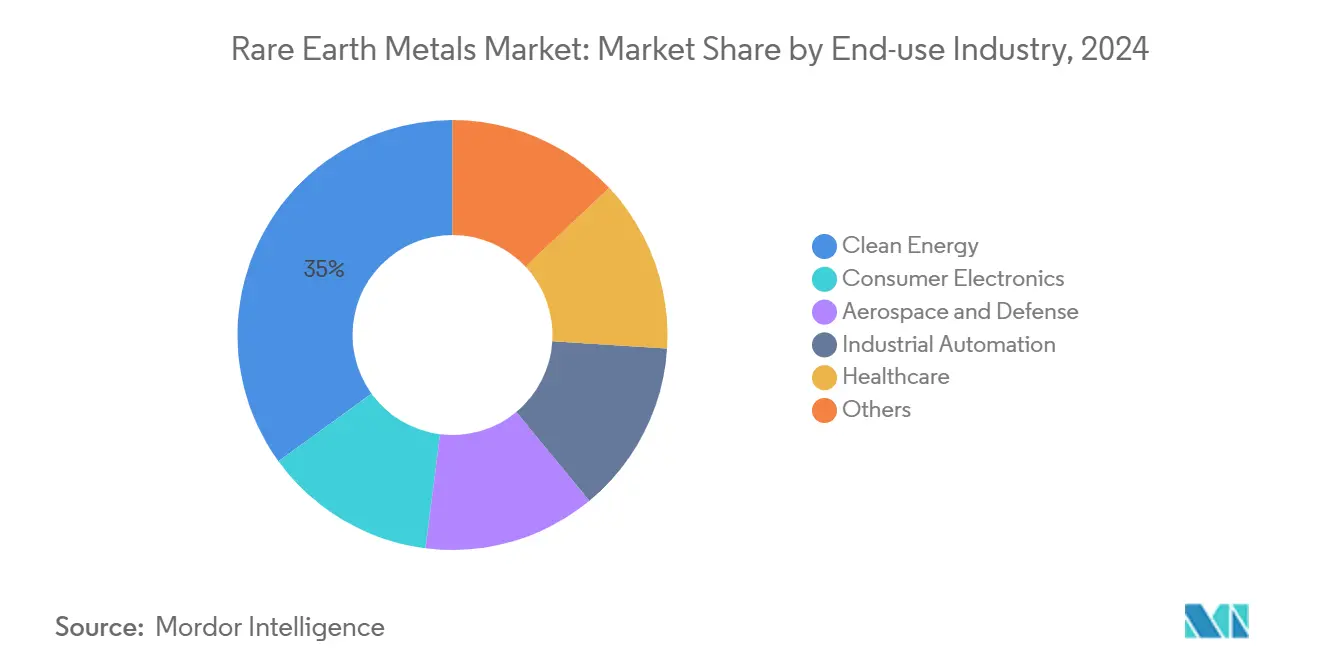
- By end-use industry, clean-energy technologies represented 35% of volumes in 2024 and are projected to climb at 6.50% CAGR to 2030.
- By geography, Asia-Pacific captured 86% of global output in 2024; and is set to advance at a 5.92% CAGR for 2025-2030 as new U.S. and Canadian projects move ahead.
Global Rare Earth Elements Market Trends and Insights
Drivers Impact Analysis
| Driver | (~) % Impact on CAGR Forecast | Geographic Relevance | Impact Timeline |
|---|---|---|---|
| High Demand from Emerging Economies | +1.20% | Asia-Pacific, Africa | Medium term (2-4 years) |
| Dependency of 'Green Technology' on Rare Earth Elements | +1.80% | Europe, North America, China | Long term (≥4 years) |
| Rapid Penetration of Permanent-Magnet EV Motors across Asia | +1.50% | Asia-Pacific, spill-over to West | Medium term (2-4 years) |
| Scandium-Aluminum Alloys Adoption in Aerospace Manufacturing | +0.70% | North America, Europe | Medium term (2-4 years) |
| High Demand in Consumer Electronics | +0.90% | Global, with concentration in Asia-Pacific manufacturing hubs | Short term (≤2 years) |
Source: Mordor Intelligence
High Demand from Emerging Economies
Emerging markets are lifting consumption as governments accelerate industrialization and renewable-energy deployment. China increased export volumes in 2024 despite slower domestic use, masking tightening long-term supply. India intends to triple refined output by 2032 through Indian Rare Earths Limited, lowering import dependency and bolstering regional self-reliance. African nations collectively aim to deliver 9% of global supply by 2029, adding new low-cost tonnage that could temper price spikes. These supply-side moves are coupled with demand growth from regional EV, electronics, and wind-turbine assembly plants. The resulting realignment lessens single-country concentration yet raises integration hurdles for downstream users.
Dependency of Green Technology on Rare Earth Elements
Wind turbines, EV traction motors, and energy-efficient lighting require large volumes of neodymium, praseodymium, dysprosium, and terbium. The European Commission projects demand to rise 4.5 to 5.5 times by 2030 and 2050, respectively[1]European Commission, “A Secure and Sustainable Supply of Critical Raw Materials,” europa.eu . Each offshore wind turbine contains kilograms of NdFeB magnets that deliver high torque at low rotational speeds. Recycling breakthroughs are gaining traction; Cyclic Materials attracted investment from Microsoft’s Climate Innovation Fund to scale a process that recovers up to 85% of rare earths from discarded hard drives. Successful commercialization of closed-loop flows will cushion raw-material risk and loosen China’s grip on supply over the long term.
Rapid Penetration of Permanent-Magnet EV Motors across Asia
Automakers headquartered in Asia continue to adopt neodymium-iron-boron magnets as the default architecture for traction motors, underpinning an expected tripling of magnet-grade oxide offtake by 2035. Several manufacturers are experimenting with samarium-iron or even rare-earth-free designs, yet none of these alternatives have attained commercial volume equivalency. That gap highlights a realistic scenario in which demand for the traditional Nd-Pr blend overshoots published capacity forecasts during the late 2020s. An inferred consequence is that price elasticity will diminish, making downstream cost pass-through more likely and raising vehicle price dispersion within high-volume segments.
Scandium-Aluminum Alloys Adoption in Aerospace Manufacturing
Lightweight scandium-aluminum alloys are gaining favor in both military and commercial aircraft due to their superior weldability and fatigue resistance. Pilot-scale scandium metal production achieved by NioCorp has shortened North America’s supply chain for this previously niche element. As more fuselage structures incorporate scandium-bearing panels, the aerospace sector’s share of the Rare Earth Metals market size is set to inch upward despite its low absolute volume. This implies that future supply contracts may include price-escalation clauses indexed to scandium oxide spot levels, safeguarding airframe builders from sudden spikes.
Restraints Impact Analysis
| Restraint | (~) % Impact on CAGR Forecast | Geographic Relevance | Impact Timeline |
|---|---|---|---|
| High Capex & Radioactive Waste Management Costs for Separation Facilities | -1.30% | Global entrants | Short term (≤2 years) |
| Price Volatility Linked to Chinese Policy Shifts | -0.80% | Manufacturing-intensive economies | Short term (≤2 years) |
| Inconsistent Supply of Rare Earth Elements | -0.60% | Global, with particular vulnerability in Western supply chains | Medium term (2-4 years) |
Source: Mordor Intelligence
High Capex & Radioactive Waste-Management Costs for Separation Facilities
Building a standalone separation and oxide refinery demands specialized solvent-extraction circuits and containment systems for thorium- and uranium-bearing residues. These requirements raise operating costs by 15-20%, deterring first-movers outside China. Research groups in Guangzhou demonstrated an electrokinetic mining technique that delivers 95% recovery and cuts ammonia emissions by 95%, offering a viable pathway to comply with stricter Western environmental rules. Mobilizing sufficient funding and de-risking the technology at commercial scale remain near-term hurdles for non-Chinese operators.
Price Volatility Linked to Chinese Policy Shifts
China’s December 2023 export-technology ban and October 2024 traceability rules triggered a sell-off followed by abrupt price rebounds. Sporadic regulatory tweaks compel manufacturers to lock in long-term offtake contracts and strategic inventories, increasing balance-sheet exposure. The resulting volatility undermines forecast accuracy and complicates investment decisions in new capacity across the rare earth metals market.
Segment Analysis
By Product Type: Light REEs Retain Volume Leadership
Light rare earths, supplied 80% of global tonnage in 2024 because of their relative abundance and lower mining costs. The rare earth metals market size for light REEs is projected to expand at 5.98% CAGR to 2030, driven by polishing powders, FCC catalysts, and NdFeB magnet feedstock. Recycling programs in Europe and North America are beginning to divert waste streams, creating secondary feed that mildly tempers virgin-ore growth. Heavy rare earths such as dysprosium, terbium, and yttrium deliver higher unit value but face geological scarcity. Ongoing pilot trials in electrokinetic leaching show 95% recovery with 60% lower power use, potentially narrowing production-cost gaps between product types and reshaping long-term supply economics.
Second-order effects from EV demand, wind-energy roll-outs, and defense procurement maintain strong price signals for both classes. Yet project financing remains skewed toward light REE deposits because of easier metallurgy and shorter ramp-up timelines. Heavy-REE output is expected to track specialty demand in high-temperature magnets, laser crystals, and phosphors, supporting a balanced revenue mix across the rare earth metals market.
By Element: Cerium Dominates While Neodymium Accelerates
Cerium controlled a 40% share in 2024 on the back of glass-polishing powders and autocatalyst use. Experimentation at HSE University produced tunable yellow luminescence, opening potential lighting and display applications that could broaden cerium’s addressable market[2]National Research University Higher School of Economics, “Cerium Glows Yellow,” phys.org . Neodymium registers the fastest growth at 9.20% CAGR as EV traction motors and turbo-generators soak up magnet alloy feed. MP Materials began commercial NdPr metal pours at its Texas facility in January 2025, an essential milestone in rebuilding the United States’ mine-to-magnet supply chain.
Terbium and dysprosium enjoy stable demand in high-coercivity magnets for offshore wind and defense gear, yet output is constrained by metallurgical complexity. Scandium’s profile is rising; Rusal expects to initiate scandium oxide production in 2025, lowering the input cost of aerospace-grade Al-Sc alloys and accelerating adoption in commercial aircraft. Altogether, diversified element uptake underpins a resilient revenue structure for the rare earth metals market.
By Application: Magnets Power Market Momentum
Magnet manufacturing consumed 32% of total volumes in 2024, and the segment is projected to grow at 8.02% CAGR through 2030. The rare earth metals market share for magnets will rise in tandem with EV penetration and wind-capacity additions. MP Materials’ Fort Worth plant targets 1,000 metric tons of sintered NdFeB magnets annually, with automotive qualification slated for late 2025. Conversely, AI-assisted material discovery enabled Materials Nexus to prototype a rare-earth-free magnet with 50% lower production cost, underscoring the dual track of incremental capacity and substitution research.
Catalysts, ceramics, phosphors, glass-polishing compounds, and metallurgy collectively provide demand diversification and cushioning against price swings. Steady electronics manufacturing in Asia sustains glass-polishing powders, while European emissions mandates keep autocatalyst volumes intact. The balanced application profile reduces cyclicality in the rare earth metals market.
By End-Use Industry: Clean-Energy Transformation Accelerates Demand
Clean-energy systems comprised 35% of consumption in 2024 and will expand at 6.50% CAGR to 2030. Offshore wind turbines require several hundred kilograms of NdFeB magnets each, translating incremental capacity directly into rare-earth tonnage. Consumer electronics maintain scale in speakers, haptics, and display phosphors, though unit growth moderates as markets mature. Aerospace and defense uptake rises on scandium-aluminum alloy deployment for weight saving and on neodymium-iron-boron actuators in precision-guided munitions.
Industrial automation and robotics add emerging traction. High-end sensors and servo motors embed rare-earth components that deliver compactness and efficiency. Healthcare usage in MRI contrast media remains niche by mass but commands premium pricing, bolstering overall margins inside the rare earth metals market.
Note: Segment Share of all individual segments available upon report purchase
Geography Analysis
Asia-Pacific produced 86% of global output in 2024, anchored by China’s integrated mining, separation, and magnet manufacturing complex. The region is forecast to grow at 5.92% CAGR to 2030 on relentless EV and consumer-electronics capacity expansions. Japan and South Korea deepen collaboration on shared data platforms for battery and magnet supply chains to increase resilience by 2025.
North America is the significant region as policy incentives compress timelines for new mines, refineries, and magnet plants. The U.S. Department of Defense has dispersed more than USD 439 million since 2020 to strengthen domestic capabilities, and MP Materials’ Mountain Pass complex feeds downstream operations in Texas. Canada’s critical-minerals roadmap complements U.S. goals by funding exploration and pilot separation hubs, creating an integrated continental value chain.
Europe’s Critical Raw Materials Act sets quantitative targets for mining, processing, and recycling by 2030, catalyzing investment in Norwegian, Swedish, and French deposits alongside UK-based recycling ventures[3]European Parliament, “Regulation (EU) 2024/1252,” eur-lex.europa.eu . However, greenfield mine approvals remain slow because of permitting hurdles and local opposition. Africa’s contribution grows as projects in Burundi, Tanzania, and South Africa progress; the continent could supply 9% of global demand by 2029, diversifying trade flows and reducing single-supplier risk.
Competitive Landscape
China’s internal consolidation created China Rare Earth Group by merging major state-owned producers, raising its pricing leverage across the rare earth metals market. Outside China, MP Materials, Lynas Rare Earths, USA Rare Earth, and American Rare Earths are scaling vertically integrated operations that pair upstream resources with mid-stream conversion and downstream magnet output. Ucore Rare Metals received a USD 4 million contract from the U.S. Department of Defense to deploy its RapidSX technology for heavy-REE refining, reflecting government interest in processing know-how.
Technological differentiation is a central competitive lever. ReElement Technologies commercialized a modular recycling platform that lowers capex and build-time relative to solvent extraction, appealing to electronics OEMs seeking circular-economy credentials. Cross-border equity moves intensify: Hancock Prospecting’s minority stake in MP Materials underscores international investors’ appetite for secure supply exposure.
End-user alliances underpin revenue visibility. A global automaker signed a multi-year offtake with MP Materials in 2024 to source U.S.-made magnets, signaling OEM willingness to pay premiums for non-Chinese material. Airbus and Boeing evaluate scandium-based alloy supply from Rusal and NioCorp that could unlock lighter fuselage and wing structures, enhancing fuel efficiency and emissions performance. Collectively, strategic capital, public incentives, and innovative processes are reshaping competitive dynamics in the rare earth metals market.
Rare Earth Elements Industry Leaders
-
Iluka Resources Limited
-
Lynas Rare Earths Ltd
-
MP Materials
-
Shenghe Resources Holding Co., Ltd.
-
Northern Rare Earth
- *Disclaimer: Major Players sorted in no particular order
Recent Industry Developments
- January 2025: MP Materials has initiated commercial production of neodymium-praseodymium (NdPr) metal and commenced trial production of automotive-grade, sintered neodymium-iron-boron (NdFeB) magnets at its Independence facility in Texas. This development represents a crucial milestone in reestablishing the U.S. rare earth magnet supply chain.
- January 2024: MP Materials secured a USD 58.5 million grant to propel the construction of the U.S.'s inaugural fully-integrated rare earth magnet manufacturing facility, located in Fort Worth, Texas. This funding comes under the Section 48C Advanced Energy Project tax credit initiative.
Global Rare Earth Elements Market Report Scope
Rare Earth elements are used in loudspeakers, telescope lenses, studio lighting, and computer hard drives to make them smaller and more efficient. They are used in screens and displays as they can produce different colors. Rare Earth elements usually have high electrical conductivity, naturally occurring together in minerals. They are the strongest magnets available today.
The market is segmented by element, application, and geography. By element, the market is segmented into cerium, neodymium, lanthanum, dysprosium, terbium, yttrium and scandium, and other elements. By application, the market is segmented into catalysts, ceramics, phosphors, glass and polishing, metallurgy, magnets, and other applications. The report also covers the market sizes and forecasts for the rare earth elements market in 15 countries across the major regions. For each segment, the market sizing and forecasts have been done based on volume (ton).
| By Product Type | Light Rare Earth Elements | ||
| Heavy Rare Earth Elements | |||
| By Element | Cerium | Oxide | |
| Sulfide | |||
| Other Compounds | |||
| Neodymium | Alloy | ||
| Lanthanum | Alloy | ||
| Oxide | |||
| Other Compounds | |||
| Dysprosium | |||
| Terbium | |||
| Yttrium | |||
| Scandium | |||
| Other Elements | |||
| By Application | Catalysts | ||
| Ceramics | |||
| Phosphors | |||
| Glass and Polishing | |||
| Metallurgy | |||
| Magnets | |||
| Other Applications | |||
| By End-use Industry | Clean Energy | ||
| Consumer Electronics | |||
| Aerospace and Defense | |||
| Industrial Automation | |||
| Healthcare | |||
| Others | |||
| By Geography | Asia-Pacific | China | |
| India | |||
| Japan | |||
| South Korea | |||
| Australia | |||
| Rest of Asia-Pacific | |||
| North America | United States | ||
| Canada | |||
| Mexico | |||
| Europe | Germany | ||
| United Kingdom | |||
| France | |||
| Italy | |||
| Nordics | |||
| Rest of Europe | |||
| South America | Brazil | ||
| Argentina | |||
| Rest of South America | |||
| Middle East and Africa | Saudi Arabia | ||
| United Arab Emirates | |||
| South Africa | |||
| Rest of Middle East and Africa | |||
| Light Rare Earth Elements |
| Heavy Rare Earth Elements |
| Cerium | Oxide |
| Sulfide | |
| Other Compounds | |
| Neodymium | Alloy |
| Lanthanum | Alloy |
| Oxide | |
| Other Compounds | |
| Dysprosium | |
| Terbium | |
| Yttrium | |
| Scandium | |
| Other Elements |
| Catalysts |
| Ceramics |
| Phosphors |
| Glass and Polishing |
| Metallurgy |
| Magnets |
| Other Applications |
| Clean Energy |
| Consumer Electronics |
| Aerospace and Defense |
| Industrial Automation |
| Healthcare |
| Others |
| Asia-Pacific | China |
| India | |
| Japan | |
| South Korea | |
| Australia | |
| Rest of Asia-Pacific | |
| North America | United States |
| Canada | |
| Mexico | |
| Europe | Germany |
| United Kingdom | |
| France | |
| Italy | |
| Nordics | |
| Rest of Europe | |
| South America | Brazil |
| Argentina | |
| Rest of South America | |
| Middle East and Africa | Saudi Arabia |
| United Arab Emirates | |
| South Africa | |
| Rest of Middle East and Africa |
Key Questions Answered in the Report
What is the current size of the rare earth metals market?
The rare earth metals market 196.63 kilotons in 2025 and is forecast to expand to 260.36 kilotons by 2030, reflecting a 5.80% CAGR.
Why are rare earth elements important for electric vehicles?
NdFeB magnets made from neodymium, praseodymium, dysprosium, and terbium enable compact, high-efficiency traction motors that extend driving range and support rapid acceleration.
Which region dominates rare earth production?
Asia-Pacific, led by China, accounted for the majority of global output in 2024, thanks to integrated mining and refining capabilities.
How are governments outside China securing supply?
The United States, Canada, and the European Union offer grants, tax credits, and loan guarantees for new mines, separation plants, and recycling facilities to diversify the supply chain.
What is the biggest restraint on new rare earth projects?
High capital costs and stringent radioactive-waste management requirements raise financial risk and lengthen development timelines, particularly for refineries outside China.

