Railway Telematics Market Size and Share
Market Overview
| Study Period | 2019 - 2030 |
|---|---|
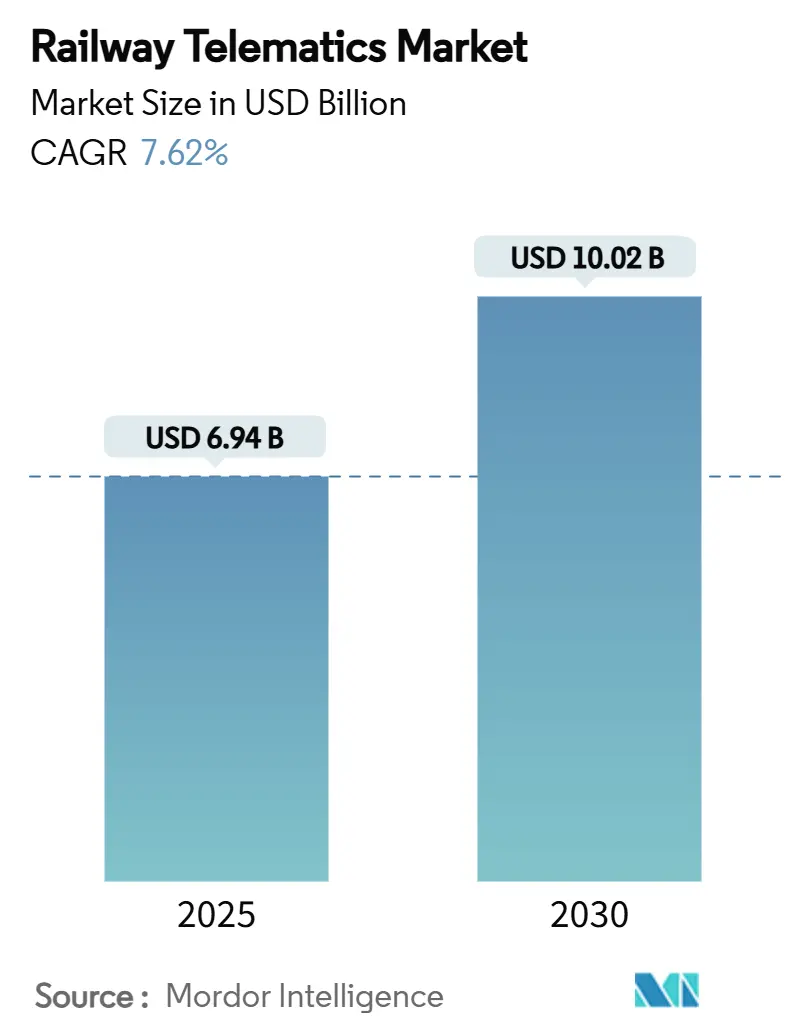
| Market Size (2025) | USD 6.94 Billion |
| Market Size (2030) | USD 10.02 Billion |
| Growth Rate (2025 - 2030) | 7.62% CAGR |
| Fastest Growing Market | Asia Pacific |
| Largest Market | North America |
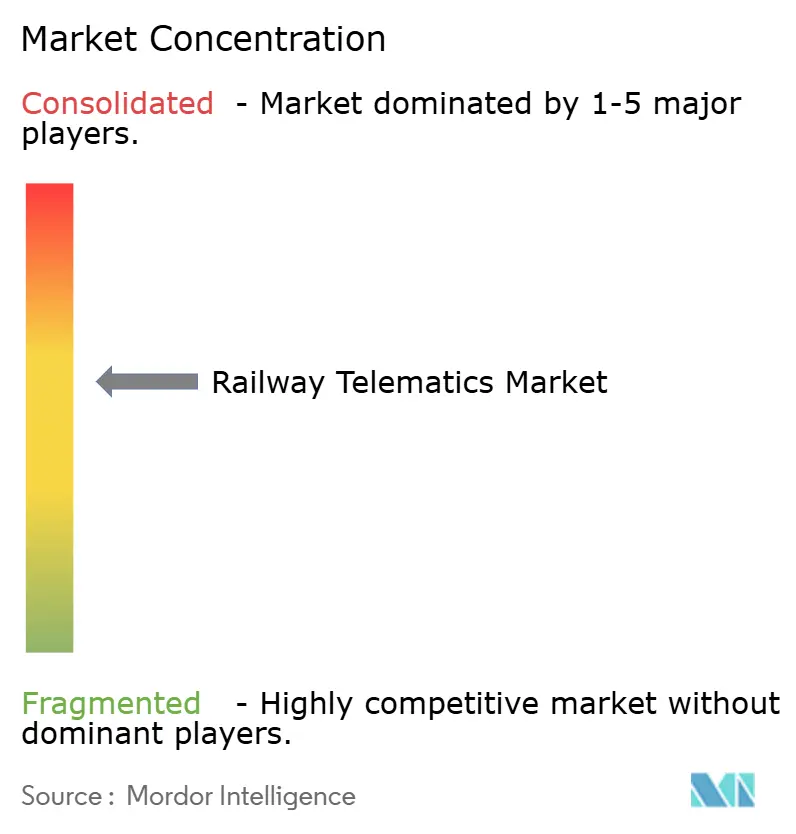
| Market Concentration | Medium |
Major Players *Disclaimer: Major Players sorted in no particular order Image © Mordor Intelligence. Reuse requires attribution under CC BY 4.0. | |
Railway Telematics Market Analysis by Mordor Intelligence
The railway telematics market size stands at USD 6.94 billion in 2025 and is forecast to climb to USD 10.02 billion by 2030, progressing at a 7.62% CAGR. Rising digitalization budgets, falling sensor prices, and mandatory real-time safety rules combine to create a clear economic case for large-scale deployments. Operators view telematics as the fastest route to higher asset utilization, lower dwell time, and a measurable reduction in safety incidents. The parallel shift from hardware-centric to software-defined architectures is widening the performance gap between early adopters and laggards. Competitive intensity is sharpening as cloud, satellite, and edge-computing specialists team with established rail equipment makers to offer integrated, cyber-resilient platforms.
Key Report Takeaways
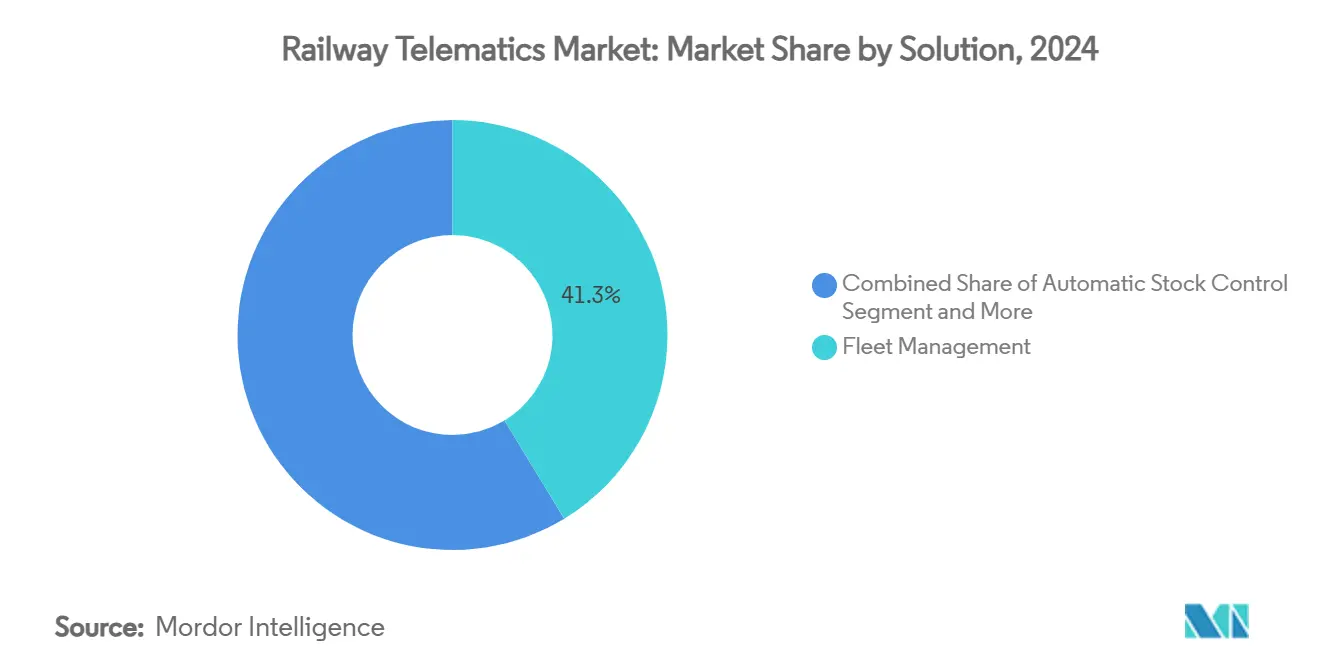
- By solution, fleet management held 41.33% of the railway telematics market share in 2024, while remote data access is advancing at an 8.46% CAGR to 2030.
- By railcar type, tank cars led with 33.15% revenue share in 2024, whereas refrigerated boxcars are projected to expand at a 9.24% CAGR through 2030.
- By component, telematics control units accounted for 49.21% of the railway telematics market size in 2024, and multi-function sensors are forecast to grow at 8.16% CAGR.
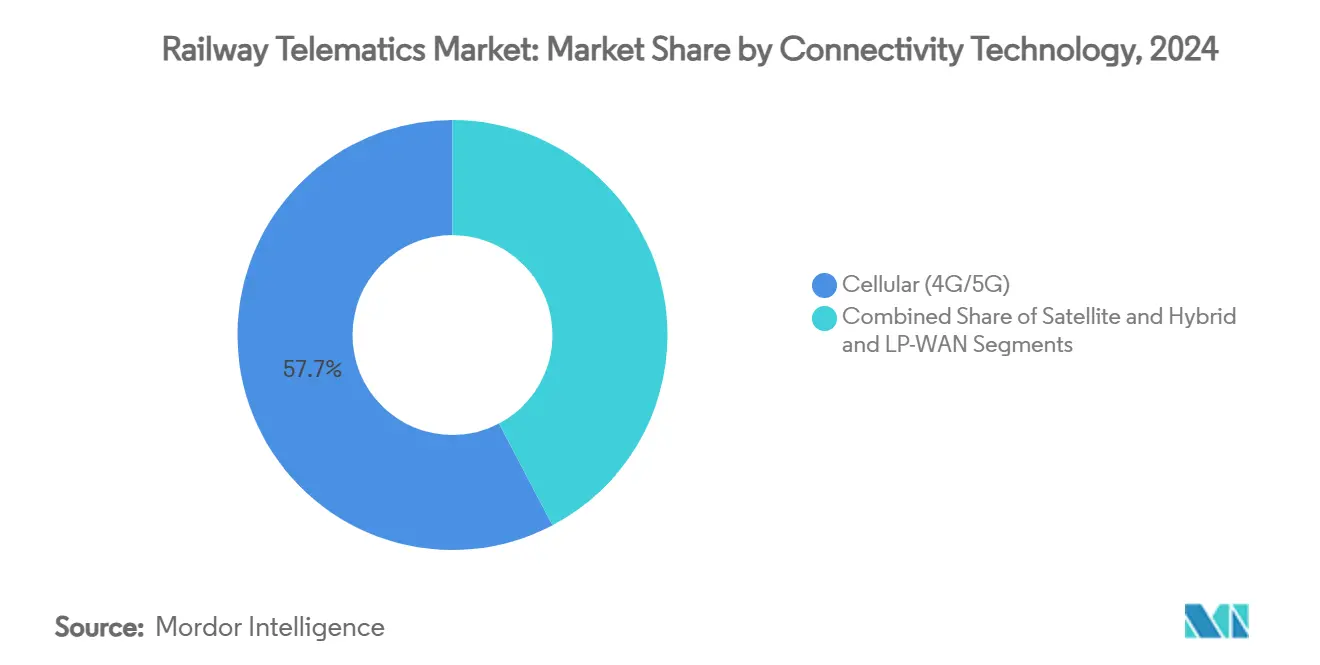
- By connectivity technology, cellular networks captured 57.66% share in 2024, and hybrid plus LP-WAN links are poised for a 10.12% CAGR to 2030.
- By application, freight operations dominated with 83.11% share in 2024, while passenger services are set to rise at a 9.14% CAGR as urban mobility needs escalate.
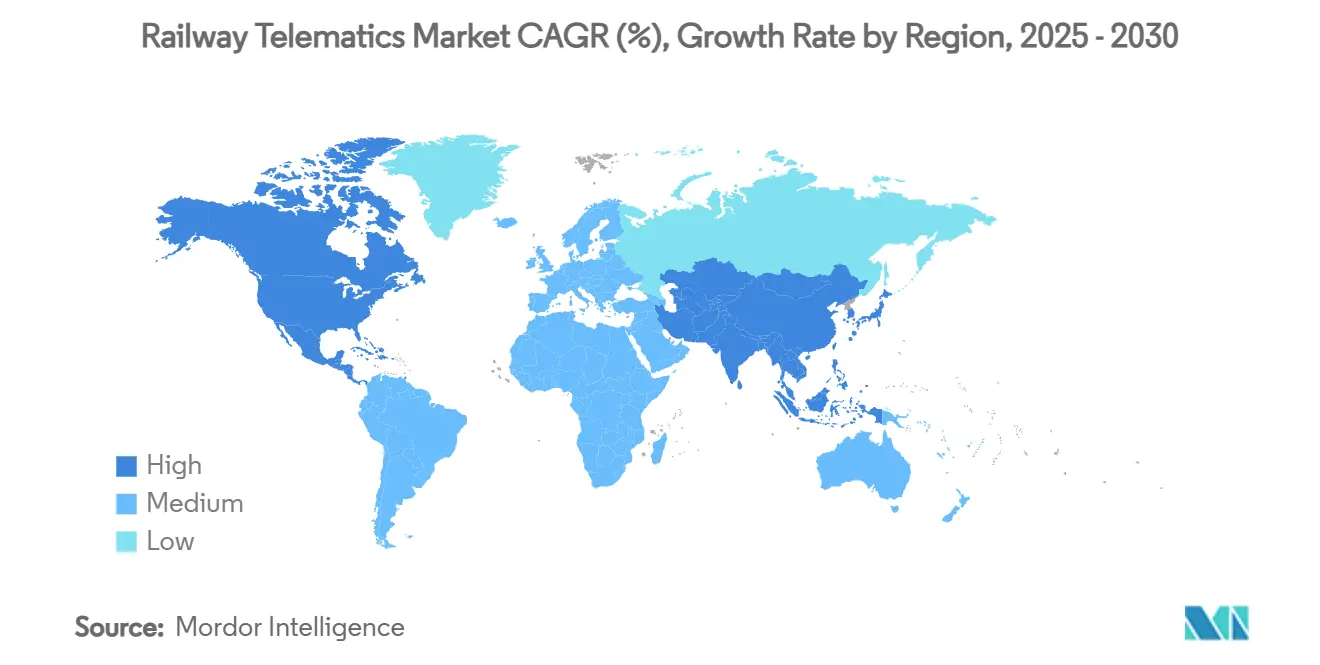
- By geography, North America dominated the railway telematics market with 39.56% share in 2024, whereas Asia-Pacific is projected to expand at a 8.71% CAGR through 2030.
Global Railway Telematics Market Trends and Insights
Drivers Impact Analysis*
| Driver | (~) % Impact on CAGR Forecast | Geographic Relevance | Impact Timeline |
|---|---|---|---|
| Smart-Rail Digitalization Programs and Funding Commitments | +1.9% | EU and North America focused, global spillover | Medium term (2-4 years) |
| Mandatory Real-Time Safety and Visibility Regulations | +1.5% | North America and EU leadership | Short term (≤ 2 years) |
| Declining Sensor and LP-WAN Connectivity Costs | +1.3% | Global, fastest uptake in Asia-Pacific | Long term (≥ 4 years) |
| Growing Private Wagon-Leasing Models in Freight | +1.1% | North America core, expanding elsewhere | Medium term (2-4 years) |
| AI-Enabled Predictive-Maintenance ROI Proof-Points | +0.9% | Mature markets first | Long term (≥ 4 years) |
| Quantum-Secure Satellite IoT Pilots | +0.3% | Limited to advanced research hubs | Long term (≥ 4 years) |
| Source: Mordor Intelligence | |||
Smart-Rail Digitalization Programs and Funding Commitments
National re-signaling and automation budgets are reshaping procurement cycles. Norway’s EUR 3 billion ERTMS-ready program and Germany’s Digital Rail initiative prove that government money now prioritizes open, interoperable telematics layers, not one-off hardware buys. The European Union’s plan to phase out legacy signals by 2040 standardizes interfaces, trimming integration risk for vendors. SNCF earmarked 96% of a EUR 5.0 billion rail upgrade budget for digital assets, accelerating private co-investment opportunities [1]“SNCF 2025 Investment Plan,” SNCF Group, sncf.com. North American freight railroads mirror this trajectory by pooling USD 110 million for communications upgrades. Across regions, capital commitments reward suppliers that bundle hardware, software, and life-cycle cyber support in a single contract.
Mandatory Real-Time Safety and Visibility Regulations
Regulators are moving from guidance to enforcement. The Transportation Security Administration’s proposed rule compels nearly 300 rail entities to adopt 24-hour cyber incident reporting and continuous monitoring, elevating telematics from optional to required infrastructure. Transport Canada’s Enhanced Train Control Regulations introduce fines for lines that lack automated braking and crew alerting technologies [2]“Enhanced Train Control Regulations,” Transport Canada, transportcanada.gc.ca. In Europe, the Critical Entities Resilience Directive obliges operators to run annual risk audits and demonstrate telemetry-based mitigation plans. Compliance deadlines redirect budgets toward certified, secure data platforms, shortening payback periods for investments that once hinged on purely operational savings.
Declining Sensor and LP-WAN Connectivity Costs
Average multi-function sensor prices have fallen below USD 50, opening the door for full-fleet instrumentation. Mature LoRaWAN ecosystems now deliver multi-year battery life and sub-USD 10 monthly operating costs per wagon, a fraction of traditional cellular fees. Getlink’s satellite-IoT trials on cross-Channel freight corridors show global coverage is no longer cost-prohibitive. Edge-analytics modules embedded in the latest sensor suites cut backhaul data volume by 70%, trimming carrier bills and easing cybersecurity footprints. As payback cycles drop to under 18 months on many freight routes, procurement decisions pivot toward platform quality rather than upfront hardware cost.
Growing Private Wagon-Leasing Models in Freight
Asset-light freight operators want precise visibility into utilization and maintenance. Leading lessor GATX selected a cloud-native monitoring suite that tracks shock events, mileage, and idle time, improving billing accuracy for clients. The RailPulse coalition now acts as a vendor-neutral exchange, allowing any certified sensor to stream standardized data, which removes a key barrier to multi-operator leasing. Higher granularity data underpins predictive maintenance, keeping leased cars on the road longer and boosting return on invested capital. Investors notice that fleets equipped with digital twins command a premium resale value, reinforcing the adoption loop.
Restraints Impact Analysis*
| Restraint | (~) % Impact on CAGR Forecast | Geographic Relevance | Impact Timeline |
|---|---|---|---|
| Fragmented Data and Communications Standards | -1.6% | Cross-border operations worldwide | Medium term (2-4 years) |
| Rail-Cybersecurity Vulnerabilities and Liability Risk | -1.1% | Developed markets under strict oversight | Short term (≤ 2 years) |
| Scarcity of Track-Side Power and Backhaul in Rural Lines | -0.8% | Remote regions globally | Long term (≥ 4 years) |
| High Retrofit CAPEX for Legacy Rolling Stock | -0.7% | Mature networks with ageing assets | Medium term (2-4 years) |
| Source: Mordor Intelligence | |||
Fragmented Data and Communications Standards
The migration from GSM-R to the Future Railway Mobile Communication System (FRMCS) runs on uneven timetables, forcing telematics suppliers to support multiple stacks in parallel [3]“FRMCS Technical Brief,” International Union of Railways, uic.org. North America experiments with IEEE 802.16t for private 5G rail, which is incompatible with European rollouts, raising integration overhead for global operators. Differing data dictionaries mean identical temperature readings often arrive in dissimilar formats, slowing dashboard consolidation. Freight cars crossing borders can lose connectivity or shift to fall-back modes that lack advanced analytics hooks. Until multilateral bodies agree on interface conformity, operators will carry extra cost buffers that dampen the overall railway telematics market CAGR.
Rail-Cybersecurity Vulnerabilities and Liability Risk
Rail-related cyber incidents grew 220% in the past five years, outpacing aviation and maritime threats. Modern signaling merges operational and IT networks, exposing attack vectors that age-old rail standards never anticipated. Insurance premiums for lines running digital-only control systems rose markedly, squeezing budgets for new telematics projects. Operators struggle to apportion liability when sensors, gateways, and cloud hosts all contribute to the risk chain. While standards bodies race to certify secure architectures, procurement pauses can delay multi-year expansions, temporarily cooling demand in the railway telematics market.
*Our forecasts treat driver/restraint impacts as directional, not additive. The impact forecasts reflect baseline growth, mix effects, and variable interactions.
Segment Analysis
By Solution: Fleet Management Dominates Operational Efficiency
Fleet management solutions generated 41.33% of 2024 revenue as railroads prioritized real-time wagon location, health, and idle-time reduction. Robust dashboards turn raw GPS and sensor signals into dispatch actions that compress cycle time and cut fuel burn, reinforcing their status as core modules within any railway telematics market deployment. Remote data access ranks as the fastest mover, growing at 8.46% CAGR as cloud APIs let planners mine historic and live data side by side. Automatic stock control and tracking platforms occupy the middle ground, feeding structured events into enterprise resource systems to align rail flows with wider supply-chain nodes.
The shift toward integrated cloud microservices blurs legacy categorical lines, prompting vendors to embed inventory logic inside fleet tools and fold basic tracking into higher value analytics bundles. Niche solutions such as energy optimization find receptive users among electrified passenger networks striving for ESG metrics. Together, these trends propel the railway telematics market toward full-stack, subscription-based ecosystems that reward vendors with continuous revenue and operators with evergreen functionality.


By Railcar Type: Tank Cars Lead Specialized Transport
Tank cars carried 33.15% of 2024 revenue because hazardous liquids demand certified monitoring of temperature, pressure, and shock events to satisfy stringent regulatory audits. Their higher revenue per unit justifies investment in multi-channel sensor clusters and redundant communications paths. Refrigerated boxcars chart the quickest ascent, expanding 9.24% per year as global cold-chain demand for food and pharmaceuticals accelerates. Operators fit these cars with precise temperature probes and door-open alerts to maintain compliance with health codes.
Hoppers and well cars seize value from moisture and load-distribution sensors that improve commodity throughput by notifying terminals of empty arrival. Specialized wagons round out the segment by serving automotive, timber, and heavy machinery flows, each with bespoke telematics payloads. Variations in regulatory exposure, cargo value, and trip length dictate differing sensor densities, propelling a rich design space that sustains supplier innovation and underpins growth across the broader railway telematics market.
By Component: TCUs Anchor System Architecture
Telematics control units captured 49.21% of 2024 spending because they orchestrate data acquisition, edge processing, and backhaul selection in a single ruggedized box. Rugged TCUs now include integrated gateways that can hop between cellular, satellite, and LP-WAN links without human intervention, boosting uptime. Multi-function sensors follow as the fastest component, compounding at 8.16% as unit cost drops and packaging densifies.
Energy-harvesting add-ons leverage vibration and solar inputs to extend battery life beyond five years, eliminating routine service stops. Edge-analytics modules crunch vibration signatures locally to flag bear faults, slicing terabytes from cellular bills. Cloud software completes the stack, furnishing fleet-wide views that trigger maintenance work orders inside enterprise asset systems. Collectively, these advances keep the railway telematics market size growing on the back of modular, interoperable hardware aligned with continuous software updates.
By Connectivity Technology: Cellular Dominance Faces Hybrid Challenge
Cellular 4G and 5G links generated 57.66% of 2024 revenue because towers already blanket many freight corridors, and passengers expect broadband-grade service. Private LTE licenses let operators reserve channels for mission-critical voice and data, insulating trains from consumer congestion. Hybrid and LP-WAN connections take the growth crown with 10.12% CAGR, marrying low data-rate health pings to satellite for hard-to-reach stretches.
Global trials of FRMCS show capacity gains over GSM-R that accommodate looming sensor traffic without fresh spectrum auctions. Low-orbit satellites extend coverage to Arctic mines and desert ports, pulling geographically isolated routes into the digital fold. These blended architectures trim life-cycle connectivity cost, a decisive factor for rolling stocks earmarked for thirty-year service lives and a key driver for the railway telematics market.
By Application: Freight Operations Drive Market Growth
Freight operations produced an 83.11% revenue share in 2024 because asset utilization, dwell time, and safety incidents directly influence bottom lines. Sensors capture vibration, load, and temperature states that feed AI models predicting component failure well before catastrophic events. Real-time location pairs with yard-management software to cut terminal congestion and improve locomotive throughput.
Passenger services will expand at 9.14% CAGR on the back of urbanization and green-mobility agendas. Telematics enable punctuality, crowd management, and energy savings through coasting and regenerative braking analytics. Convergence occurs where mixed freight and commuter lines share infrastructure, pushing suppliers to craft platforms that reconcile divergent latency and safety requirements yet run on common data fabrics. These dual needs broaden addressable demand, ensuring the railway telematics market continues its robust climb.
Geography Analysis
North America held a 39.56% revenue share in 2024, reflecting decades of freight dominance, private capital outlays, and a regulatory push for cyber-secure operations. The Association of American Railroads invested USD 110 million in communications upgrades, anchoring nationwide commitment to interoperable platforms. The RailPulse consortium pools data from competing railroads to create a unified telematics layer, eliminating duplicative spend while advancing analytics sophistication.
Asia-Pacific records the fastest 8.71% CAGR to 2030 as mega-projects reshape demand. China’s Belt and Road corridors integrate telematics during construction, skipping legacy stages and embedding 5G, satellite, and edge nodes from day one. India’s Kavach automatic protection program stretches across 10,000 kilometers, positioning domestic firms to commercialize safety tech for export. Hong Kong’s AI-powered maintenance platform is estimated to save USD 65 billion over five years, exemplifying the leapfrog mentality that narrows the digital gap with mature markets.
Europe remains a mature but dynamic arena where ERTMS and the move to FRMCS drive uniform procurement across borders. Germany’s Digital Rail initiative funnels multi-billion euro sums into cloud-first control centers, while Norway’s nationwide re-signaling project underscores Nordic resolve to retire analog assets. The Middle East and Africa launch greenfield lines worth USD 642 billion, often specifying telematics from the tender stage to guarantee international service levels. South America, led by Brazil, plans new freight axes and metro refurbishments that require certified tracking and monitoring as funding milestones.

Competitive Landscape
Industry structure shows moderate consolidation, with the top five vendors accounting for a major share. Hitachi Rail’s EUR 1,660 million purchase of Thales Ground Transportation Systems unites signaling, cybersecurity, and analytics strengths under one roof. Wabtec’s EUR 675 million acquisition of Frauscher Sensor Technology injects high-precision wheel-detection into its Digital Intelligence division, broadening the hardware-to-cloud continuum. These maneuvers illustrate how incumbents secure growth by absorbing niche innovators rather than building from scratch.
Competition pivots on AI accuracy, open APIs, and third-party certification for both safety and cyber compliance. New entrants leverage cloud-native stacks to deliver feature releases monthly instead of annually, wooing operators that prize agility. Collaborative ventures such as RailPulse level the playing field by standardizing data, enabling smaller sensor firms to scale without proprietary lock-in.
White-space remains in quantum-secure communication, dynamic network slicing, and embedded emissions tracking. Vendors able to fuse these capabilities into a single subscription will capture premium margins as railroads transition from buying devices to buying outcomes. The railway telematics market thus rewards breadth of portfolio and depth of analytics talent in equal measure.
Railway Telematics Industry Leaders
Siemens AG
Wabtec Corporation
Hitachi Rail
Alstom SA
Knorr-Bremse AG
- *Disclaimer: Major Players sorted in no particular order

Recent Industry Developments
- July 2025: Wabtec acquired Frauscher Sensor Technology Group for EUR 675 million, boosting its rail signaling footprint across Europe and India.
- November 2024: Siemens Mobility and Bane NOR activated ERTMS on Norway’s Gjøvik Line North, the first in the country to run the latest standard.
- September 2024: RailPulse unveiled its open technology infrastructure, enabling real-time railcar visibility across North America’s freight fleet.
- July 2024: CSX joined the RailPulse coalition, expanding sensor standardization across additional Class I railroads.


Global Railway Telematics Market Report Scope
| Fleet Management |
| Automatic Stock Control |
| Remote Data Access |
| Railcar Tracking and Tracing |
| Other Niche Solutions |
| Hoppers |
| Tank Cars |
| Well Cars |
| Boxcars |
| Refrigerated Boxcars |
| Specialized Wagons |
| Telematics Control Units (TCU) |
| Multi-function Sensors |
| Gateways and Edge Analytics Modules |
| Power and Energy-Harvesting Systems |
| Cloud and Platform Software |
| Cellular (4G/5G) |
| Satellite |
| Hybrid and LP-WAN |
| Freight Operations |
| Passenger Services |
| North America | United States |
| Canada | |
| Rest of North America | |
| South America | Brazil |
| Argentina | |
| Rest of South America | |
| Europe | Germany |
| France | |
| United Kingdom | |
| Italy | |
| Spain | |
| Rest of Europe | |
| Asia-Pacific | China |
| Japan | |
| South Korea | |
| India | |
| Rest of Asia-Pacific | |
| Middle East and Africa | South Africa |
| United Arab Emirates | |
| Saudi Arabia | |
| Rest of Middle East and Africa |
| By Solution | Fleet Management | |
| Automatic Stock Control | ||
| Remote Data Access | ||
| Railcar Tracking and Tracing | ||
| Other Niche Solutions | ||
| By Railcar Type | Hoppers | |
| Tank Cars | ||
| Well Cars | ||
| Boxcars | ||
| Refrigerated Boxcars | ||
| Specialized Wagons | ||
| By Component | Telematics Control Units (TCU) | |
| Multi-function Sensors | ||
| Gateways and Edge Analytics Modules | ||
| Power and Energy-Harvesting Systems | ||
| Cloud and Platform Software | ||
| By Connectivity Technology | Cellular (4G/5G) | |
| Satellite | ||
| Hybrid and LP-WAN | ||
| By Application | Freight Operations | |
| Passenger Services | ||
| By Geography | North America | United States |
| Canada | ||
| Rest of North America | ||
| South America | Brazil | |
| Argentina | ||
| Rest of South America | ||
| Europe | Germany | |
| France | ||
| United Kingdom | ||
| Italy | ||
| Spain | ||
| Rest of Europe | ||
| Asia-Pacific | China | |
| Japan | ||
| South Korea | ||
| India | ||
| Rest of Asia-Pacific | ||
| Middle East and Africa | South Africa | |
| United Arab Emirates | ||
| Saudi Arabia | ||
| Rest of Middle East and Africa | ||


Key Questions Answered in the Report
What is the current value of the railway telematics market?
The railway telematics market size is USD 6.94 billion in 2025 and is on track to reach USD 10.02 billion by 2030.
Which solution category holds the largest revenue share today?
Fleet management solutions lead with 41.33% of 2024 revenue because they directly improve asset utilization and reduce idle time.
What connectivity technologies are rail operators adopting most?
Cellular 4G/5G remains dominant with 57.66% share, but hybrid and LP-WAN links are expanding fastest at a 10.12% CAGR.
Which region is expected to grow fastest through 2030?
Asia-Pacific leads with an 8.71% CAGR thanks to China’s Belt and Road corridors and India’s large-scale automatic protection projects.
Page last updated on:


