Pyrogen Testing Market Size and Share
Market Overview
| Study Period | 2020 - 2031 |
|---|---|
| Market Size (2026) | USD 1.73 Billion |
| Market Size (2031) | USD 2.99 Billion |
| Growth Rate (2026 - 2031) | 11.51% CAGR |
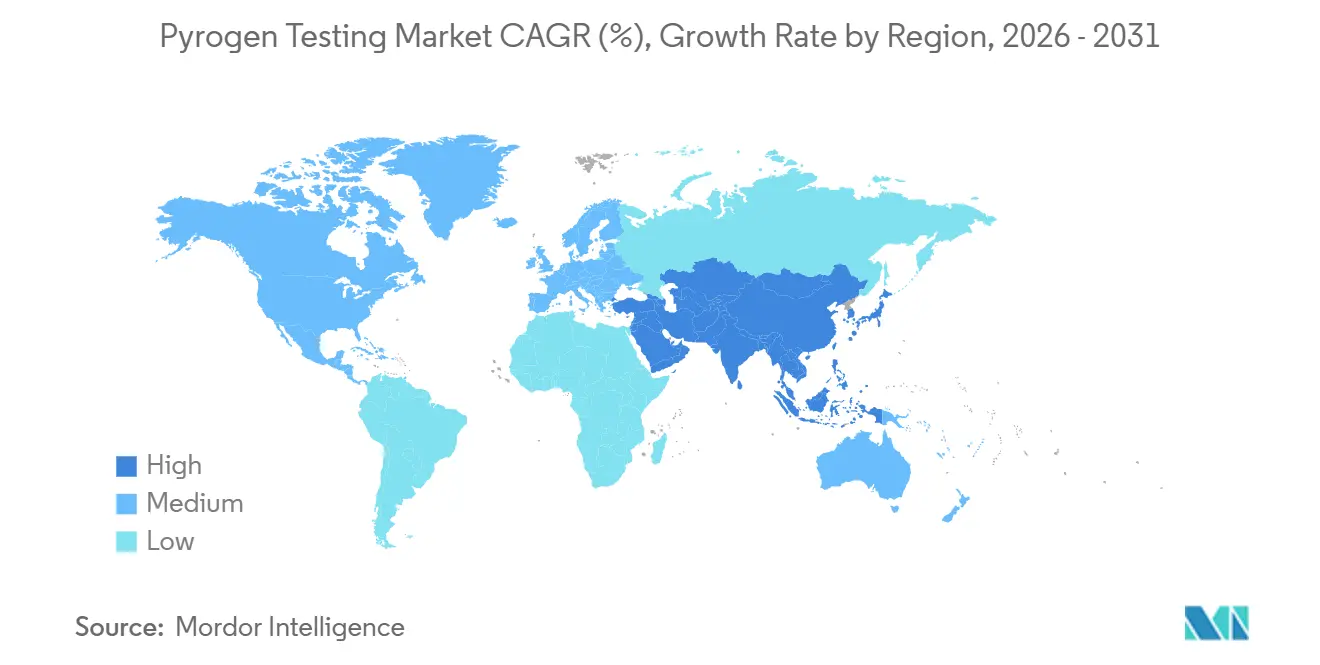
| Fastest Growing Market | Asia Pacific |
| Largest Market | North America |
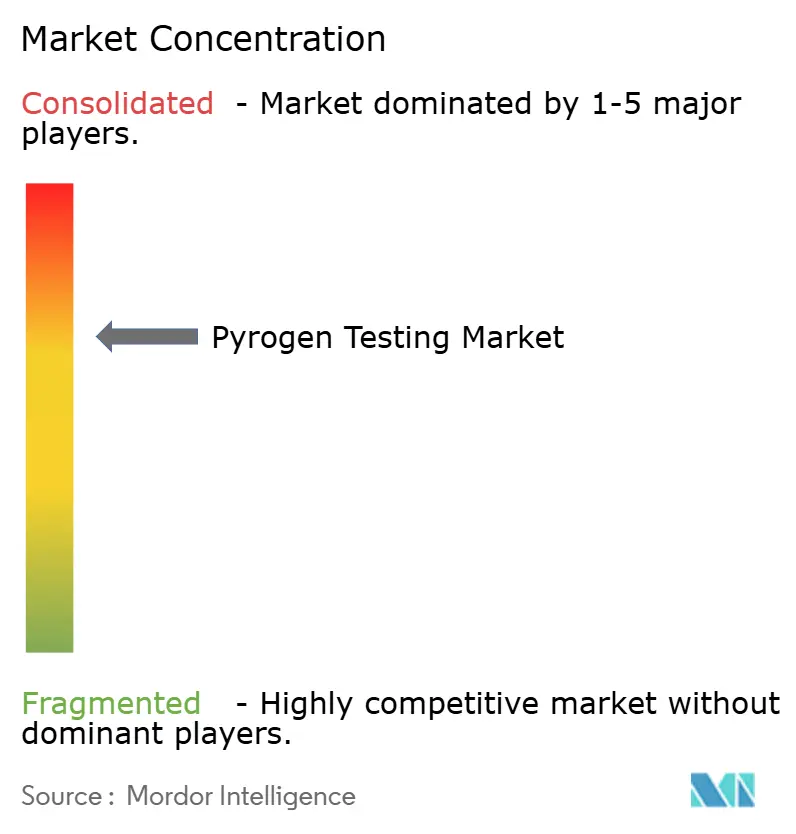
| Market Concentration | Medium |
Major Players
*Disclaimer: Major Players sorted in no particular order Image © Mordor Intelligence. Reuse requires attribution under CC BY 4.0. |
|
Pyrogen Testing Market Analysis by Mordor Intelligence
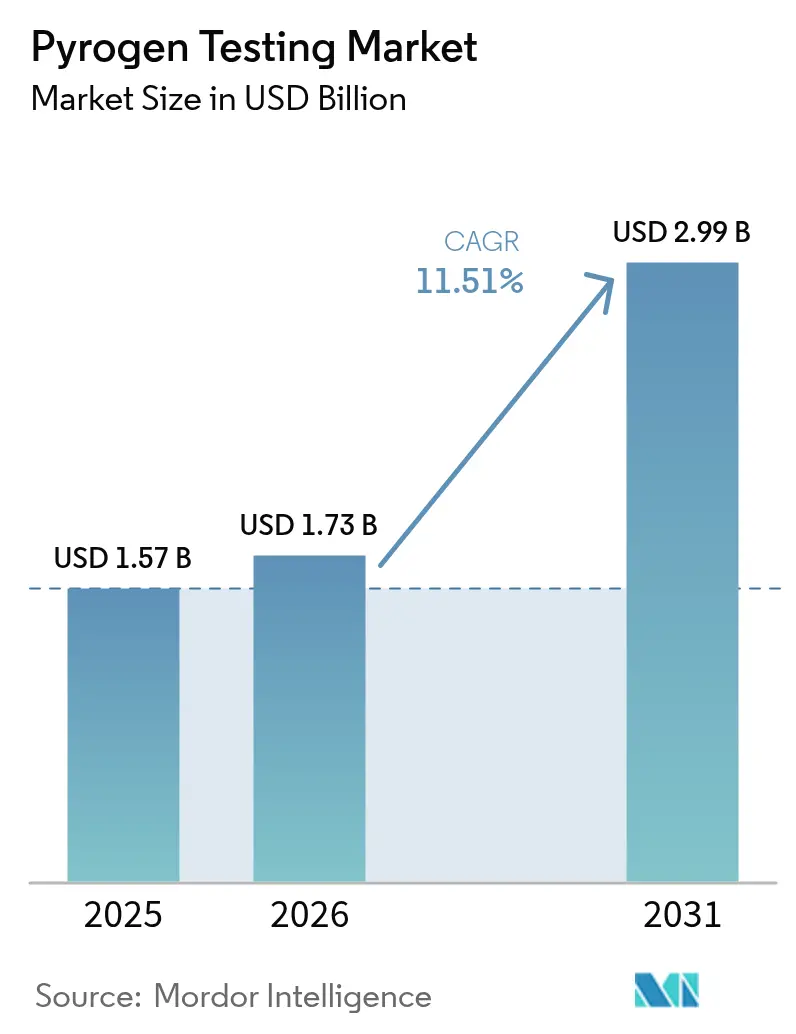
The Pyrogen Testing Market size is expected to grow from USD 1.57 billion in 2025 to USD 1.73 billion in 2026 and is forecast to reach USD 2.99 billion by 2031 at 11.51% CAGR over 2026-2031.
Growth is anchored in simultaneous United States Pharmacopeia and European Pharmacopoeia revisions that legitimize recombinant Factor C (rFC) and the Monocyte Activation Test (MAT), while eliminating the rabbit-pyrogen method in Europe. Cell-based and recombinant platforms are gaining momentum as biopharma firms pursue animal-free, supply-secure options, and global approvals of injectable biologics continue to rise. Automation-ready microfluidic analyzers are shortening turnaround times from 24 hours to less than four, supporting high-throughput lot release. Regional diversification of contract development and manufacturing organizations (CDMOs) further amplifies demand as outsourcing spreads across North America, Europe, India, and China. Headline risks include episodic horseshoe-crab lysate shortages, low endotoxin recovery (LER) events in surfactant-rich formulations, and the high validation cost SMEs face when converting to MAT or rFC platforms.
Key Report Takeaways
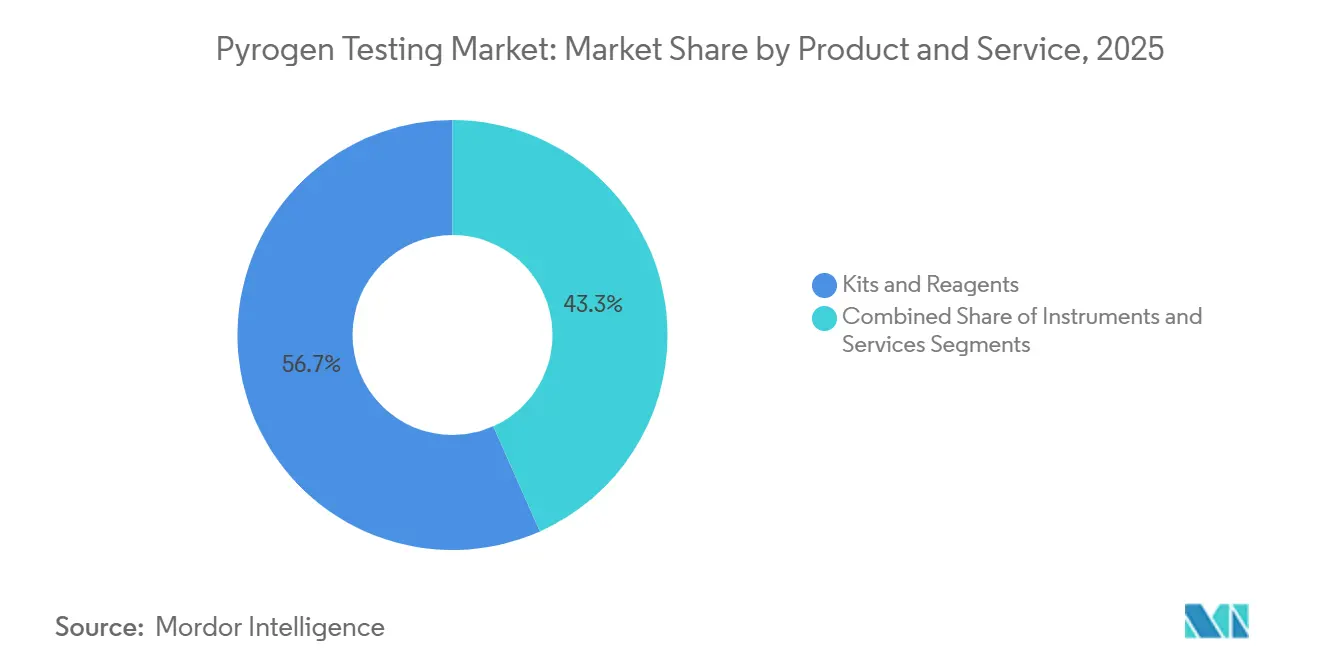
- By product & service, kits and reagents accounted for 56.67% of the pyrogen testing market share in 2025 and instruments are expected to grow at a 13.62% CAGR through 2031.
- By detection technology, animal-based assays commanded 72.52% of revenue in 2025 and recombinant and cell-based methods are on track for a 14.77% CAGR to 2031.
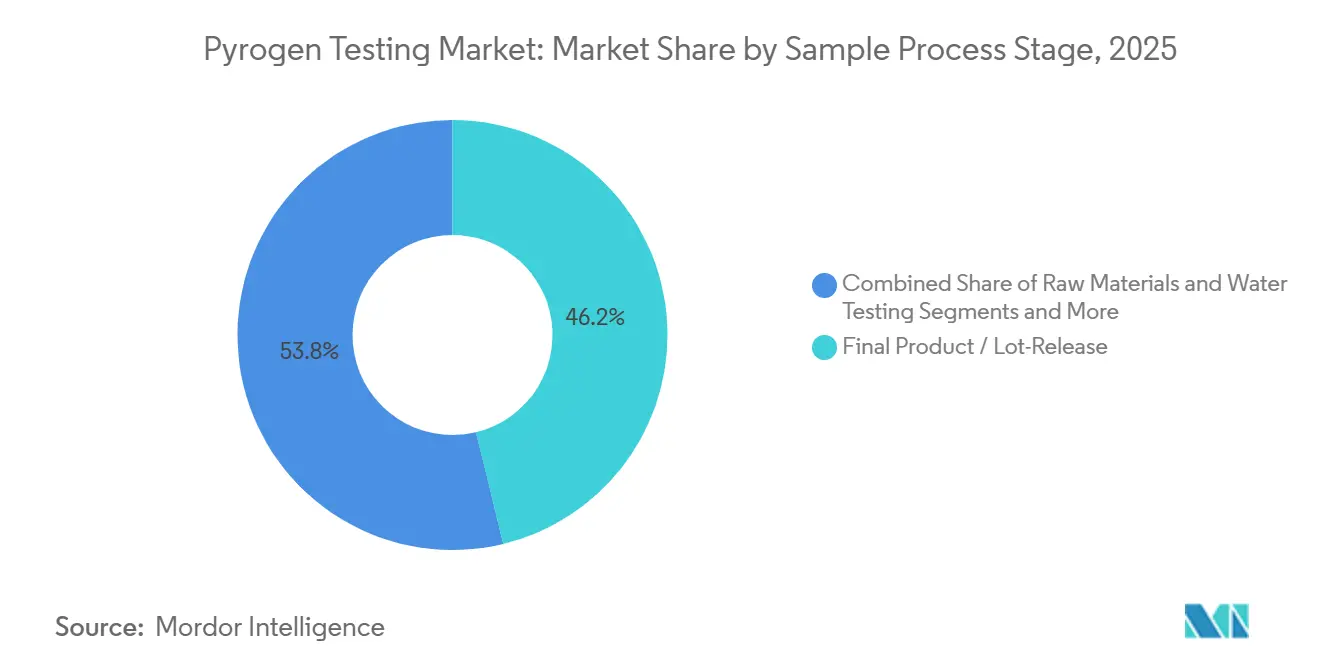
- By sample stage, final product and lot-release testing represented 46.21% of revenue in 2025 and in-process testing is projected to rise at a 14.24% CAGR over the same horizon.
- By test type, LAL tests held 53.14% of revenue in 2025 and the Monocyte Activation Test is forecast to register a 15.72% CAGR to 2031.
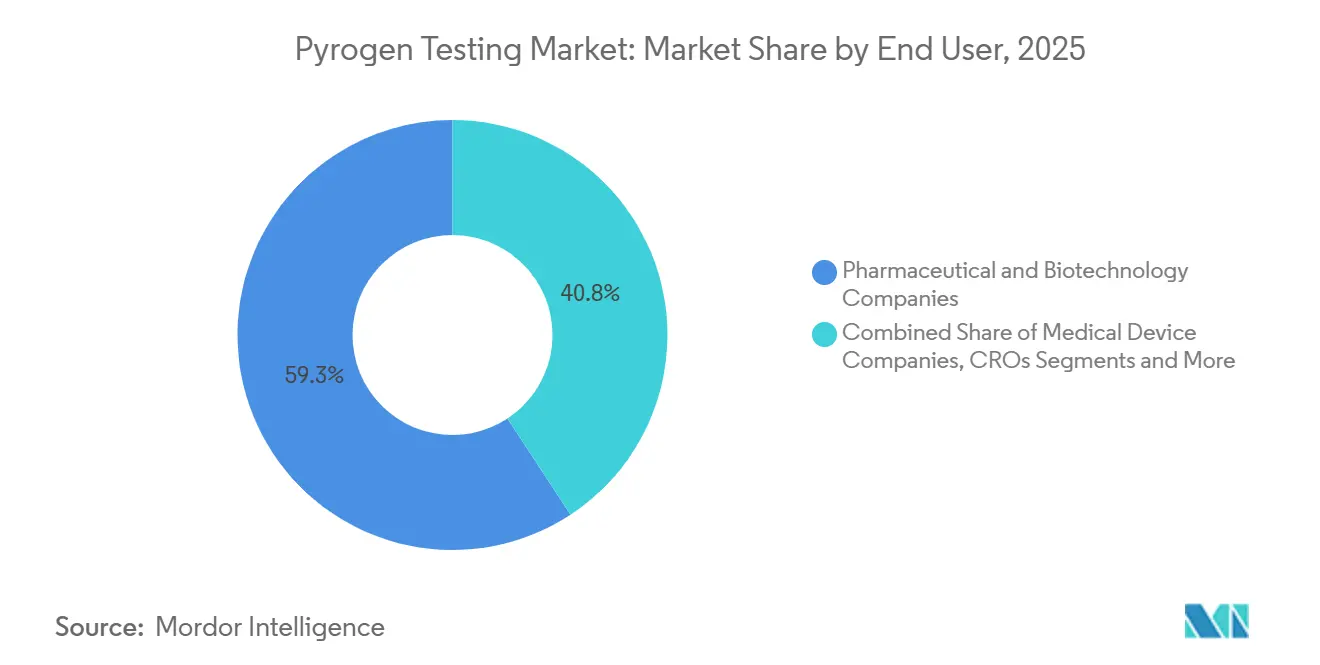
- By end user, pharmaceutical and biotechnology companies generated 59.25% of revenue in 2025 and medical device manufacturers are poised for a 13.44% CAGR through 2031.
- By geography, North America delivered 39.14% of revenue in 2025 and Asia-Pacific is predicted to post a 13.63% CAGR to 2031.
Note: Market size and forecast figures in this report are generated using Mordor Intelligence’s proprietary estimation framework, updated with the latest available data and insights as of 2026.
Global Pyrogen Testing Market Trends and Insights
Drivers Impact Analysis*
| Driver | (~) % Impact on CAGR Forecast | Geographic Relevance | Impact Timeline |
|---|---|---|---|
| Biologics & vaccine pipeline expansion | +2.3% | North America, Europe, China | Long term (≥ 4 years) |
| Endotoxin limits in revised USP <85>/Ph. Eur. 2.6.14 | +2.1% | North America, Europe | Short term (≤ 2 years) |
| Outsourcing to CROs & CDMOs | +1.8% | Global, fastest in India and China | Medium term (2-4 years) |
| Automation-ready microfluidic analyzers | +1.6% | North America, Europe, Japan | Medium term (2-4 years) |
| EU phase-out of rabbit tests | +1.9% | Europe, spill-over to North America and APAC | Short term (≤ 2 years) |
| Chinese rFC cost advantages | +1.4% | APAC core, spill-over Middle East & Africa | Medium term (2-4 years) |
| Source: Mordor Intelligence | |||
Biologics & Vaccine Pipeline Expansion
Global regulators cleared 46 novel drugs and 18 biosimilars in 2025, nearly all parenteral, enlarging quality-control sample volumes at every bioprocess stage.[1]U.S. Food and Drug Administration, “CDER Novel Drug Approvals 2025,” FDA, fda.gov Multiple COVID-19 strain-updated mRNA vaccines incorporated new fill-finish lines that demanded fresh component qualifications. Each monoclonal antibody or viral-vector therapy must meet strict ±0.05 EU/mL limits for upstream harvest, downstream pools, and final vials, driving recurring pyrogen testing market demand. Large-scale capital projects by Eli Lilly, AstraZeneca, and Johnson & Johnson are adding sterile capacity that will begin generating validation batches in 2027, locking in sustained testing volumes. Emerging-market producers seeking mutual recognition with ICH jurisdictions are similarly upgrading QC infrastructures, broadening the global footprint of the pyrogen testing market.
Mandatory Endotoxin Limits in New USP 85 and Ph. Eur. 2.6.14
USP’s July 2025 update formally recognizes rFC as equivalent to LAL once equivalence is proven, enabling method substitution without full dossier revalidation. Revision Recognizes Recombinant Factor C,” USP, usp.org">[2]United States Pharmacopeia, “USP Chapter <1085> Revision Recognizes Recombinant Factor C,” USP, usp.org In parallel, Europe’s deletion of the rabbit-pyrogen method effective July 2025 compels immediate MAT adoption for products headed to the EU.[3]European Directorate for the Quality of Medicines & HealthCare, “European Pharmacopoeia Deletes Rabbit Pyrogen Test,” EDQM, edqm.eu These harmonized policies eliminate historical ambiguity that held back recombinant and cell-based platforms and compress compliance timelines for legacy products. Reagent makers have responded with next-generation MAT kits offering 0.05 EU/mL sensitivity, aligning with new pharmacopeial thresholds. Collectively, the rule changes strengthen the regulatory foundation of the pyrogen testing market.
Outsourcing to CROs & CDMOs
Global sponsors are migrating lot-release testing to contract labs to trim fixed costs and leverage specialized talent. Charles River’s 2024 addition of gene-therapy endotoxin services and Thermo Fisher’s GMP laboratory expansion in Wisconsin exemplify capacity scaling. Outsourcing also spreads adoption of fully automated analyzers that smaller biotech firms could not justify in-house, helping to enlarge both service and equipment sub-segments of the pyrogen testing market.
Automation-Ready Microfluidic Analyzers
bioMérieux’s ENDONEXT system processes 120 samples per hour with 95% automation, slashing hands-on time and error rates. Cartridge-based designs from Merck remove reagent preparation steps and permit in-suite testing in fill-finish areas. Integration with LIMS satisfies 21 CFR Part 11, reinforcing data-integrity compliance. The throughput and compliance benefits position automated analyzers as the fastest-growing hardware niche within the broader pyrogen testing market.
Restraints Impact Analysis*
| Restraint | (~) % Impact on CAGR Forecast | Geographic Relevance | Impact Timeline |
|---|---|---|---|
| High validation cost for MAT & rFC at SMEs | -0.8% | Emerging markets, small biotech hubs | Medium term (2-4 years) |
| Horseshoe-crab harvest limits tightening LAL supply | -0.9% | North America, Europe | Short term (≤ 2 years) |
| Persistent Low Endotoxin Recovery (LER) events | -0.6% | Biosimilar-heavy portfolios worldwide | Medium term (2-4 years) |
| Divergent data-integrity rules complicate automation ROI | -0.5% | Multinational labs in China, India, and highly regulated markets | Long term (≥ 4 years) |
| Source: Mordor Intelligence | |||
High Validation Cost for SMEs
Adapting a single biologic line to MAT or rFC can exceed USD 500,000 in qualification and documentation spend, a burden that smaller firms often absorb by outsourcing rather than capitalizing new labs. The cost headwind slows the pyrogen testing market transition in emerging regions where access to low-cost validation support remains limited.
Horseshoe-Crab Harvest Restrictions
The Atlantic States Marine Fisheries Commission caps annual harvests at 500,000–700,000 crabs, and 15%–30% bleed mortality creates episodic supply squeezes. Resulting lysate price spikes push users toward rFC yet simultaneously threaten real-time production schedules for manufacturers unable to re-validate quickly—adding volatility to the pyrogen testing market.
*Our forecasts treat driver/restraint impacts as directional, not additive. The impact forecasts reflect baseline growth, mix effects, and variable interactions.
Segment Analysis
By Product & Service: Instruments Drive the Next Wave of Expansion
Kits and reagents supplied 56.67% of 2025 revenue, underscoring the razor-and-blade model that anchors the pyrogen testing market size for consumables. However, instruments are poised for a 13.62% CAGR through 2031 as manufacturers install microfluidic systems to combat labor shortages and compress release timelines. Automated readers integrate seamlessly with LIMS, satisfying data-integrity expectations and supporting continuous bioprocessing workflows. Proprietary cartridges ensure recurring revenue, reinforcing supplier lock-in. Services—chiefly CRO lot-release testing—remain attractive to early-stage biotech clients that lack in-house QC, funneling incremental volumes into the pyrogen testing market.
Labor availability and audit-trail scrutiny accelerate capital outlays for fully integrated analyzers, exemplified by Merck’s cartridge-based platform that allows non-specialists to test directly in fill-finish suites. While consumables will continue as the largest revenue pool, hardware adoption raises average selling prices and broadens the pyrogen testing market share of high-margin instrument vendors.


By Detection Technology: Recombinant and Cell-Based Methods Gain Ground
Animal-based assays held 72.52 % of the 2025 pyrogen testing market share, yet recombinant Factor C and MAT platforms are forecast to post a 14.77 % CAGR through 2031. USP Chapter <1085>, effective February 2026, now allows rFC substitution once equivalence is proven, removing the last major barrier to animal-free methods. Europe’s deletion of the rabbit test mandates MAT for all new and legacy products shipped into the EU, compressing timelines for cell-based validation.
Chinese suppliers sell rFC kits 30–40 % below Western LAL prices, widening adoption across APAC facilities and increasing the pyrogen testing market size for recombinant solutions. LAL retains primacy in legacy BLAs but faces episodic supply shocks whenever horseshoe-crab quotas tighten. Rapid cartridge devices now deliver quantitative results in 30 minutes, demonstrating that speed and regulatory clarity together are tipping the technology mix away from animal lysate.
By Sample / Process Stage: In-Process Testing Surges With Continuous Bioprocessing
Final product and lot-release represented 46.21 % of 2025 revenue, underscoring its centrality to batch disposition. However, in-process testing is poised to climb at a 14.24 % CAGR through 2031 as multi-column chromatography and perfusion reactors multiply sample nodes per batch, enlarging the pyrogen testing market size tied to upstream and downstream pools. Automated readers that handle 120 samples per hour enable real-time monitoring rather than end-of-run confirmation, aligning with quality-by-design principles.
Raw-material screening is expanding as single-use bag and tubing vendors must certify low endotoxin loads before shipment. ISO 10993-1:2025 highlights pyrogenicity as a systemic biological hazard, prompting device and biologic makers alike to adopt earlier checkpoints. Medical-device rinse tests remain the smallest slice but are climbing as newer implant standards tighten acceptable endotoxin limits. Overall, migration toward in-process sampling elevates testing volumes well before the final vial stage.
By Test Type: MAT Leads Growth, LAL Holds Legacy Ground
LAL delivered 53.14 % of 2025 revenue and remains deeply embedded in historical submissions. Yet MAT is forecast to grow 15.72 % annually, the fastest rate in the segment, after Europe’s rabbit-test ban took effect in July 2025. MilliporeSigma’s PyroMAT kit achieves 0.05 EU/mL sensitivity, satisfying new pharmacopeial thresholds and assuring broad pyrogen coverage.
Recombinant Factor C adoption accelerates where price and ethical considerations converge, especially in APAC. Conversely, rabbit assays shrink everywhere except markets without explicit prohibitions, but even there, ethical scrutiny is mounting. Together, these shifts reallocate the pyrogen testing market share toward animal-free platforms while leaving LAL as a declining yet significant baseline.
By End User: Pharma & Biotech Dominate, Medical Devices Accelerate
Pharmaceutical and biotechnology companies generated 59.25 % of 2025 revenue, anchored by monoclonal antibodies, mRNA vaccines, and viral vectors that drive high-frequency lot release. Medical-device manufacturers are projected to record a 13.44 % CAGR through 2031, propelled by ISO 10993 revisions that impose stricter systemic-toxicity and pyrogenicity controls.
CROs and CDMOs scale capacity fastest because outsourcing trims fixed costs for smaller sponsors. Charles River’s 2024 viral-vector testing acquisition broadened its endotoxin service portfolio, reinforcing the trend toward specialized third-party quality-control hubs. Academic labs hold a minor share but gain volume from government-funded vaccine research that now requires GMP-level documentation. Collectively, pharma and biotech remain the volume anchors, while device firms inject fresh momentum into growth.
Geography Analysis
North America held 39.14% of 2025 revenue, buoyed by the United States’ dense biopharma pipeline and frequent parenteral approvals. USP’s formal rFC recognition will likely catalyze method substitutions, enlarging the region’s software-integration and equipment opportunities. Canada and Mexico show steady growth as near-shoring of sterile fill-finish expands.
Europe follows as the second-largest region. The July 2025 rabbit-test sunset forces continent-wide MAT adoption, triggering equipment and kit purchases. Germany, the United Kingdom, and France continue to anchor demand, while Eastern Europe gains share through biosimilar outsourcing.
Asia-Pacific is projected to lead growth at 13.63% CAGR through 2031, fueled by China’s domestic rFC capacity and India’s rising sterile-drug export ambitions. Japan and South Korea complement the regional picture with automation upgrades to offset aging technical workforces. The Middle East and Africa plus South America remain nascent but attractive targets as multinational firms and local governments collaborate on GMP facility build-outs, planting future seeds for the pyrogen testing market.

Regulatory Landscape
Pyrogen and endotoxin testing in parenteral drugs, biologics, vaccines, and high-risk medical devices is governed by pharmacopeial standards and regulator expectations, with a growing shift toward animal-free methods. In the United States, FDA issued an updated "Pyrogen and Endotoxins Testing: Questions and Answers" guidance (Edition 2) in March 2026, reinforcing expectations around appropriate method selection, validation, and lifecycle control for USP-aligned testing (including endotoxin and broader pyrogen considerations) across drugs, biologics, and devices.
Europe has moved faster on animal replacement. Following the European Pharmacopoeia shift away from the rabbit pyrogen test, the Ph. Eur. framework now centers on in vitro alternatives such as the Monocyte Activation Test (MAT) as an animal-free route for pyrogen detection, and it integrates recombinant options for bacterial endotoxins testing (for example, rFC under Ph. Eur. general chapter 2.6.14). EDQM also progressed implementation into control systems, including removal of rabbit pyrogen test references from revised EU Official Control Authority Batch Release (OCABR) guidelines in July 2026, tightening compliance timelines for EU supply chains and for exporters serving EU destinations.
Value Chain Analysis
The value chain starts with upstream inputs for test execution: lysate (LAL) supply tied to horseshoe-crab harvesting constraints, recombinant reagents (rFC or recombinant cascade reagents), and cellular and immunoassay components for MAT (human monocyte cell lines or human blood-derived components plus ELISA reagents for cytokine readouts). These inputs feed kit and cartridge manufacturers, as well as instrument and automation providers that support higher-throughput endotoxin and pyrogen workflows and electronic records compatible with regulated QC environments.
Midstream, pharmaceutical and biotechnology manufacturers and medical device producers conduct in-house QC for raw materials, in-process pools, and final lot release, while a growing share of method development, validation or verification, and routine lot-release is handled by CROs and CDMOs with specialized pyrogenicity capabilities. A key friction point is product-specific validation or verification, which becomes more complex when companies must satisfy both EU requirements that have eliminated rabbit pyrogen testing in monographs and US practice where MAT is positioned as an alternative method requiring robust application-specific support; this increases demand for standardized cellular reagents, protocol harmonization, and audit-ready data systems across multi-region supply chains.
Competitive Landscape
Competition is moderately fragmented. Legacy lysate suppliers—Associates of Cape Cod, Charles River, Lonza—compete on sensitivity and regulatory pedigree, while bioMérieux, Merck, and Sartorius aim to dominate the automation layer with analytics-ready hardware. Chinese newcomers ACROBiosystems and Hzymes Biotech leverage cost advantages to penetrate APAC and emerging markets, forcing incumbents to bundle consumables, software, and multi-year service agreements. Strategic M&A continues, highlighted by Charles River’s 2024 viral-vector testing acquisition that deepened its gene-therapy QC footprint. Vendors able to satisfy both FDA 21 CFR Part 11 and China’s T/CNHAW 0015-2025 electronic-record criteria are best positioned to win multi-site global contracts, underscoring compliance as a critical differentiator across the pyrogen testing market.
Pyrogen Testing Industry Leaders
-
Merck KGaA
-
Lonza Group
-
Charles River Laboratories International Inc.
-
Associates of Cape Cod Inc.
-
Thermo Fisher Scientific Inc.
- *Disclaimer: Major Players sorted in no particular order

Market Opportunities and Future Outlook
Pharmacopeial and regulator actions are expanding the commercial runway for animal-free and recombinant platforms, creating a multi-product opportunity across reagents, cartridges, instruments, and validation services. A concrete signal of multi-jurisdiction traction came in April 2026 when Associates of Cape Cod reported regulatory acceptance across seven jurisdictions (including the US FDA, Japan PMDA, and Access Consortium member markets) for Bayer's release testing use case with PyroSmart NextGen recombinant cascade reagent (rCR) for a contrast media API. The approval outcome supports the view that recombinant approaches can clear complex global filing pathways when the validation package is fit-for-purpose.
Another visible whitespace area is modernization of pyrogen testing beyond endotoxin, where standard setters are seeking supporting data for alternatives. USP initiated work toward an Expert Panel on Modern Alternatives to Pyrogen Testing and issued a call for submissions (February 2026) to evaluate non-animal in vitro approaches such as MAT, which increases the incentive for kit vendors and contract labs to build validated MAT workflows and for instrument suppliers to offer automation and compliant data capture. Against this backdrop, capacity additions for endotoxin and pyrogen testing inputs and higher-throughput QC (including expansions tied to endotoxin assay production) improve supply security and help reduce conversion barriers for manufacturers facing high internal validation costs.
Recent Industry Developments
- April 2026: Associates of Cape Cod announced that Bayer obtained approvals across seven jurisdictions for release testing of a contrast media API using its PyroSmart NextGen recombinant cascade reagent (rCR), including clearances involving the US FDA, Japan PMDA, and Access Consortium markets. The milestone strengthens the case for recombinant reagents as filing-ready alternatives where companies need consistent, animal-free supply for global product distribution.
- March 2026: The US FDA published an updated "Pyrogen and Endotoxins Testing: Questions and Answers" guidance (Edition 2), consolidating current expectations for endotoxin and pyrogen control across drugs, biologics, and devices. The update sharpens validation and documentation requirements, which supports investment in compliant automation, electronic records, and standardized method transfer across multi-site QC networks.
- September 2024: Lonza commenced an expansion of its endotoxin assay production facility in Walkersville, Maryland, including steps to integrate more automated manufacturing. Additional capacity at a major supplier helps address supply continuity needs as manufacturers increase testing volumes and diversify away from animal-derived inputs.


Research Methodology Framework and Report Scope
Market Definition and Coverage
For this study, the pyrogen testing market covers the revenue generated from tests, consumables, instruments, and outsourced testing services used to detect pyrogens and endotoxins in sterile injectables, biologics, vaccines, and high-risk medical devices, where patient safety and release testing drive routine demand.
Scope exclusions: We exclude routine sterility testing and endotoxin assays done for food, general environmental monitoring, or non-medical industrial quality checks.
Segmentation Overview
-
By Product & Service
- Kits & Reagents
- Instruments
- Services
-
By Detection Technology
- Animal-Based Tests
- Recombinant / Cell-Based Tests
- Instrument-Integrated Rapid Systems
-
By Sample / Process Stage
- Raw Materials & Water Testing
- In-Process (Upstream & Downstream)
- Final Product / Lot-Release
- Medical Device Surface & Rinse Tests
-
By Test Type
- Limulus Amebocyte Lysate (LAL) Tests
- Recombinant Factor C (rFC) Assays
- Monocyte Activation Test (MAT)
- Rabbit Pyrogen Test
-
By End User
- Pharmaceutical & Biotechnology Companies
- Medical Device Companies
- Contract Research Organizations (CROs)
- Academic & Research Institutes
-
By Geography
-
North America
- United States
- Canada
- Mexico
-
Europe
- Germany
- France
- United Kingdom
- Italy
- Spain
- Rest of Europe
-
Asia-Pacific
- China
- Japan
- India
- South Korea
- Australia
- Rest of Asia-Pacific
-
Middle East & Africa
- GCC
- South Africa
- Rest of Middle East & Africa
-
South America
- Brazil
- Argentina
- Rest of South America
-
North America
Data Sources, Market Sizing, and Validation
Desk Research
Desk work starts with building the demand context for parenteral and biologics production, and then tying it to where pyrogen and endotoxin tests are required. We reference public standards and guidance (such as pharmacopeial methods and updates), along with open regulatory sources and recall databases, to understand what triggers testing frequency and method shifts.
We also use supporting datasets such as government trade statistics for relevant laboratory reagents and instruments, publicly available customs and import-export releases, peer reviewed journal articles on LAL, rFC, and MAT adoption, and association or standards-body publications that describe testing expectations. Company filings, investor presentations, and credible press are used to confirm product coverage, typical customer profiles, and geographic exposure. Where available, we also consult paid subscriptions for company financials and intelligence, patent databases, and shipment-level trade records to cross-check directional trends. These sources are illustrative only, and other public materials were reviewed to collect, validate, and clarify inputs.
Primary Interviews and Surveys
Primary work is used to pressure-test model assumptions that desk sources cannot explain well, including how often tests are run across lot release versus in-process steps, and how quickly alternative methods are replacing legacy approaches. We spoke with a mix of kit and reagent suppliers, instrument stakeholders, and service providers, and we kept the discussions balanced across Americas, EMEA, and APAC to avoid missing regional regulatory and manufacturing differences.
Distribution of primary research fieldwork respondents
| Company type | Respondent position | Region |
|---|---|---|
| Top tier: 30% | CXOs: 20% | APAC: 46% |
| Mid tier: 49% | Functional/Unit leaders: 23% | EMEA: 31% |
| Smaller Players: 21% | Managers: 57% | Americas: 23% |
Market-Sizing & Forecasting
Sizing is built using a top-down approach where the parenteral and biologics manufacturing base is reconstructed by region, and then converted into a test-demand pool using usage rates that were checked in interviews. From there, the value is formed by applying a practical price ladder across kits and reagents, instruments, and outsourced services, and then translating it into USD using consistent timing assumptions.
To keep the totals realistic, selective bottom-up approximations are used as a check, such as sampled ASP times estimated testing volumes for key applications, and channel conversations that indicate where service testing is being substituted for in-house labs. Inputs that matter in this market include injectable and biologics batch throughput, lot-release versus in-process split, method mix between LAL, rFC, MAT, and rabbit tests, automation and rapid-system penetration, and the pace of method validation upgrades in quality labs. When a bottom-up signal is incomplete for smaller countries or niche device testing, gaps are handled through proxy indicators like manufacturing footprint and regulatory intensity, and then adjusted during expert review.
Forecasting is done using scenario analysis supported by a simple multivariate regression where growth is linked to biologics output trends, capacity additions, and expected method substitution from animal-based testing to in vitro alternatives. Assumptions that change year to year, such as pricing pressure on kits and the rate of instrument adoption, are revisited with respondents before the final run.
Data Validation & Update Cycle
Validation happens in layers, and it is not treated as a single step at the end. We compare the modeled output against independent signals, such as biopharma manufacturing expansion patterns, regulatory activity related to quality testing, and trade movement for core consumables, and then we check for sharp regional jumps that do not match real operating conditions.
Outliers are reviewed by a second analyst, and a follow-up call is triggered when an assumption creates a large variance in either the current-year size or the growth path. Reports are refreshed annually, and interim updates are made when material events occur, such as a major method shift, a regulatory change, or an unexpected supply constraint. Before delivery, the model and key inputs are rechecked so clients receive an updated view aligned to the latest available information.
Mordor Intelligence's Pyrogen Testing Market Size Compared With Other Published Estimates
Published market values for pyrogen testing can differ even when the topic looks the same, because the included products, the testing stages counted, and the way services are treated are not consistent across publishers. Differences also come from how quickly assumptions are refreshed, which matters in a market where method substitution and automation are progressing.
The main gap comes from whether adjacent laboratory consumables and broader endotoxin related workflows are counted, and then rolled into the total as if they are always part of regulated pyrogen testing demand, while Mordor Intelligence counts only kits, reagents, instruments, and contract services tied to regulated parenteral, biologics, vaccine, and high-risk device testing activity.
Benchmark comparison
| Source | Market Size | Gaps in Research Methodology |
|---|---|---|
| Mordor Intelligence | USD 1.73 B (2026) | |
| Global Consultancy A | USD 2.56 B (2025) | Uses a combined pyrogen and endotoxin scope, and it commonly bundles extra lab consumables and broader testing workflows, which can lift the headline value versus a regulated pyrogen-testing-only cut. |
| Industry Publisher B | USD 1.50 B (2025) | Leans more on a narrower kit-led view and earlier-year pricing assumptions, which can understate the contribution from instruments and outsourced testing services, especially where automation uptake is accelerating. |
Overall, the spread is mainly explained by scope choices and how method mix and pricing are updated over time. When each line item is linked back to clear demand signals like lot-release testing intensity, method adoption, and service outsourcing, the resulting market size is easier to replicate and to explain in a decision setting.


Key Questions Answered in the Report
How large is the pyrogen testing market today?
The pyrogen testing market size reached USD 1.73 billion in 2026 and is projected to climb to USD 2.99 billion by 2031.
Which region is growing fastest?
Asia-Pacific is forecast to register a 13.63% CAGR through 2031, the quickest pace worldwide.
What technology is replacing rabbit-pyrogen tests in Europe?
The Monocyte Activation Test has become the mandated alternative, with full enforcement starting July 2025.
Why is recombinant Factor C gaining popularity?
Pharmacopeial revisions in the United States and Europe now recognize rFC as equivalent to LAL, eliminating prior regulatory barriers.
What challenges do small manufacturers face when adopting MAT or rFC?
Validation expenses can top USD 500,000 per product line, a significant hurdle for SMEs with limited capital.
How are suppliers addressing horseshoe-crab lysate shortages?
Vendors are expanding recombinant and cartridge-based platforms, while regulators encourage rFC adoption to ease supply pressure.
Page last updated on:


