Market Overview
| Study Period | 2021 - 2031 |
|---|---|
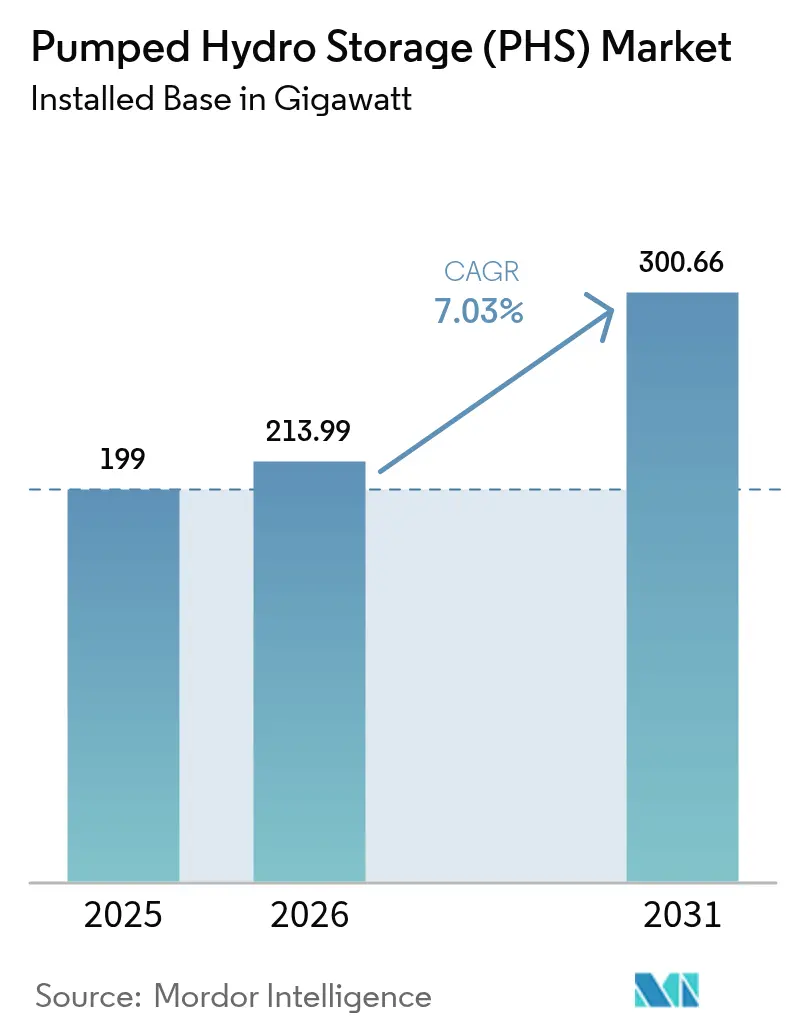
| Market Volume (2026) | 213.99 gigawatt |
| Market Volume (2031) | 300.66 gigawatt |
| Growth Rate (2026 - 2031) | 7.03% CAGR |
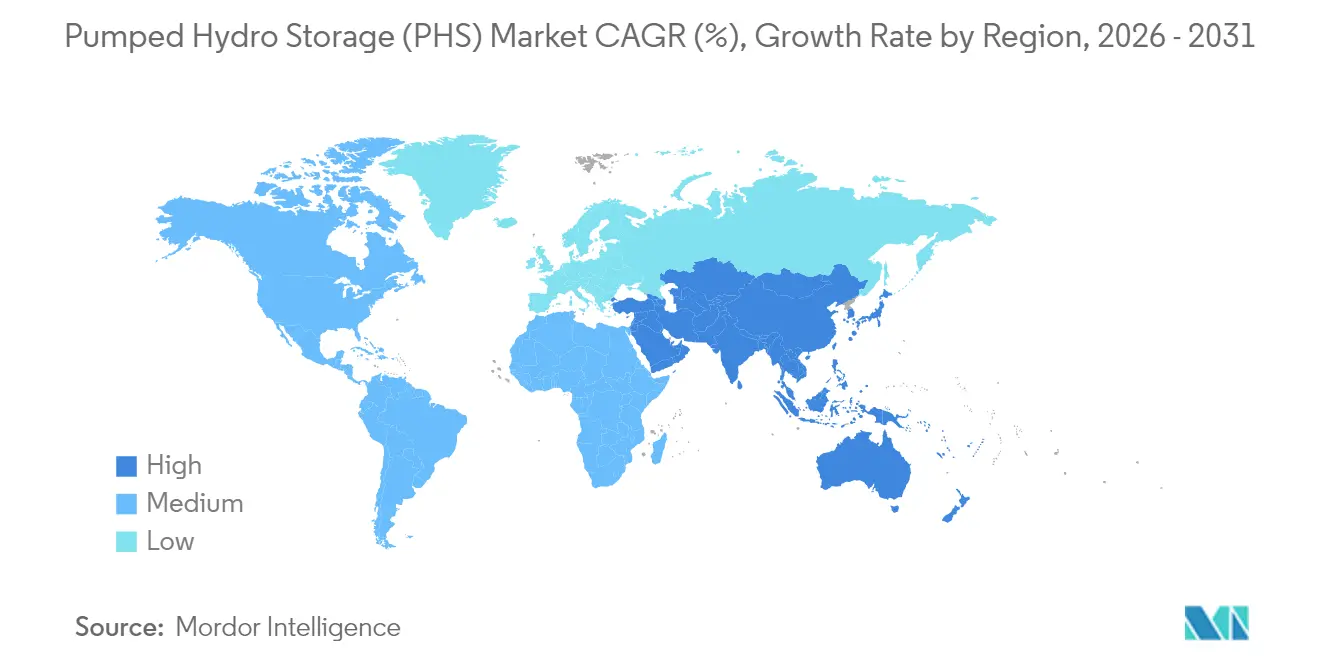
| Fastest Growing Market | Asia Pacific |
| Largest Market | Asia-Pacific |
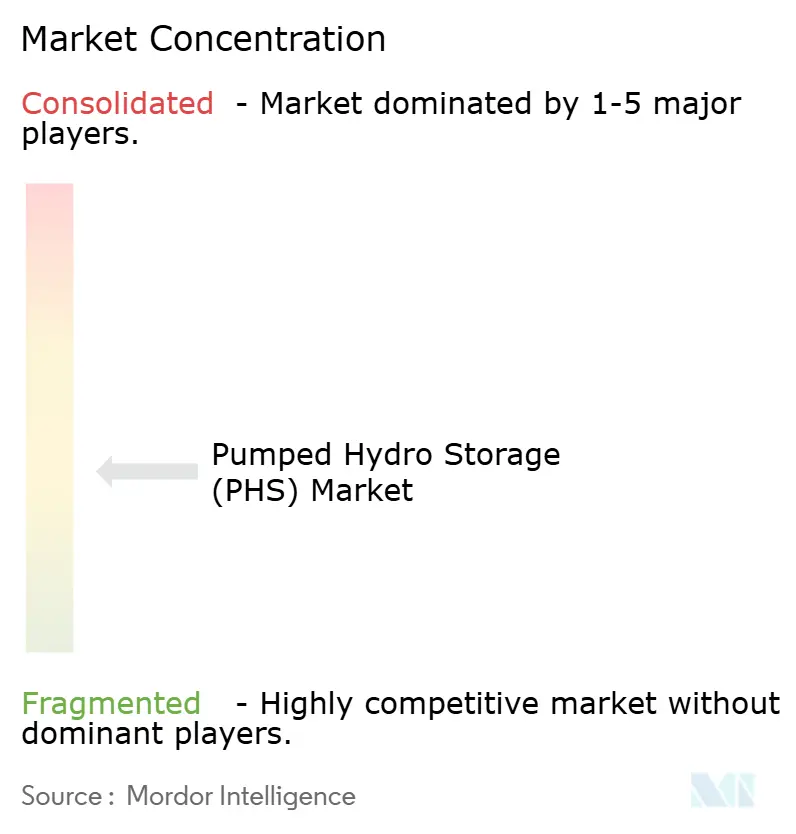
| Market Concentration | Medium |
Major Players *Disclaimer: Major Players sorted in no particular order Image © Mordor Intelligence. Reuse requires attribution under CC BY 4.0. | |
Pumped Hydro Storage (PHS) Market Analysis by Mordor Intelligence
The Pumped Hydro Storage Market size was valued at 199 gigawatt in 2025 and estimated to grow from 213.99 gigawatt in 2026 to reach 300.66 gigawatt by 2031, at a CAGR of 7.03% during the forecast period (2026-2031).
Rapid grid-scale renewable additions, supportive fiscal incentives, and modernization of aging hydro assets continue to anchor demand. Closed-loop technology’s smaller environmental footprint is accelerating project approvals, while joint-ownership structures reduce individual project risk amid capital-intensive balance sheets. Asia-Pacific remains the principal growth engine, buoyed by China’s 120 GW by 2030 target and India’s newly liberalized development guidelines. Developers are combining pumped storage facilities with floating solar and disused mine conversions, thereby widening the geographic scope of viable sites. Even so, lengthy environmental reviews and grid-tariff ambiguities temper near-term commissioning momentum.
Key Report Takeaways
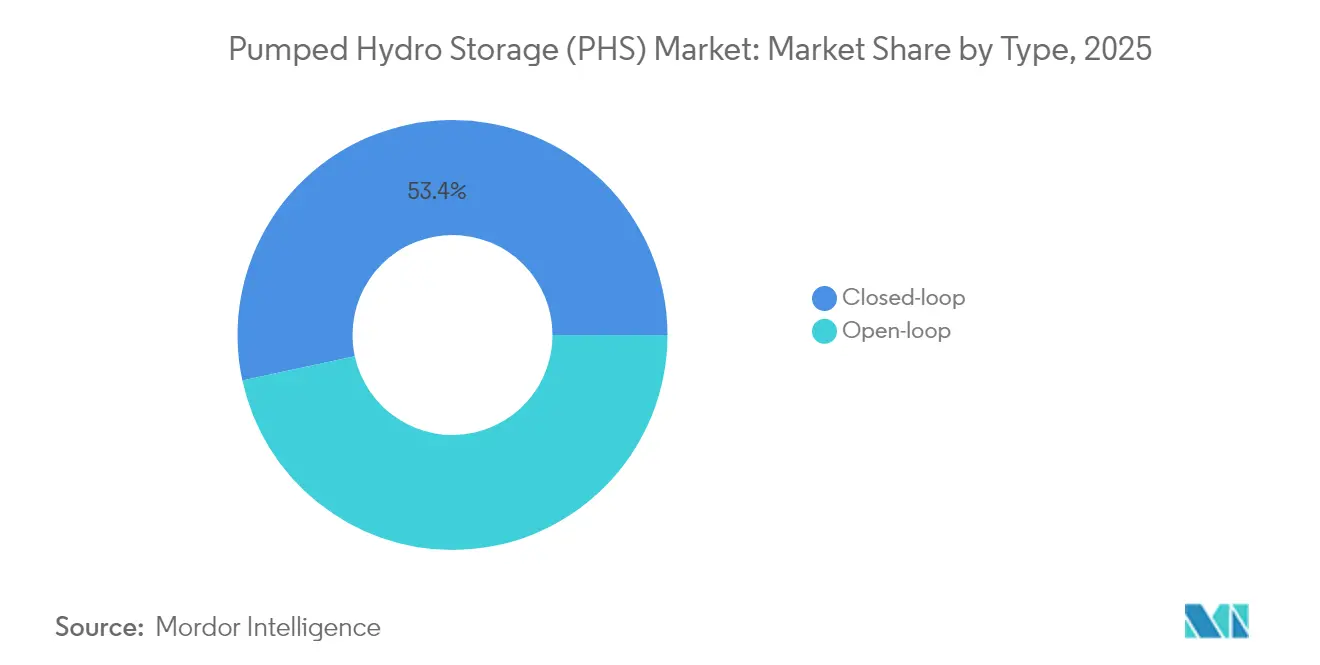
- By type, closed-loop systems held 53.40% of the pumped hydro storage market share in 2025 and are expanding at a 7.56% CAGR through 2031.
- By power rating, the 200-1,000 MW segment led with 45.20% of the pumped hydro storage market size in 2025, while projects below 200 MW are advancing at an 8.06% CAGR until 2031.
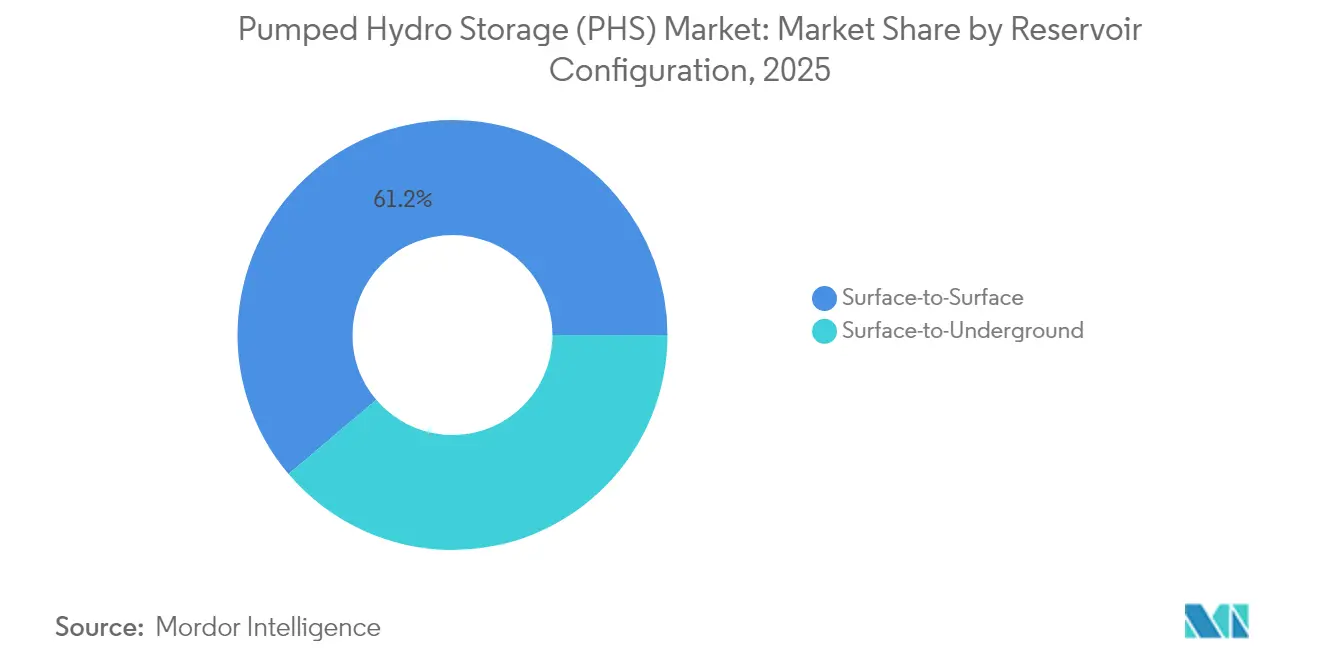
- By reservoir configuration, surface-to-surface plants retained 61.20% revenue share in 2025; surface-to-underground installations exhibit an 7.89% CAGR to 2031.
- By application, renewable-firming uses captured 50.30% share of the pumped hydro storage market size in 2025 and are forecast to post a 7.29% CAGR to 2031.
- By geography, Asia-Pacific controlled 48.40% revenue share in 2025 and is progressing at a 8.85% CAGR, powered by China’s and India’s pipelines.
Note: Market size and forecast figures in this report are generated using Mordor Intelligence’s proprietary estimation framework, updated with the latest available data and insights as of 2026.
Global Pumped Hydro Storage (PHS) Market Trends and Insights
Drivers Impact Analysis*
| Driver | (~) % Impact on CAGR Forecast | Geographic Relevance | Impact Timeline |
|---|---|---|---|
| Grid-scale renewable integration mandates | 2.10% | Global, with early gains in EU, China, California | Medium term (2-4 years) |
| Repowering of ageing hydro dams with reversible units | 1.80% | North America & EU, spill-over to APAC | Long term (≥ 4 years) |
| Long-duration storage incentives in Inflation Reduction Act (USA) | 1.50% | National, with concentration in Western states | Short term (≤ 2 years) |
| Fast-track licensing in EU for strategic energy-storage assets | 1.20% | EU core, extending to UK and Norway | Medium term (2-4 years) |
| Co-location with floating solar to raise round-the-clock CF | 0.90% | APAC core, emerging in Brazil and Mediterranean | Long term (≥ 4 years) |
| Use of disused mines & quarries for low-impact closed-loop projects | 0.70% | Global, with pilot projects in Australia, US, Europe | Long term (≥ 4 years) |
| Source: Mordor Intelligence | |||
Grid-scale renewable integration mandates drive deployment acceleration
Mandatory clean-energy targets are pushing utilities and state planners to expand the pumped hydro storage market, with China’s pledge for 120 GW by 2030 exemplifying the policy-led build-out. The “PSH-plus” model links renewable clusters with adjacent storage, trimming curtailment, and easing grid expansion costs. Europe mirrors this through its Projects of Common Interest list, which features 12 storage schemes that enjoy streamlined permitting.[1]European Commission, “Projects of Common Interest 2025,” ec.europa.euSpain’s EUR 700 million subsidy window further underlines national follow-through, providing clear revenue visibility that de-risks investor returns.
Repowering ageing hydro infrastructure unlocks latent capacity
Modernizing existing dams by adding reversible pump-turbines breathes new life into legacy assets without the land-use controversies of greenfield builds. The US Department of Energy’s USD 430 million initiative to upgrade the domestic fleet demonstrates the scale of latent gains. Ontario Power Generation’s USD 1 billion rehabilitation of eight stations adds 1,617 MW via higher-efficiency units, while Mexico’s nine-plant refurbishments will raise annual output by 1,754 GWh and extend operational lives by five decades.
Inflation Reduction Act incentives catalyze US market revival
A 30% investment tax credit, plus domestic-content bonuses, now applies to standalone storage, reshaping project economics and swelling a US pipeline of 39.5 GW, three projects already fully FERC-licensed. Federal backing for mine-land repurposing, such as the Lewis Ridge plant in Kentucky, underscores how policy can align environmental remediation with grid needs.[2]U.S. Department of Energy, “Clean Energy on Mine Land Program,” energy.gov
EU fast-track licensing streamlines strategic asset development
Recognizing the tight 2030 climate timetable, Brussels has instructed member states to condense approval cycles for priority storage projects, dovetailing with FERC’s expedited two-year window for US closed-loop filings. The UK’s cap-and-floor regime shields investors from volatile merchant returns by guaranteeing minimum cash flows.
Restraints Impact Analysis*
| Restraint | (~) % Impact on CAGR Forecast | Geographic Relevance | Impact Timeline |
|---|---|---|---|
| Lengthy environmental impact assessments | -1.90% | Global, most pronounced in developed markets | Medium term (2-4 years) |
| High upfront CAPEX vs. lithium-ion alternatives | -1.40% | Global, particularly affecting sub-1GW projects | Short term (≤ 2 years) |
| Scarcity of suitable dual-reservoir topographies in urban centres | -1.10% | Dense urban regions globally | Long term (≥ 4 years) |
| Grid tariff uncertainty for storage arbitrage revenues | -0.80% | Deregulated markets, primarily US and EU | Medium term (2-4 years) |
| Source: Mordor Intelligence | |||
Lengthy environmental impact assessments constrain development timelines
Studies covering geology, biodiversity, and cultural heritage can take 5-10 years, adding cost overruns and permitting fatigue. Closed-loop schemes mitigate aquatic impacts, yet hydro-geological risks still demand case-specific reviews, as the Mineville filing in New York shows.[3]Pacific Northwest National Laboratory, “Pumped Storage Economic Analysis,” pnnl.gov
High upfront CAPEX versus lithium-ion alternatives
A 100 MW, 10-hour pumped plant runs USD 263/kWh versus batteries’ lower entry ticket for 2-4-hour services. Long asset lives soften lifecycle cost but leave developers searching for blended finance until paybacks materialize.
*Our forecasts treat driver/restraint impacts as directional, not additive. The impact forecasts reflect baseline growth, mix effects, and variable interactions.
Segment Analysis
By Type: Closed-loop systems drive innovation
Closed-loop plants accounted for 53.40% of the pumped hydro storage market share in 2025 and are pacing at a 7.56% CAGR, largely because decoupling from rivers curtails aquatic disruption and speeds approvals. The Federal Energy Regulatory Commission now offers an accelerated two-year license solely for such projects, reinforcing their deployment advantage. Open-loop facilities retain a sizeable base but confront intensifying ecosystem scrutiny, especially where flow regulation or fish passage is contentious.
Closed-loop schemes also unlock new topographies, including disused mine pits and quarries, broadening the pumped hydro storage market’s geographic reach. Lifecycle analyses show lower sedimentation risk and simpler de-watering processes, helping operators maintain high round-trip efficiencies for decades. In parallel, suppliers are refining variable-speed pump-turbines that fit purpose-built reservoirs and allow rapid mode changes, crucial for renewables balancing.


By Power Rating: Mid-scale dominance with small-scale acceleration
Plants between 200 MW and 1,000 MW delivered 45.20% of the pumped hydro storage market size in 2025 because they harmonize capital outlay with grid uptake limits. Regional operators such as Adani Green’s 1,250 MW Uttar Pradesh project demonstrate how synchronized commissioning with transmission upgrades protects against congestion curtailment.
As distributed architectures emerge, installations below 200 MW record an 8.06% CAGR through 2031. Their lighter environmental footprint garners quicker local authority consent, and modular civil works lower schedule risk, fueling investor interest. Conversely, projects over 1,000 MW, while offering bulk inertia, confront longer lead times and heightened public scrutiny—witnessed by China’s 3.6 GW Fengning build that demanded substantial ecological offsets.
By Reservoir Configuration: Surface-to-surface prevalence with underground innovation
Surface-to-surface layouts maintained 61.20% of 2025 revenue as contractors leverage familiar dam and penstock techniques, shortening learning curves and ensuring predictable operations. Accelerated concrete placement methods and digital twin monitoring now further cut construction overruns.
Surface-to-underground schemes, though newer, are rising at an 7.89% CAGR. Repurposed mines such as Kentucky’s Lewis Ridge or New York’s Mineville tap existing shafts as lower reservoirs, trimming earth-moving needs and enabling urban or peri-urban locations where elevation differentials are scarce. Advanced rock-mechanics modeling underscores stability, helping win environmental approvals and broadening the pumped hydro storage market.
By Application: Renewable-firming dominance reflects grid evolution
Renewable-firming uses captured 50.30% share of the pumped hydro storage market size in 2025 and are advancing at a 7.29% CAGR. Curtailment episodes from wind and solar surpluses generate low-cost off-peak energy, ideal for pumping cycles. The Kidston project pairs a 250 MW plant with on-site PV, demonstrating firm, dispatchable output that traditional peakers struggle to match.
Ancillary services—frequency response, voltage support, spinning reserve—now fetch premium nodal prices, prompting plant refurbishments with variable-speed machines that can ramp from zero to full power within 30 seconds. Energy arbitrage remains viable for >8-hour spreads, though batteries dominate the 1-4-hour niche, prompting pumped operators to prioritize long-duration products that the grid lacks.
Geography Analysis
Asia-Pacific held 48.40% of the pumped hydro storage market in 2025 and is posting a 8.85% CAGR owing to China’s 50.94 GW installed base and an aggressive >300-plant pipeline. Beijing’s planning regime integrates storage with renewable bases, minimizing curtailment and shaving grid reinforcement costs, while India’s 103 GW technical potential remains largely untapped but is now primed for build-out after the release of supportive tariff guidelines.
Europe’s pumped hydro storage market enjoys policy heft via the EU’s €584 billion grid-modernization roadmap, which earmarks storage as a priority asset class. Institutional lenders like the European Investment Bank channel concessional loans—€108 million to Iberdrola in 2025—to refurbish and uprate Iberian plants, improving reservoir efficiency and adding peak capacity. Alpine nations continue to exploit natural elevation advantages, while the UK’s cap-and-floor mechanism has readied Glenmuckloch and Coire Glas for final investment decisions.
North America is rebounding under the Inflation Reduction Act, which gives the pumped hydro storage market direct parity with batteries under a 30% ITC. A 39.5 GW pipeline traverses Arizona, Oregon, and the Appalachians, with three schemes already through the FERC gate. Canada focuses on modernization; Ontario Power Generation’s USD 1 billion program illustrates how refurbishing ageing turbines can yield immediate incremental megawatts without new civil works.

Competitive Landscape
The pumped hydro storage market is moderately concentrated, dominated by legacy turbine manufacturers and EPC contractors delivering multi-decade reliability. Andritz alone has supplied over 550 units aggregating 40 GW, using proprietary variable-speed designs to secure recurring service contracts. GE Vernova and Voith likewise use lifecycle support agreements that embed them within operator O&M budgets for 30-50 years.
Risk mitigation shapes ownership. In the United States, 34% of installed pumped capacity sits under joint ventures, compared with just 2% for classical run-of-river plants. Spreading capital and permitting exposure enables utilities, independent power producers, and pension funds to co-finance USD 1 billion-plus projects. Emerging closed-loop developments often bundle environmental remediation, allowing miners to exit liabilities while equity partners receive long-dated cash flows.
Technological differentiation persists. Variable-speed machines allow rapid mode switching and turbine efficiencies above 85%, critical for frequency regulation markets. Submersible pump-turbines under R&D at Argonne National Laboratory promise lower excavation volumes, while geomechanical storage concepts seek to compress water in lined rock caverns, potentially slashing civil works costs. Suppliers court developers through digital twin performance analytics that flag efficiency drifts and optimize dispatch, embedding aftermarket revenue streams.
Pumped Hydro Storage (PHS) Industry Leaders
Enel SpA
China Three Gorges Corporation
Electricité de France (EDF)
Duke Energy Corporation
Iberdrola SA
- *Disclaimer: Major Players sorted in no particular order

Recent Industry Developments
- June 2025: GE Vernova commissioned India’s first variable-speed unit at Tehri, boosting the complex to 2.4 GW and expanding flexible ramping capacity.
- June 2025: Vietnam Electricity inked construction contracts for the 1,200 MW Bac Ai phase 2 pumped plant, total outlay of 21,100 billion VND.
- April 2025: Adani Green signed a 40-year PPA for a 1.25 GW pumped storage facility in Uttar Pradesh, India.
- April 2025: European Investment Bank extended €108 million in loans to Iberdrola for storage upgrades in Extremadura.


Global Pumped Hydro Storage (PHS) Market Report Scope
Pumped storage hydropower (PSH) is a type of hydroelectric energy storage. It is a configuration of two water reservoirs at different elevations that can generate power as water moves from one to the other (discharge), passing through a turbine. The system also requires power to pump water back into the upper reservoir (recharge). The pumped hydro storage market is segmented by type and geography. By type, the market is segmented into open-loop and closed-loop. The report also covers the market size and forecasts for the pumped hydro storage market across the major regions. For each segment, market sizing and forecasts have been done based on installed capacity (gigawatts).
By Type
| Open-loop |
| Closed-loop |
By Power Rating (MW)
| Below 200 MW |
| 200 to 1,000 MW |
| Above 1,000 MW |
By Reservoir Configuration
| Surface-to-Surface |
| Surface-to-Underground |
By Application
| Renewable Firming |
| Ancillary Grid Services |
| Arbitrage & Peak Shaving |
By Geography
| North America | United States |
| Canada | |
| Mexico | |
| Europe | Germany |
| United Kingdom | |
| France | |
| Italy | |
| Spain | |
| Rest of Europe | |
| Asia Pacific | China |
| India | |
| Japan | |
| South Korea | |
| ASEAN Countries | |
| Rest of Asia Pacific | |
| South America | Argentina |
| Rest of South America | |
| Middle East and Africa | Iran |
| Morocco | |
| South Africa | |
| Rest of Middle East and Africa |
| By Type | Open-loop | |
| Closed-loop | ||
| By Power Rating (MW) | Below 200 MW | |
| 200 to 1,000 MW | ||
| Above 1,000 MW | ||
| By Reservoir Configuration | Surface-to-Surface | |
| Surface-to-Underground | ||
| By Application | Renewable Firming | |
| Ancillary Grid Services | ||
| Arbitrage & Peak Shaving | ||
| By Geography | North America | United States |
| Canada | ||
| Mexico | ||
| Europe | Germany | |
| United Kingdom | ||
| France | ||
| Italy | ||
| Spain | ||
| Rest of Europe | ||
| Asia Pacific | China | |
| India | ||
| Japan | ||
| South Korea | ||
| ASEAN Countries | ||
| Rest of Asia Pacific | ||
| South America | Argentina | |
| Rest of South America | ||
| Middle East and Africa | Iran | |
| Morocco | ||
| South Africa | ||
| Rest of Middle East and Africa | ||


Key Questions Answered in the Report
What is the current pumped hydro storage market size?
The pumped hydro storage market size stands at 213.99 GW in 2026 and is forecast to reach 300.66 GW by 2031.
Which region leads the pumped hydro storage market?
Asia-Pacific leads with 48.40% revenue share in 2025 and an 8.85% CAGR outlook through 2031, driven mainly by China and India.
Why are closed-loop systems growing faster?
Closed-loop plants bypass rivers, easing environmental approvals and qualifying for expedited licensing that accelerates build times.
How does the Inflation Reduction Act affect US pumped storage?
A 30% investment tax credit now applies to standalone storage, helping develop a 39.5 GW project pipeline and improving financing terms.
What hurdle most delays pumped storage projects?
Multi-year environmental impact assessments, especially in densely regulated markets, often extend project lead times by up to a decade.
Are batteries replacing pumped hydro storage?
Lithium-ion dominates short-duration services, but pumped storage retains cost and lifespan advantages for applications exceeding 8-10 hours.
Page last updated on:


