
Market Overview
| Study Period | 2020 - 2031 |
|---|---|
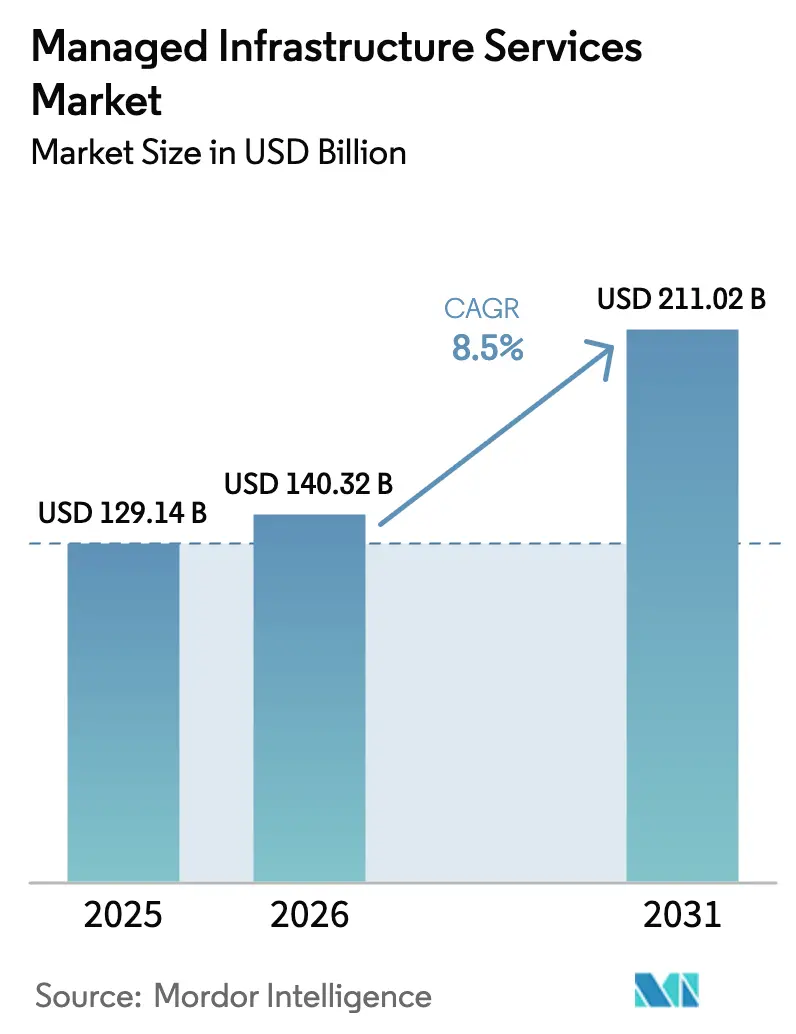
| Market Size (2026) | USD 140.32 Billion |
| Market Size (2031) | USD 211.02 Billion |
| Growth Rate (2026 - 2031) | 8.50 % |
| Fastest Growing Market | Asia Pacific |
| Largest Market | North America |
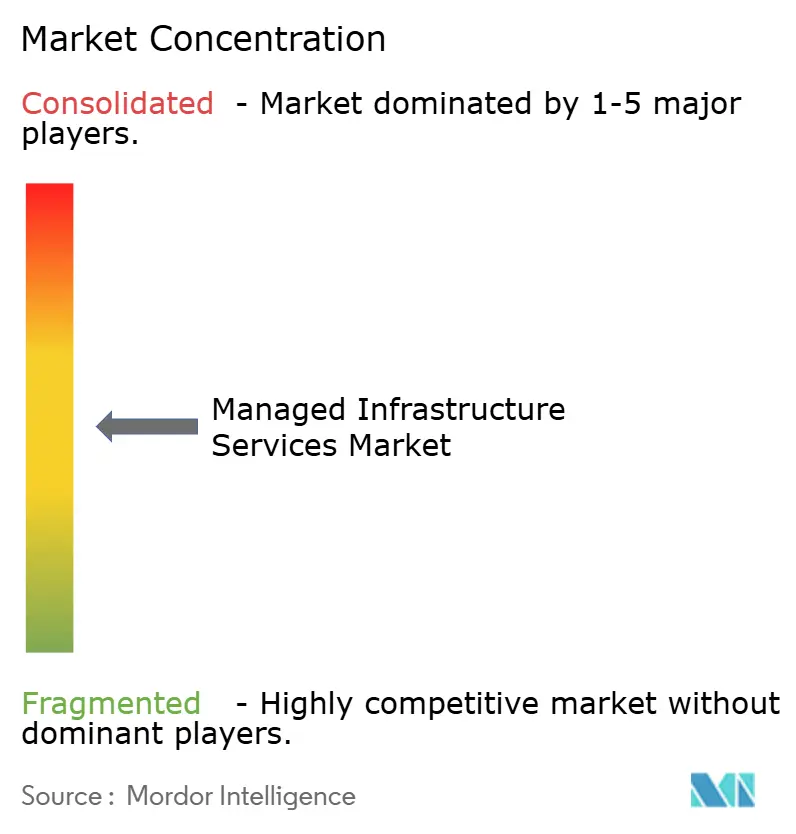
| Market Concentration | Medium |
Major Players *Disclaimer: Major Players sorted in no particular order Image © Mordor Intelligence. Reuse requires attribution under CC BY 4.0. | |
Managed Infrastructure Services Market Analysis by Mordor Intelligence
The managed infrastructure services market size is expected to increase from USD 129.14 billion in 2025 to USD 140.32 billion in 2026 and reach USD 211.02 billion by 2031, growing at a CAGR of 8.5% over 2026-2031. Cloud-first transformation, regulatory demand for operational resilience, and a widening skills gap are pushing enterprises to outsource infrastructure operations. Consumption-based pricing, unified observability, and zero-trust security architectures are recasting managed-service contracts from labor-intensive ticket handling to outcome-linked agreements that guarantee latency, uptime, and compliance. Hyperscalers are extending their portfolios from raw infrastructure toward full-stack management, compressing margins for traditional providers but also opening resale and co-innovation channels. Edge computing, sovereign-cloud frameworks, and sustainability-linked service-level agreements are emerging as the next battlegrounds for differentiation. Price competition is moderating because automation depth, compliance posture, and integration reach are replacing head-count scale as sourcing criteria.
Key Report Takeaways
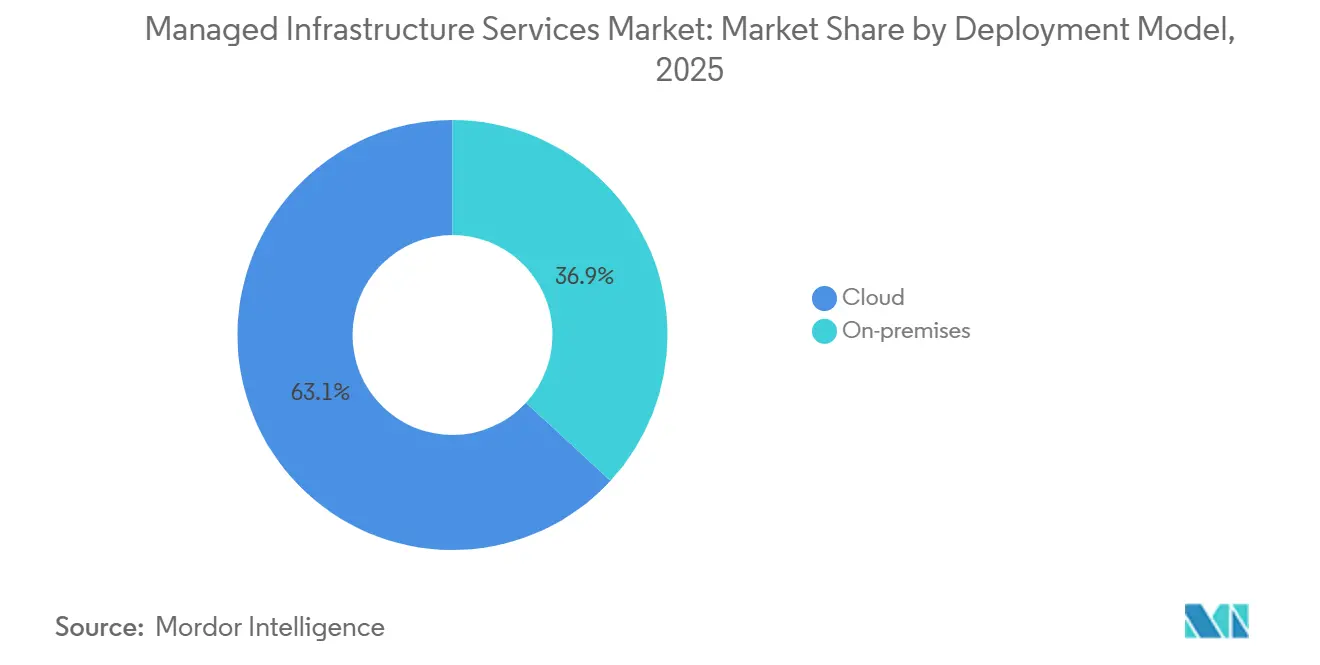
- By deployment model, cloud captured 63.14% of 2025 revenue, while on-premises installations are expanding at an 8.2% CAGR through 2031.
- By service type, server management led with 28.19% of managed infrastructure services market share in 2025; AI-driven observability is projected to expand at an 11.81% CAGR to 2031.
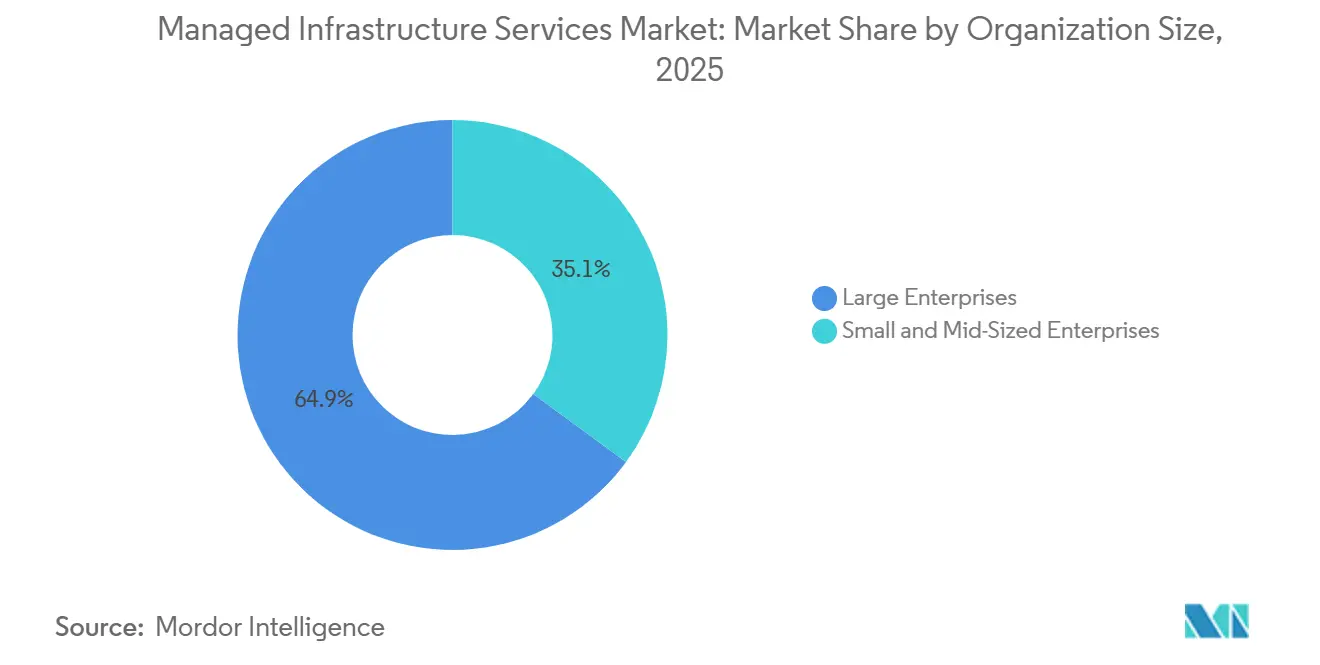
- By organization size, large enterprises held 64.94% of the managed infrastructure services market size in 2025; small and mid-sized enterprises are advancing at a 9.11% CAGR through 2031.
- By end-user vertical, banking, financial services and insurance commanded 22.95% revenue share in 2025, while healthcare and life sciences record the fastest 11.43% CAGR to 2031.
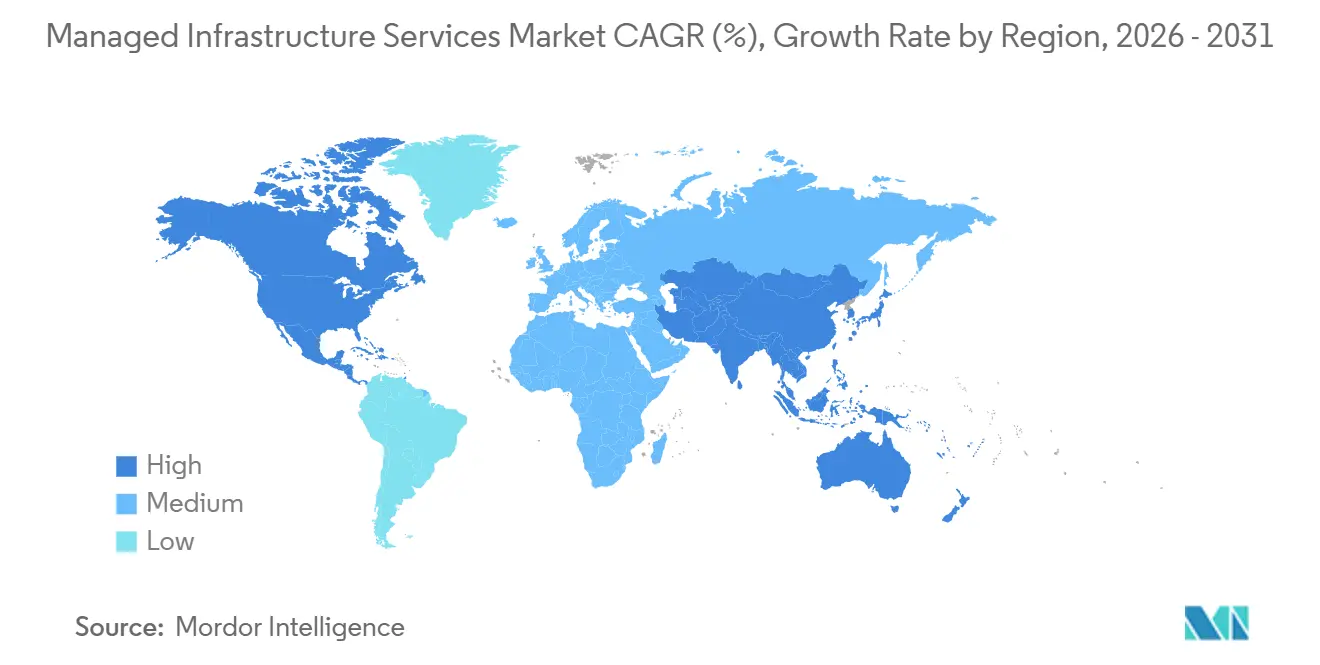
- By geography, North America led with 42.53% revenue share in 2025; Asia-Pacific is the fastest-growing region at a 10.21% CAGR to 2031.
Note: Market size and forecast figures in this report are generated using Mordor Intelligence’s proprietary estimation framework, updated with the latest available data and insights as of January 2026.
Global Managed Infrastructure Services Market Trends and Insights
Drivers Impact Analysis*
| Driver | (~) % Impact on CAGR Forecast | Geographic Relevance | Impact Timeline |
|---|---|---|---|
| Shift to Everything-as-a-Service Business Models | +1.8% | Global, early momentum in North America and Western Europe | Medium term (2-4 years) |
| Accelerated Cloud-Native Application Modernisation | +1.6% | Global, led by Asia-Pacific and North America | Short term (≤ 2 years) |
| Need for Zero-Trust Security Frameworks in Hybrid Estates | +1.4% | North America and Europe, expanding to Asia-Pacific hubs | Medium term (2-4 years) |
| AI-Driven Observability and Self-Healing Infrastructure | +1.5% | Global, highest adoption in technology and telecom verticals | Short term (≤ 2 years) |
| Edge-to-Core Orchestration for Industry 4.0 Roll-Outs | +1.2% | Asia-Pacific manufacturing corridors, Germany, United States Midwest | Long term (≥ 4 years) |
| Sustainability Mandates Driving Green Data-Centre Outsourcing | +1.0% | Europe and North America | Long term (≥ 4 years) |
| Source: Mordor Intelligence | |||
Shift to Everything-as-a-Service Business Models
Usage-based pricing has moved from software to infrastructure, allowing enterprises to swap fixed depreciation for variable operating costs that flex with real-time demand. Major cloud platforms deepened per-second billing to storage, networking, and database services, erasing long-standing minimum-commit penalties.[1]Jeff Barr, “New Per-Second Billing for EC2 Instances and EBS Volumes,” Amazon Web Services, aws.amazon.com Board-level scrutiny of supplier concentration risk has accelerated multi-vendor strategies, and managed-service providers now aggregate spend across hyperscalers, colocation, and edge sites to deliver a single invoice that maps cost to business value.
Accelerated Cloud-Native Application Modernization
In 2025, enterprises retired more COBOL lines than they had in the entire previous decade, marking a significant shift in the technology landscape as lift-and-shift economics transitioned to containerized microservices overseen by Kubernetes. This transition highlights the growing adoption of modernized infrastructure solutions aimed at improving efficiency and scalability. By refactoring their core systems, banks in Singapore and Australia achieved a notable 40% reduction in infrastructure costs, alongside API latency improvements to under 50 milliseconds, showcasing the tangible benefits of modernization efforts.[2]Monetary Authority of Singapore, “Guidelines on Technology Risk Management,” mas.gov.sg Managed-service providers are setting themselves apart in this evolving market by employing factory-style migration playbooks. These playbooks integrate ISO 27001 controls with site-reliability engineering practices, ensuring their environments are not only optimized for performance but also fully prepared for audits, thereby meeting stringent compliance and operational standards.
Need for Zero-Trust Security Frameworks in Hybrid Estates
In 2023, a ransomware breach exploited a lone VPN credential, underscoring the significant vulnerabilities inherent in perimeter defences.[3]Financial Times Staff, “European Logistics Firm Hit by Ransomware Through VPN Breach,” ft.com This high-profile incident served as a wake-up call for organizations and insurers alike, prompting insurers to mandate the adoption of a zero-trust security framework as a prerequisite for policy renewals. In response to this shift, service providers have increasingly integrated advanced security measures, such as identity-aware gateways and policy engines, into their offerings. These systems are designed to evaluate and score each session in real-time, ensuring a more robust security posture. They achieve this by consolidating and analysing signals from various sources, including cloud workloads, on-premises ERP systems, and remote endpoints, thereby providing comprehensive protection across the entire network. Additionally, standards organizations like NIST have recognized the importance of zero-trust principles by incorporating them into their baseline guidance. This move has effectively elevated zero-trust from being considered a best practice to becoming a critical compliance requirement for organizations aiming to enhance their cybersecurity frameworks.
AI-Driven Observability and Self-Healing Infrastructure
Machine-learning models analyze metrics, logs, and traces to foresee failures and trigger automated fixes, significantly reducing mean-time-to-resolution by as much as 70%. These models play a critical role in enhancing operational efficiency and minimizing downtime. Cisco's USD 28 billion acquisition of Splunk in 2024 underscored the market's growing valuation of unified telemetry, highlighting its importance in modern IT infrastructure. Managed-service providers are increasingly monetizing these advanced capabilities through availability-based contracts. These contracts impose penalties when predictive models fail to detect anomalies, thereby ensuring accountability and reliability. This shift in approach is transforming the conversation from traditional manpower reliance to the adoption of machine intelligence as a core operational strategy.
Restraints Impact Analysis*
| Restraint | (~) % Impact on CAGR Forecast | Geographic Relevance | Impact Timeline |
|---|---|---|---|
| Rising Hyperscaler Lock-In Risk | -0.9% | Global, pronounced in North America and Europe | Medium term (2-4 years) |
| Talent Exodus from Traditional MSPs to Cloud Providers | -1.1% | North America, Europe, India | Short term (≤ 2 years) |
| Data-Sovereignty Barriers in Highly Regulated Sectors | -0.7% | Europe, China, Middle East, India, Southeast Asia | Long term (≥ 4 years) |
| Escalating Cyber-Insurance Premiums Eroding TCO Benefits | -0.8% | North America and Europe | Medium term (2-4 years) |
| Source: Mordor Intelligence | |||
Rising Hyperscaler Lock-In Risk
Enterprises face rising switching costs and potential egress fees, which can sometimes exceed USD 0.09 per GB, particularly when repatriating petabyte-scale data. These costs can significantly impact operational budgets, especially for organizations managing large-scale data transfers. While managed-service providers offer cross-cloud abstraction layers to simplify operations, these services come with a 12-18% increase to monthly bills. Additionally, they introduce further dependencies, which can complicate vendor relationships and operational flexibility. This growing reliance on managed services has drawn the attention of antitrust regulators, who are increasingly scrutinizing such practices for potential regulatory concerns.
Talent Exodus from Traditional MSPs to Cloud Providers
Hyperscalers entice experienced engineers with lucrative equity packages that significantly outshine those offered by service firms, driving attrition rates to exceed 20% in certain specialized practices. This trend has created a challenging environment for service providers, who are striving to retain talent while competing with the attractive compensation structures of hyperscalers. To address this issue, providers are heavily investing in certification boot camps to upskill their workforce. However, despite these efforts, the lack of hands-on, practical experience continues to be a major hurdle. This skills gap not only results in delays during intricate and complex migration processes but also increases reliance on automation scripts. While these scripts can temporarily mask the evident shortage of skilled professionals, they fail to completely eliminate the risk of incident escalation, leaving organizations vulnerable to operational disruptions.
*Our forecasts treat driver/restraint impacts as directional, not additive. The impact forecasts reflect baseline growth, mix effects, and variable interactions.
Segment Analysis
By Deployment Model: Cloud Dominance Reinforces Hybrid Complexity
Cloud deployments accounted for 63.14% of the 2025 revenue and are projected to grow at a CAGR of 8.67%. This trend highlights a significant shift in the managed infrastructure services market towards pay-as-you-go models, which offer flexibility and scalability to enterprises. Meanwhile, on-premises setups hold a 36.86% share. This is largely because latency-sensitive trading platforms and classified workloads depend on air-gapped servers to ensure security and performance. Additionally, regulations like DORA mandate documented fallback arrangements, further reinforcing the need for on-premises infrastructure in specific use cases. Service providers are now offering unified control planes that integrate private racks, colocation cages, and public IaaS, merging policy and telemetry into a cohesive and streamlined view for better management and decision-making.
More enterprises are adopting two-tier architectures to optimize their operations and resource utilization. They are positioning real-time analytics at the edge, enabling faster decision-making and reduced latency, while offloading GPU-intensive training tasks to the cloud to leverage its computational power and scalability. Managed-service providers are adeptly orchestrating these placements, considering factors like latency, cost, and sovereignty to ensure optimal performance and compliance. This capability elevates hybrid architecture from merely an exit strategy to a preferred design choice, offering enterprises a balanced approach to meet their evolving business and technical requirements.


By Service Type: AI Observability Disrupts Server Management Incumbency
Despite commanding a 28.19% share of the revenue pie, server management's growth rate of 7.8% pales in comparison to its AI-infused counterparts. This segment continues to play a critical role in the broader market, but its slower growth highlights the increasing demand for innovative solutions. As enterprises pivot towards predictive maintenance, AI-driven observability is set to spearhead service growth, boasting a projected CAGR of 11.81%. This trend underscores the growing importance of artificial intelligence in driving efficiency and reducing operational downtime.
As hybrid work diminishes office endpoint density, desktop and print services face a 6.9% annual decline. The shift to remote and flexible work environments has significantly impacted the demand for traditional office infrastructure. Meanwhile, network and connectivity services, now accounting for 16.3% of revenue, are bolstered by software-defined WAN overlays, which enhance network performance and scalability. Additionally, inventory and asset management reaps the rewards of ISO 19770 compliance mandates, streamlining license reconciliation through automation. These mandates not only ensure compliance but also help organizations optimize their asset utilization and reduce costs.
By Organization Size: SMEs Leverage Platform Economics to Close the Infrastructure Gap
While large enterprises command a dominant 64.94% share of the managed infrastructure services market, their growth rate of 8.3% lags behind the 9.11% surge seen in small and mid-sized enterprises. This disparity highlights the increasing adoption of managed infrastructure services by smaller organizations. Once priced at USD 250,000 for hardware, bundled Kubernetes clusters, object storage, and managed databases are now available for just USD 4,000 a month, significantly lowering the entry barrier to top-tier resilience. This cost reduction has made advanced infrastructure solutions more accessible to a broader range of businesses, enabling them to compete more effectively in the market.
With small and mid-sized enterprises (SMEs) experiencing an annual churn rate of 18%, service providers are streamlining their onboarding processes to retain customers and improve operational efficiency. By implementing self-service blueprints and chat-based support, they've managed to reduce customer-acquisition payback periods to just 18 months. This shift is steering the managed infrastructure services sector away from its traditional bespoke consulting roots and towards a model reminiscent of software's recurring revenue streams. The transformation not only enhances scalability for providers but also ensures a more predictable revenue flow, aligning the industry with modern business practices.
By End-User Vertical: Healthcare Overtakes BFSI in Modernisation Urgency
In 2025, the BFSI sector held a significant 22.95% revenue share, primarily driven by the widespread adoption of ISO 20022 payment messaging standards and instant-pay systems. These advancements have streamlined payment processes and enhanced operational efficiency within the sector. Meanwhile, the healthcare and life sciences sectors demonstrated remarkable momentum, achieving the fastest growth with an impressive 11.43% CAGR. This growth is attributed to increasing investments in advanced technologies and the rising demand for innovative healthcare solutions. In the U.S., interoperability mandates under the Trusted Exchange Framework are playing a pivotal role in shaping the market. These mandates require the implementation of FHIR APIs, which are essential for managing data-retrieval surges. Such surges often lead to significant traffic bursts, necessitating the deployment of elastic computing capabilities to ensure seamless operations.
The telecom, manufacturing, and retail sectors are also experiencing robust high-single-digit growth rates. This growth is fueled by the integration of predictive analytics and omnichannel strategies, which are enabling these sectors to enhance customer experiences and optimize operational processes. Additionally, government agencies are steadily adopting cloud-first policies, which involve transitioning capital budgets into operating expenses. This shift allows agencies to achieve greater flexibility and scalability while maintaining compliance with strict data-sovereignty standards. These developments underscore the growing emphasis on digital transformation and the adoption of advanced technologies across various sectors.
Geography Analysis
In 2025, North America accounted for 42.53% of global revenue, but its 8.2% CAGR lagged behind the global average due to market saturation squeezing unit prices. The region's performance reflects a mature market where growth is constrained by limited opportunities for significant expansion. Demand in the U.S. is heavily skewed towards financial services, technology, and multi-state healthcare networks, which continue to drive investments in advanced cloud solutions. Meanwhile, Canada is adopting cloud-first initiatives, closely aligning with FedRAMP standards to enhance security and compliance. Additionally, Mexico's nearshoring surge is propelling edge computing, especially near its manufacturing hubs, as companies seek to optimize operations and reduce latency in production processes.
Asia-Pacific is leading the charge with a robust 10.21% CAGR, spurred by sovereign-cloud initiatives in nations like India, Indonesia, and Vietnam. The region's growth is underpinned by increasing digitalization efforts and supportive government policies aimed at fostering local cloud ecosystems. India's Digital Personal Data Protection Act bolsters local providers, paving the way for collaborations with hyperscalers such as Tata Consultancy Services and Wipro, which are leveraging regulatory advantages to expand their market presence. While China, propelled by state-backed expansions from giants like Alibaba Cloud and Huawei, stands as the region's dominant player, Japan and South Korea are banking on managed infrastructure to drive their 5G and Industry 4.0 advancements. These advancements are critical for enabling next-generation technologies and maintaining competitiveness in the global market.
Europe, with an 18.3% revenue share, is witnessing an 8.6% growth rate. The Digital Operational Resilience Act is reshaping the landscape, breaking up lengthy contracts and pushing for multi-cloud strategies that benefit vendor-agnostic players. This regulatory shift is creating opportunities for providers that can offer flexible and interoperable solutions. In Germany, there's a strong emphasis on edge-to-core integration for factory automation, which is essential for enhancing productivity and supporting the country's industrial base. At the same time, the UK is consolidating public-sector workloads, favoring ISO 20000-certified providers through concession frameworks that ensure high standards of service delivery. Meanwhile, the Middle East sees a 9.8% growth, anchored by smart-city initiatives that are transforming urban infrastructure and services. Africa boasts an 11% rise, driven by the expansion of fintech and mobile money platforms, which are increasing financial inclusion across the continent. South America, growing at 9.3%, witnesses banks and e-commerce platforms transitioning to managed cloud services, all under regulations reminiscent of GDPR, which aim to enhance data protection and privacy in the region.

Regulatory Landscape
Managed infrastructure services procurement is increasingly shaped by operational resilience and third-party risk requirements that translate security controls into auditable, contract-enforceable obligations. In the United Kingdom, the Cyber Security and Resilience (Network and Information Systems) Bill progressed to Report Stage in April 2026 and brings medium and large managed service providers and data centers into scope of the NIS Regulations 2018, including registration and material-incident reporting requirements. This change shifts oversight from customer-led assessments to statutory supervision for parts of the managed infrastructure supply chain that support essential services.
Across regions, provider selection and ongoing governance continue to depend on evidence-backed compliance with widely used frameworks and certifications, including ISO/IEC 27001:2022, ISO 27017, and ISO 20000-1, along with jurisdiction-specific expectations such as Germanys C5 for cloud security assurance. In March 2026, AWS European Sovereign Cloud reported SOC 2 and C5 Type 1 attestation milestones alongside multiple ISO certifications, and Equinix received HDS certification (issued March 3, 2026, valid through February 28, 2028) for data center operations management systems, reinforcing how audit artifacts function as market-access credentials in regulated verticals.
Competitive Landscape
In 2025, the top five suppliers, Kyndryl, Accenture, Tata Consultancy Services, DXC Technology, and Capgemini, are projected to command around 28% of the market revenue. This dominance highlights the significant influence these players hold in the market, while also leaving room for a diverse array of regional specialists and startups driven by automation. Kyndryl, in a strategic move, has forged a 2024 alliance with AWS, transforming its traditional mainframe engagements into forward-looking hybrid-cloud blueprints. This partnership underscores Kyndryl's commitment to innovation and adapting to the evolving technological landscape. Meanwhile, Accenture, bolstering its capabilities, has integrated Oracle Cloud migration services through its acquisition of Inspirage. This acquisition enhances Accenture's ability to meet the growing demand for cloud migration solutions. In a nod to evolving data-localization laws, Tata Consultancy Services has crafted a 2026 sovereign-cloud framework, deepening its ties with Indian public-sector clients. This framework not only addresses regulatory requirements but also strengthens Tata Consultancy Services' position in the public sector.
Hyperscalers are now stepping into direct competition, with offerings like AWS Managed Services, Azure Managed Applications, and Google Cloud’s managed Active Directory. These services bundle tooling, networking, and operational support, often at prices that challenge the norms of traditional cost-plus contracts. By integrating these capabilities, hyperscalers are redefining the competitive landscape and setting new benchmarks for service delivery. New entrants like Aiven and Cockroach Labs are carving out a niche by providing managed open-source data services, effectively mitigating the risks of vendor lock-in. These emerging vendors are capitalizing on market gaps and offering solutions that cater to specific needs, further intensifying competition. Established providers are setting themselves apart through vertical compliance, innovative carbon-linked pricing, and comprehensive observability pipelines that prioritize business metrics over mere server uptime. These differentiators are becoming critical as businesses increasingly demand solutions that align with their operational goals and sustainability objectives.
Shifting the paradigm, outcome-based agreements now favor billing models centered on shared savings or resilience credits. This evolution rewards providers who embed automation deeply into their services, while those reliant on manual processes face penalties. These agreements reflect a growing emphasis on efficiency and measurable outcomes, encouraging providers to innovate and optimize their offerings. As standards like ISO 20000 and ITIL 4 become baseline expectations, firms are pivoting towards developing proprietary solutions in areas like orchestration, telemetry, and policy automation, moving away from traditional staff augmentation strategies. This shift highlights the industry's focus on intellectual property and advanced technologies as key drivers of competitive advantage in the evolving market landscape.
Managed Infrastructure Services Industry Leaders
Dell Technologies Inc.
Hewlett Packard Enterprise
Cisco Systems, Inc.
International Business Machines Corporation
Fujitsu Limited
- *Disclaimer: Major Players sorted in no particular order

Market Opportunities and Future Outlook
AI infrastructure build-outs and sovereign-cloud programs are expanding whitespace for managed infrastructure services that combine hybrid operations, security controls, and lifecycle automation into outcome-based contracts. In India, large-scale data center investment announcements in June 2026 by Amazon (additional USD 13 billion to expand AWS capacity in Mumbai and Hyderabad through 2030) and AirTrunk (USD 30 billion commitment for 5GW of AI data center capacity by 2030, including a 3GW project in Maharashtra) increase the installed base of infrastructure that requires 24x7 operations, observability, and compliance-aligned runbooks. This environment supports growth in platform-led service models that standardize provisioning, patching, configuration drift control, and cost governance across cloud, colocation, and edge sites.
M&A and platform roll-ups are also creating room for providers to package AI operations and workplace-to-data-center support under unified managed-service catalogs, addressing the skills gap highlighted in infrastructure and security practices. Cognizants April 2026 agreement to acquire Astreya positions AI-first managed services as a differentiated delivery model for enterprises scaling AI beyond pilots, while I Squared Capitals May 2026 acquisition of 10 data center facilities from Cogent for USD 225 million (plus an additional USD 1 billion committed for upgrades and expansion) points to intensified focus on AI inference-ready facilities that depend on standardized operations and resilience. For buyers constrained by data sovereignty, opportunities center on sovereign-cloud frameworks, localized control planes, and audit-ready evidence management that reduce friction in regulated migrations without forcing single-vendor lock-in.
Recent Industry Developments
- May 2026: Dell Technologies entered into a USD 1.6 billion purchase agreement with IREN Limited to supply air-cooled NVIDIA Blackwell systems for AI cloud contracts deployed at IRENs Childress, Texas campus. The deal links high-density compute supply with managed operations, supporting AI workload delivery models where infrastructure lifecycle management and availability commitments drive recurring revenue.
- January 2026: Tata Consultancy Services launched a Sovereign Cloud Framework with AWS for Indian agencies aligned with the Digital Personal Data Protection Act. The framework supports regulated-sector adoption by pairing data-localization and governance requirements with managed infrastructure operations and standardized controls.
- December 2025: Accenture acquired Inspirage for USD 180 million to bolster Oracle Cloud migration capabilities. The acquisition expands Accenture's ability to attach post-migration managed infrastructure services to application and database modernization programs, reinforcing platform-led hybrid operations.


Research Methodology Framework and Report Scope
Market Definition and Coverage
This market covers third-party, contract-based services used to run, monitor, and manage IT infrastructure for an organization, including core activities like server operations, end-user computing support, and asset and inventory-related infrastructure tasks.
Scope exclusions: We exclude pure software-only licenses and one-time hardware resale that is not bundled as part of a managed service contract.
Segmentation Overview
- By Deployment Model
- On-Premises
- Cloud
- By Service Type
- Desktop and Print Services
- Server Management
- Inventory and Asset Management
- Network and Connectivity Services
- Other Managed Infrastructure Services
- By Organization Size
- Large Enterprises
- Small and Mid-Sized Enterprises
- By End-User Vertical
- Banking, Financial Services and Insurance (BFSI)
- Information Technology and Telecommunications
- Healthcare and Life Sciences
- Manufacturing
- Retail and e-Commerce
- Government and Public Sector
- Other Verticals
- By Geography
- North America
- United States
- Canada
- Mexico
- South America
- Brazil
- Argentina
- Rest of South America
- Europe
- Germany
- United Kingdom
- France
- Italy
- Spain
- Rest of Europe
- Asia Pacific
- China
- Japan
- South Korea
- India
- Australia
- New Zealand
- Rest of Asia-Pacific
- Middle East and Africa
- Middle East
- United Arab Emirates
- Saudi Arabia
- Turkey
- Rest of Middle East
- Africa
- South Africa
- Nigeria
- Kenya
- Rest of Africa
- Middle East
- North America
Data Sources, Market Sizing, and Validation
Desk Research
Desk research was used to set the market boundaries, map common service bundles, and pressure-test regional demand signals before the model was built. We referred to public sources such as the US Bureau of Labor Statistics (IT workforce and wage trends), the US International Trade Commission and customs statistics (technology equipment trade as a direction check), OECD digital economy indicators, NIST guidance notes (controls that influence managed operations), and peer-reviewed journals on IT operations and service management.
Alongside this, we reviewed company filings and earnings decks, contract announcements, association publications, and reputed press coverage to understand how managed contracts are priced and renewed over time. Paid subscriptions were used selectively for company financials and news intelligence, plus patent databases to spot automation themes that can shift delivery cost and pricing. The sources listed above are illustrative only, and many other public and proprietary references were also used for collection, cross-checks, and clarification.
Primary Interviews and Surveys
Primary work focused on validating what gets counted in a managed infrastructure contract and what sits outside it, especially for hybrid environments where responsibilities can be split. We spoke with service providers, channel partners, and enterprise buyers across APAC, EMEA, and the Americas to confirm adoption pace, renewal patterns, and typical pricing moves, and then to close gaps left by public reporting.
Distribution of primary research fieldwork respondents
| Company type | Respondent position | Region |
|---|---|---|
| Top tier: 35% | CXOs: 20% | APAC: 44% |
| Mid tier: 43% | Functional/Unit leaders: 22% | EMEA: 37% |
| Smaller Players: 22% | Managers: 58% | Americas: 19% |
Market-Sizing & Forecasting
Sizing starts with a top-down build where IT outsourcing and infrastructure operations spend is reconstructed by region, and then filtered by the share delivered as ongoing managed contracts across on-premises and cloud environments. Results are corroborated with selective bottom-up approximations, such as sampled contract values by service type, estimated managed endpoints and servers under management, and channel checks on average price per device or per workload, which are then used to tune totals.
The model is informed by practical inputs that can be tracked consistently, including cloud migration pace, the installed base of enterprise servers and endpoints, ticket volumes and tooling-driven automation penetration, service-level expectations (uptime and response windows), and labor availability for infrastructure operations. Where some companies report bundled revenue that mixes adjacent IT services, we separate managed infrastructure using service descriptions, contract language cues, and buyer feedback to reduce double counting.
For forecasting, we rely on scenario analysis supported by regression-based sensitivity checks on a few drivers that show stable links to demand, such as cloud workload growth, enterprise IT spend growth, and compliance pressures that expand monitoring and operations scope. Assumptions that vary most by region, such as pricing escalation and renewal timing, are reviewed with primary respondents so the curve reflects real contract cycles rather than a smooth, unrealistic trend.
Data Validation & Update Cycle
Validation is done in layers so the final values do not depend on any single dataset. We compare model outputs against independent signals, such as reported outsourcing spend direction, cloud adoption indicators, and observed changes in managed contract mix, followed by variance checks across regions and service types to flag unusual jumps.
When anomalies appear, assumptions are revisited, and respondents are re-contacted if a change could be driven by packaging shifts, currency timing, or a one-off contract concentration. Before sign-off, the build is reviewed by another analyst to confirm the math, scope logic, and year-to-year movements. Reports are refreshed annually, with interim updates when material events occur, and a final pre-delivery pass is completed so clients receive the most current view available.
Mordor Intelligence's Infrastructure Managed Services Market Size Versus Other Published Estimates
Published market sizes for infrastructure managed services often vary because the included service bundle is not consistent, and some studies treat related categories as part of the same spend pool. Differences also come from the base year chosen, how currency conversion is timed, and how quickly assumptions are refreshed when cloud adoption and contract terms shift.
The biggest swing factor in this market is whether estimates count only contract-based infrastructure management work, or also include tool and software revenue that supports delivery, plus adjacent security assessment and disaster recovery items. Another driver is pricing logic, where some models apply a uniform ASP uplift, while others tie pricing to labor inflation and automation adoption, which can move realized contract values in different directions by region and renewal cycle.
Benchmark comparison
| Source | Market Size | Gaps in Research Methodology |
|---|---|---|
| Mordor Intelligence | USD 140.32 B (2026) | |
| Industry Database A | USD 149.10 B (2026) | This figure appears to include the value of monitoring and management tools and related software sold within service engagements, and it also groups adjacent activities like security audits and business continuity services under the same market total. |
| Global Consultancy B | USD 44.70 B (2025) | This estimate is materially lower, which is consistent with a narrower counted set of managed infrastructure offerings, and with tighter treatment of bundled contracts that can leave out end-user computing and broader run-and-operate coverage. |
The spread across publishers is mainly explained by what gets counted inside the managed contract bundle and whether enabling tools and adjacent resilience work are included or excluded. With that clarity in place, the number stays traceable to repeatable steps like regional demand pooling, contract mix checks, and pricing validation tied to renewal behavior rather than a single assumed uplift, as reflected in Mordor Intelligence's base approach.


Key Questions Answered in the Report
What is the projected value of the managed infrastructure services market by 2031?
The market is forecast to reach USD 211.02 billion by 2031, up from USD 140.32 billion in 2026.
Which deployment model is growing fastest within managed infrastructure services?
Cloud deployments, already holding 63.14% share in 2025, are expanding at an 8.67% CAGR through 2031.
Why are small and mid-sized enterprises embracing managed infrastructure services?
SMEs benefit from consumption pricing that removes large capital outlays, driving a 9.11% CAGR that outpaces the overall market.
Which end-user vertical shows the highest growth momentum?
Healthcare and life sciences is advancing at an 11.43% CAGR thanks to interoperability mandates and remote-patient monitoring.
Page last updated on:





