
Network Traffic Analysis Market Size and Share
Market Overview
| Study Period | 2020 - 2031 |
|---|---|
| Market Size (2026) | USD 4.91 Billion |
| Market Size (2031) | USD 8.29 Billion |
| Growth Rate (2026 - 2031) | 11.06 % |
| Fastest Growing Market | Asia Pacific |
| Largest Market | North America |
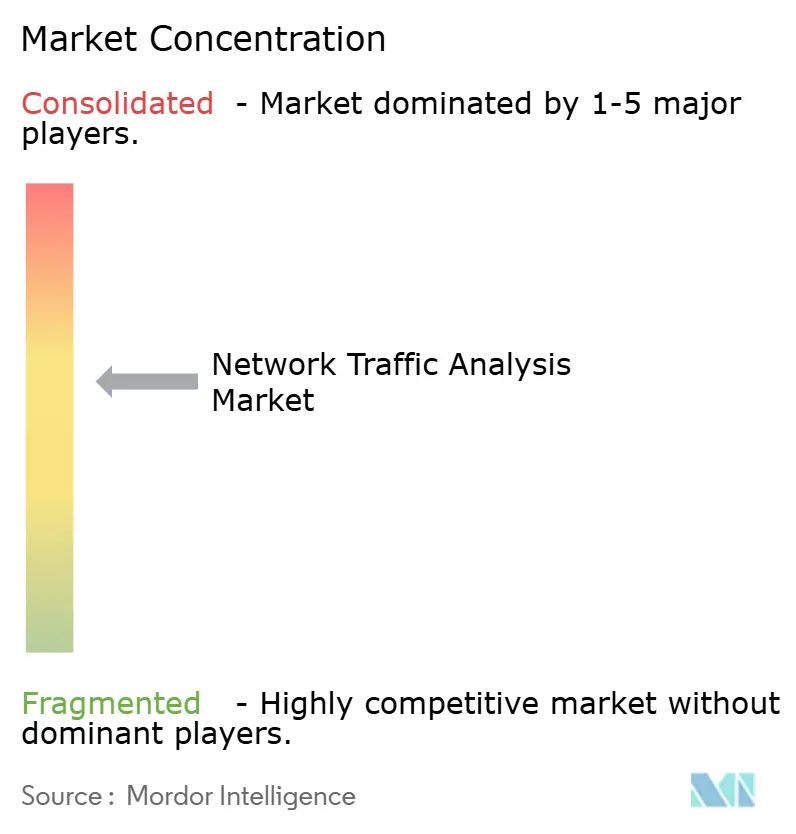
| Market Concentration | Medium |
Major Players *Disclaimer: Major Players sorted in no particular order Image © Mordor Intelligence. Reuse requires attribution under CC BY 4.0. | |
Network Traffic Analysis Market Analysis by Mordor Intelligence
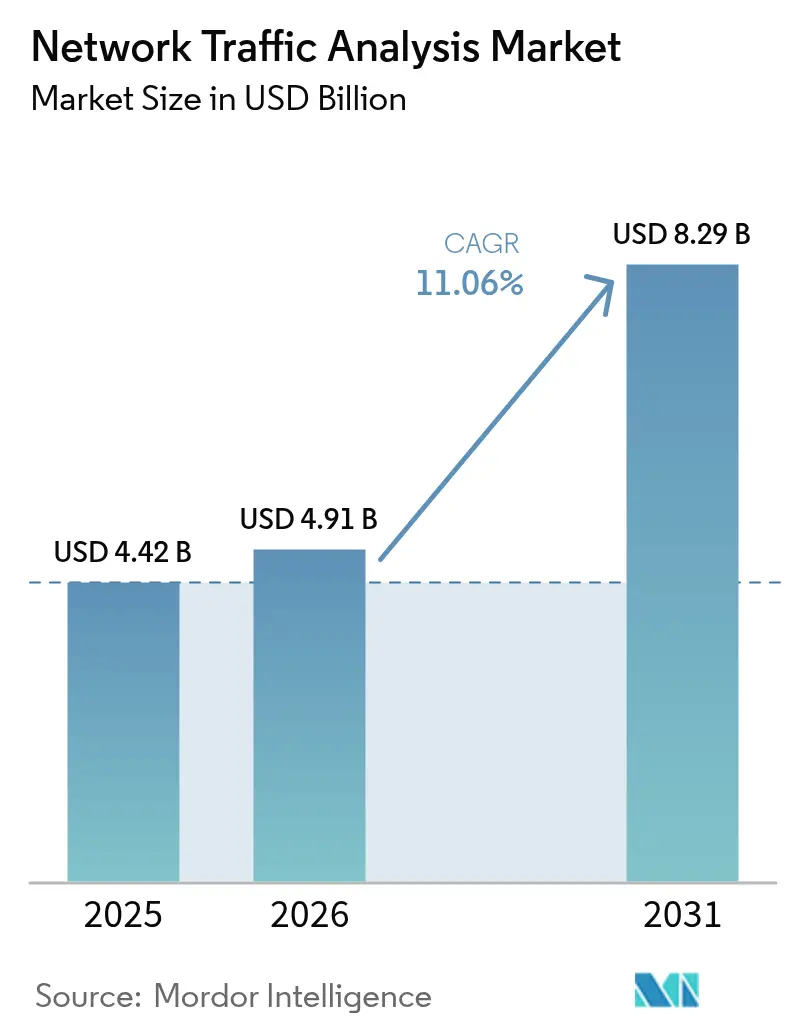
Network Traffic Analysis market size in 2026 is estimated at USD 4.91 billion, growing from 2025 value of USD 4.42 billion with 2031 projections showing USD 8.29 billion, growing at 11.06% CAGR over 2026-2031. Growth reflects the security community’s pivot from perimeter defenses to deep traffic visibility as zero-trust programs, 5G rollouts, and cloud-native workloads muddy traditional boundaries. Enterprises see network telemetry as the single source of truth that can uncover lateral movement, encrypted threats, and performance bottlenecks in a hybrid world. Vendors that marry AI-driven analytics with continuous packet capture are winning mindshare as security teams consolidate point tools, while managed detection and response (MDR) services temper the skills gap in small IT shops. At the same time, platform providers are racing to embed encrypted traffic analytics and east-west inspection to keep pace with TLS 1.3 adoption and microservices proliferation.
Key Report Takeaways
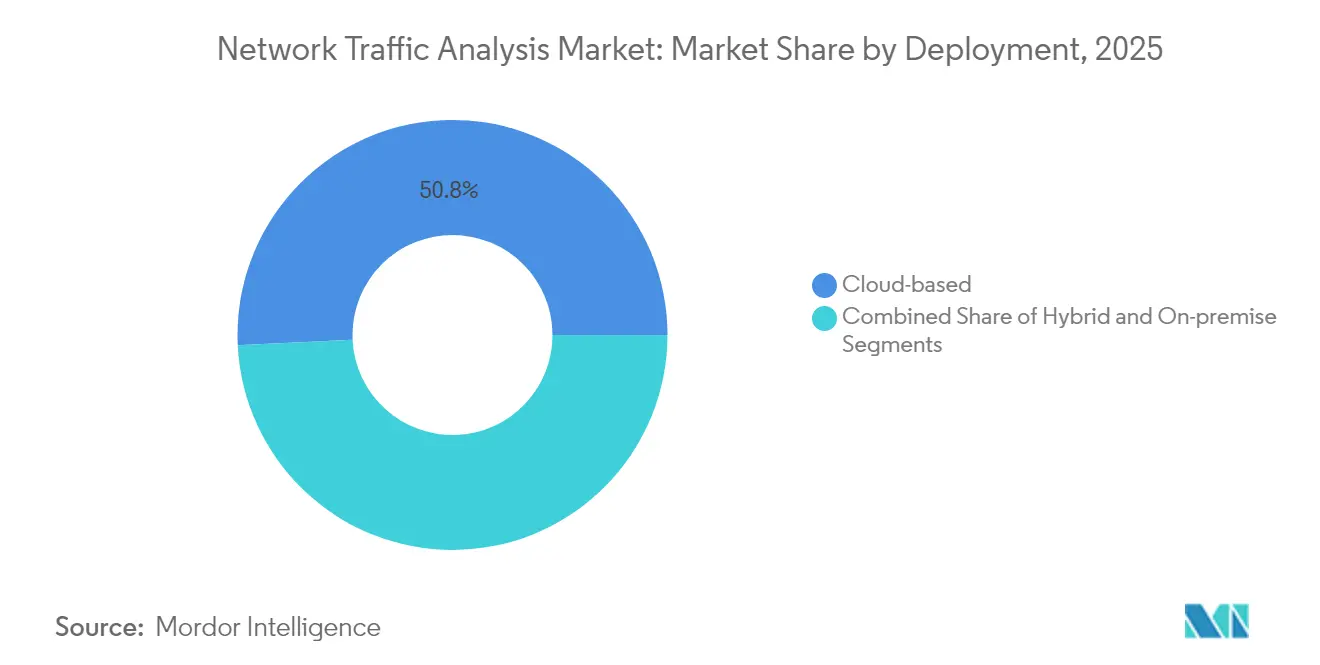
- By deployment, cloud-based models lead with 50.76% revenue share in 2025, while hybrid deployments are forecast to post the fastest 13.53% CAGR through 2031.
- By component, solutions captured 61.85% of the market in 2025; services are projected to grow the quickest at a 14.32% CAGR to 2031.
- By organization size, large enterprises held 60.48% market share in 2025, yet small and medium enterprises are poised for the highest 14.56% CAGR during the forecast period.
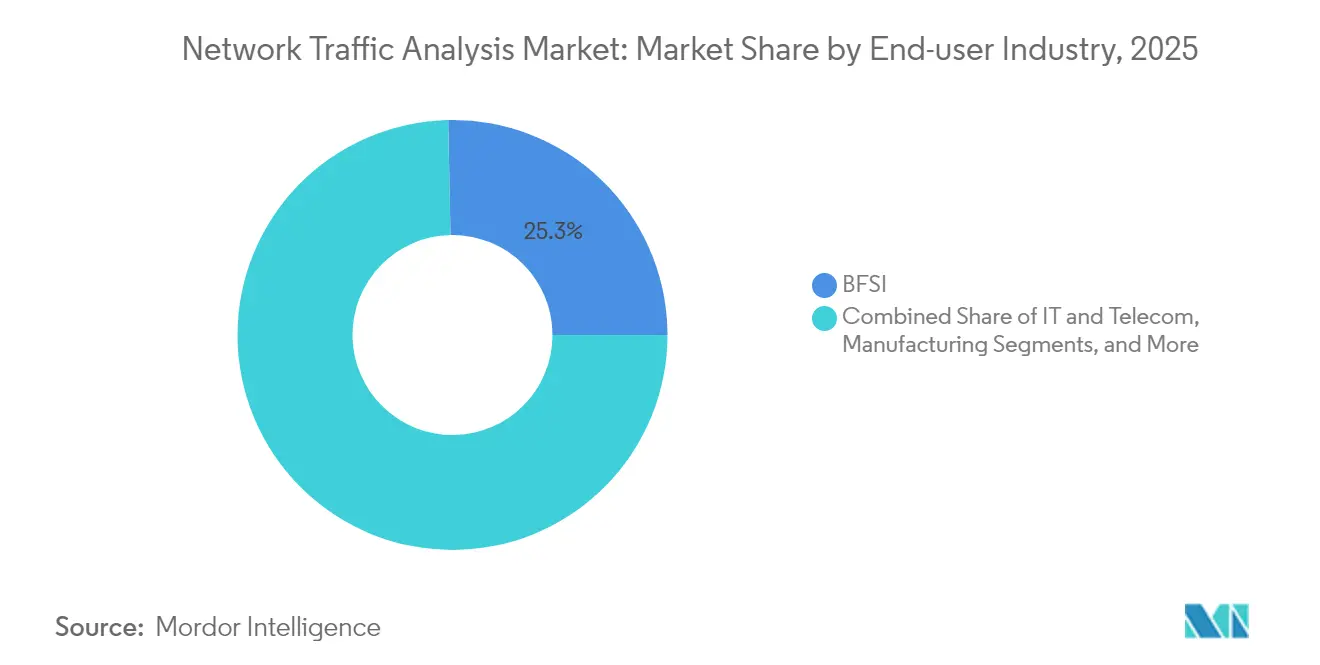
- By end-user industry, the BFSI sector accounted for 25.32% of 2025 revenue, whereas manufacturing is set to advance at a 12.92% CAGR to 2031.
- By application, security and threat detection commanded a 31.86% share in 2025, while performance monitoring and optimization is expected to register the fastest 13.56% CAGR.
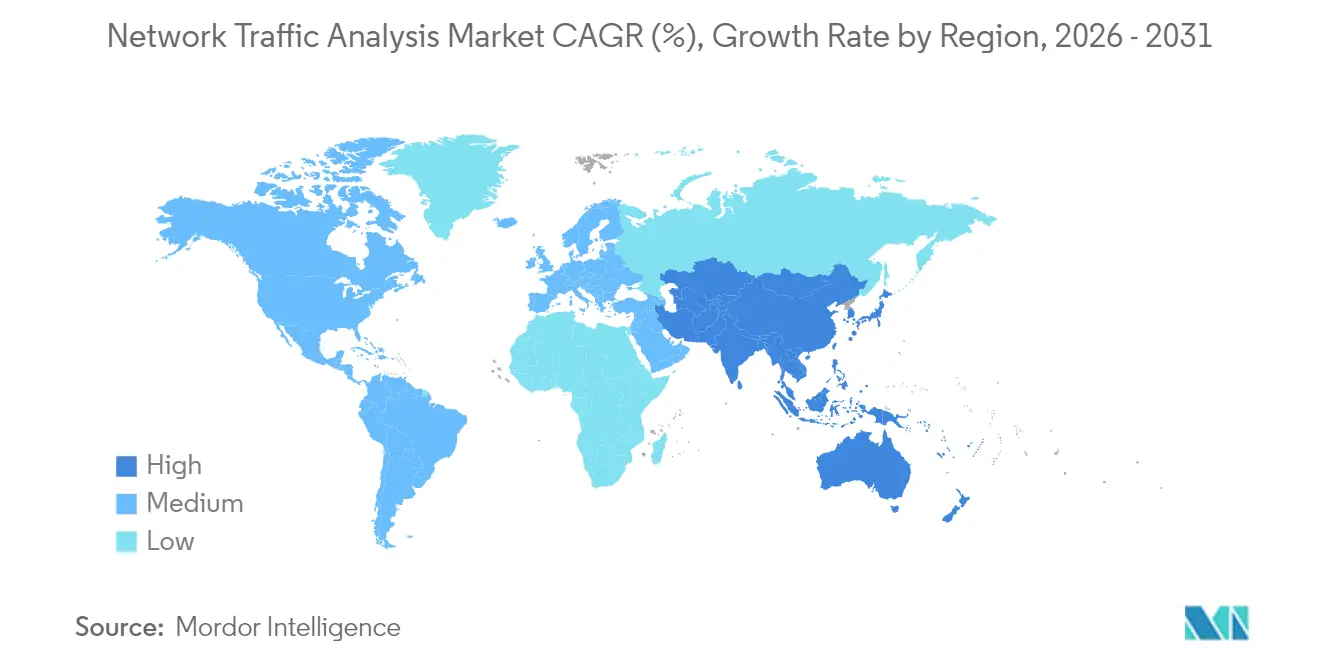
- By geography, North America retained 33.62% market share in 2025, and Asia-Pacific is projected to record the strongest 14.08% CAGR through 2031.
Note: Market size and forecast figures in this report are generated using Mordor Intelligence’s proprietary estimation framework, updated with the latest available data and insights as of 2026.
Market Trends and Insights
Drivers Impact Analysis of Network Traffic Analysis Market*
| Driver | (~) % Impact on CAGR Forecast | Geographic Relevance | Impact Timeline |
|---|---|---|---|
| Emergence of NTA as cornerstone in modern security stacks | +2.1% | Global, early adoption in North America and EU | Medium term (2-4 years) |
| Expanding network bandwidth and 5G rollouts create visibility gaps | +1.8% | APAC core, spill-over to North America | Short term (≤ 2 years) |
| Migration to cloud and hybrid architectures boosts demand for cloud-native NTA | +2.3% | Global, led by North America and Europe | Medium term (2-4 years) |
| Encrypted traffic ML-based inspection requirements | +1.6% | Global, regulatory drivers in EU and North America | Long term (≥ 4 years) |
| Zero-trust east-west traffic proliferation | +1.9% | Global, enterprise-focused adoption | Medium term (2-4 years) |
| SOC consolidation pushing NTA/NDR convergence | +1.5% | North America and EU, expanding to APAC | Short term (≤ 2 years) |
| Source: Mordor Intelligence | |||
Emergence of NTA as Cornerstone in Modern Security Stacks
Seventy percent of advanced persistent threats rely on lateral movement, detectable primarily through granular traffic analytics, prompting security teams to elevate NTA from a nice-to-have tool to a foundational control. [1]National Security Agency, “Advancing Zero Trust Maturity Throughout the Network and Environment Pillar,” media.defense.gov Tightly coupling packet analytics with SIEM and XDR cuts mean time to detect by up to 30% relative to siloed tools. Unified telemetry also trims correlation workloads 40–50%, freeing scarce analysts to focus on triage rather than data wrangling. Vendors that deliver open APIs and cloud-scale data lakes now underpin many zero-trust programs, positioning NTA as the fabric that underlies endpoint, identity, and cloud defenses. As a result, platform-first buying behavior is shifting budget from stand-alone probes toward integrated SaaS analytics.
Expanding Network Bandwidth and 5G Rollouts Create Visibility Gaps
The jump to 5G introduces ultra-dense cells, distributed user-plane functions, and multi-access edge computing that overwhelm classic taps and span ports. Private 5G outlays in the United States alone are expected to hit USD 3.7 billion by 2027, yet most existing monitoring stacks cannot ingest containerized traffic or detect millisecond-scale anomalies. [2]NETSCOUT, “Assuring Private 5G: Enterprises and CSPs,” netscout.com Service providers partner with security specialists—T-Mobile’s Prisma SASE bundle is a notable example—to pair network slicing with inline threat detection. IoT proliferation further stresses analytics engines because signature-based tools falter against diverse device behaviors, fueling demand for behavior and ML-centric models.
Migration to Cloud and Hybrid Architectures Boosts Demand for Cloud-Native NTA
With 96% of enterprise workloads relocating to public clouds, operations teams need bidirectional visibility across ephemeral assets, microservices, and serverless functions. Cloud-native NTA platforms instrument VPCs, containers, and service meshes through lightweight agents or traffic mirroring APIs, then marry that metadata with on-premises flows for a single view. Enterprises that deploy unified dashboards report smoother audits, expedited root-cause analysis, and fewer blind spots when workloads migrate. AI-guided baselining automatically recalibrates thresholds as topology morphs, helping overworked analysts avoid manual tuning.
Zero-Trust East-West Traffic Proliferation
Microservices and API-driven designs push east-west flows to roughly 80% of total traffic, shifting risk from internet ingress to inter-service chatter. Zero-trust segmentation leans on continuous verification that demands packet-level insight, yet decrypting every session is impractical. Modern NTA engines, therefore, combine JA3 fingerprinting, statistical flow analysis, and ML anomaly scoring to flag stealthy movement even when content stays encrypted. Organizations running mature zero-trust frameworks cite 87% cost savings over legacy firewalls while boosting security posture.
Restraints Impact Analysis of Network Traffic Analysis Market*
| Restraint | (~) % Impact on CAGR Forecast | Geographic Relevance | Impact Timeline |
|---|---|---|---|
| Rapid evolution of threats and encryption outpacing tooling | -1.4% | Global, with acute challenges in regulated industries | Long term (≥ 4 years) |
| Shortage of skilled analysts and high solution complexity | -1.7% | Global, particularly acute in APAC and emerging markets | Medium term (2-4 years) |
| Data-privacy regulations restricting deep packet inspection | -1.2% | EU and North America, expanding to APAC | Medium term (2-4 years) |
| Budget reallocation toward endpoint/XDR tools | -0.9% | Global, with emphasis in cost-conscious SME segment | Short term (≤ 2 years) |
| Source: Mordor Intelligence | |||
Rapid Evolution of Threats and Encryption Outpacing Tooling
TLS 1.3 encrypts 95% of web traffic and conceals handshake metadata, thwarting legacy DPI. Features such as Encrypted ClientHello and 0-RTT resumption force vendors to pivot toward side-channel inference that relies on timing, sequence lengths, and traffic morphologies. Research prototypes like multi-instance encrypted traffic transformers hit 99% classification accuracy but demand GPU-class horsepower and data science talent that most IT teams lack. Smaller suppliers struggle with R&D costs, creating potential attrition or acquisition.
Shortage of Skilled Analysts and High Solution Complexity
A global deficit of cyber analysts means many alerts never see human eyes. Manufacturing breach costs rose to USD 5.56 million as lean teams missed lateral movement despite tool investments. Modern NTA stacks spew voluminous telemetry; without contextual enrichment, triage quickly becomes unmanageable. MDR uptake is therefore accelerating, and vendors now blend AI triage with staffed SOCs to bridge the talent gap.
*Our forecasts treat driver/restraint impacts as directional, not additive. The impact forecasts reflect baseline growth, mix effects, and variable interactions.
Network Traffic Analysis Market Segment Analysis
By Deployment:
Hybrid Flexibility Gains MomentumCloud deployments controlled 50.76% of 2025 revenue, underscoring preference for elastic SaaS analytics that shift capex to opex. The hybrid model is the growth pacesetter, registering a 13.53% CAGR through 2031 as enterprises knit legacy data centers with AWS, Azure, or GCP estates. That blend ensures compliance with data-residency rules while sustaining cloud agility. Zscaler’s Traffic Capture service showcases how cloud platforms can export raw traffic to analytics pipelines without saturating on-premises capture appliances.
Enterprises adopting hybrid architectures report lower hardware refresh spend and faster rollout of new inspection features because upgrades are deployed centrally. On-premises probes persist in air-gapped or highly regulated verticals, yet their share of the network traffic analysis market steadily recedes as regulations embrace cloud certification frameworks. Hybrid adoption consequently propels overall network traffic analysis market expansion into greenfield midsize companies that lacked enterprise-class tooling.



By Component:
Services Rise on MDR DemandSolutions—appliances, virtual sensors, and SaaS consoles—represented 61.85% of the network traffic analysis market size in 2025. However, services are scaling at 14.32% CAGR as organizations offload monitoring and incident response. OPSWAT’s buyout of InQuest illustrates how vendors bundle Deep File Inspection and threat intel with managed offerings to address federal-sector needs.
Managed service uptake is a pragmatic response to analyst scarcity and product complexity. Providers supply 24/7 coverage, curated threat feeds, and automated containment, boosting adoption among resource-constrained firms. Hardware sensors retain relevance in 100 Gbps-plus backbones where FPGA acceleration still outperforms virtual appliances. Even so, vendors increasingly position those sensors as data forwarders feeding cloud analytics.
By Organization Size:
SMEs Close the GapLarge enterprises captured 60.48% revenue in 2025, yet small and medium enterprises logged the fastest growth at 14.56% CAGR. Democratized pricing and simplified SaaS onboarding lower the barrier for firms lacking dedicated SOCs. Fortinet’s small-business firewall line embeds NTA functions that scored 99.88% security effectiveness, proving that enterprise-grade inspection can ship in compact form factors.
Platform vendors now pursue the mid-market aggressively; Palo Alto Networks’ JAPAC initiative tailors bundles that package Prisma SASE with lightweight management to suit minimal IT staff. As ransomware actors increasingly hit midsize manufacturers and professional-services firms, boards fund NTA rollouts to satisfy cyber insurance clauses.
By End-User Industries:
OT-Heavy Sectors AccelerateThe BFSI segment owns a 25.32% share due to real-time fraud analytics and stringent compliance controls. Manufacturing, propelled by Industry 4.0, charts the highest 12.92% CAGR as converged IT/OT systems widen the attack surface. Brisa Bridgestone cut OT security costs 30% and lifted team productivity by 20% after deploying a unified NTA-driven platform that spans factories and HQ networks.
Energy, telecom, and government segments steadily expand given critical-infrastructure mandates. Healthcare favors passive monitoring to protect patient data and avoid latency, while retail pursues traffic analytics for PCI compliance and omnichannel uptime.
By Application:
Performance Monitoring Joins SecuritySecurity and threat detection still accounts for 31.86% of 2025 revenue, yet performance optimization usage is climbing at 13.56% CAGR. Airlines, telcos, and e-commerce operators harness packet analytics to cut outage duration; Alaska Airlines trimmed mean time to detect to under 10 minutes and halved outages with full-stack network monitoring.
Compliance auditing and policy enforcement represent steady revenue streams as frameworks such as GDPR and CCPA require data-in-motion controls. Capacity planning leverages flow trends to right-size WAN links, helping CFOs justify bandwidth spend. Multifunction NTA dashboards give ops and security teams a common truth source, increasing renewal rates for vendors that supply cross-domain value.
Geography Analysis
North America and APAC Network Traffic Analysis Market
North America contributed 33.62% of 2025 revenue thanks to strict privacy statutes, early zero-trust adoption, and high cybersecurity budgets. JPMorgan’s AI-infused fraud system illustrates regional appetite for packet-driven analytics that accelerate threat identification 300-fold and save USD 200 million annually. State governments likewise embrace observability; Indiana improved citizen services after deploying traffic analytics across multi-cloud infrastructure. Asia-Pacific is the high-growth engine with a 14.08% CAGR. Massive 5G rollouts in China, India, and South Korea, combined with smart-city investments and rising ransomware incidents, spur NTA adoption. Local regulations such as China’s Cybersecurity Law and Australia’s Critical Infrastructure Act compel traffic logging and anomaly detection. Manufacturers digitizing shop floors with private cellular networks need granular monitoring to secure OT and IT convergence.
EMEA and LATAM Network Traffic Analysis Market
Europe maintains robust demand owing to GDPR’s breach notification requirements and emerging AI legislation that mandates algorithmic transparency. Sovereign-cloud initiatives push hybrid deployments so packets stay in-region, benefitting vendors that provide fine-grained data-residency controls. Latin America and the Middle East and Africa remain nascent but promising: Brazilian banks, Saudi smart-city projects, and South African telcos are piloting AI-fueled NTA in anticipation of stricter cyber mandates.

Regulatory Landscape
Network traffic analysis deployments are increasingly shaped by security, privacy, and critical-infrastructure compliance that requires continuous monitoring while limiting deep inspection. In the European Union, the NIS2 framework and related implementing measures reinforce obligations for monitoring and logging network traffic to detect anomalous patterns, which is pushing buyers toward auditable telemetry pipelines and documented incident-response workflows.
In 2026, public-sector actions also tightened expectations for network and service-provider assurance. The White House issued NSPM-12 (June 2026) to set cybersecurity governance for National Security Systems, including requirements that affect cloud service providers supporting those systems, while the FCC adopted rules (April 2026) requiring certain license and authorization holders to attest to foreign adversary control status. Standards activity supports traffic integrity and visibility as well, including NIST work published in May 2026 evaluating source address validation (SAV) policies and NIST SP 1800-37 on practical considerations for traffic visibility in modern encrypted environments, including TLS 1.3.
Value Chain Analysis
The network traffic analysis value chain covers packet and flow data generation (taps, SPAN or mirroring, virtual sensors, and cloud traffic-mirroring APIs), high-throughput capture and preprocessing (deduplication, filtering, enrichment, and where permitted, decryption), analytics and storage (NTA/NDR/observability platforms and data lakes), and downstream consumption through SOC and NOC workflows, including managed services. Upstream dependencies include silicon, NICs, storage, and specialized acceleration in high-speed environments, while midstream participants include platform software developers and dataset providers that package normalized flow or packet evidence for AI-driven detection and investigation.
Recent vendor moves point to closer coupling between network intelligence data sources and operational platforms. Niagara Networks launched a 600 Gbps network intelligence appliance (May 2026) that emphasizes TLS 1.3 handling, packet deduplication, and NetFlow or IPFIX generation for feeding analytics at scale, and NetQuest introduced hyperscale real-time network intelligence datasets (March 2026) aimed at AI-driven cyber threat detection. On the distribution and integration side, Infoblox agreed to acquire Kentik (July 2026) to combine DNS or DDI context with real-time network observability, while Plixer 19.8 (July 2026) expanded flow-record investigation to external AI tools via Model Context Protocol (MCP), increasing SIEM and XDR and enterprise AI integrations around NTA telemetry.
Competitive Landscape
Market consolidation is intensifying, yet the field remains moderately concentrated. Cisco’s USD 28 billion splurge on Splunk brings deep observability into its security stack, while Fortinet’s Lacework acquisition folds cloud app protection into its portfolio. Zscaler’s planned USD 900 million purchase of Red Canary signals a rush to pair threat analytics with MDR expertise.
Established players—Cisco, Palo Alto Networks, Fortinet, NETSCOUT—compete on breadth, performance, and AI cadence. Specialist vendors such as ExtraHop and Flowmon differentiate through real-time behavioral analytics. New entrants leverage machine learning on encrypted flows without decryption, promising privacy compliance at scale. Competitive vectors include packet-to-process correlation, cloud-native sensor footprint, and integration depth with IT operations tools.
Patent filings center on ML feature extraction for TLS 1.3 and QUIC flows, underscoring the race to stay effective despite pervasive encryption. Service-led differentiation is rising; vendors bundle SOC analysts, threat hunting, and remediation runbooks to tackle client skill shortages. Price wars are muted; instead, contracts hinge on outcome metrics like mean time to resolve and percent false positives reduced.
Network Traffic Analysis Industry Leaders
NETSCOUT Systems Inc.
Cisco Systems Inc.
Palo Alto Networks Inc.
SolarWinds Corporation
Kentik Technologies Inc.
- *Disclaimer: Major Players sorted in no particular order
Network Traffic Analysis Market Companies Covered in this Report
- NETSCOUT Systems Inc.
- Cisco Systems Inc.
- Palo Alto Networks Inc.
- SolarWinds Corporation
- Kentik Technologies Inc.
- Dynatrace LLC
- ExtraHop Networks Inc.
- Flowmon Networks A.S. (Progress)
- GreyCortex s.r.o.
- Genie Networks Ltd.
- ManageEngine (Zoho Corp.)
- Plixer LLC
- Nagios Enterprises LLC
- Gigamon Inc.
- Corelight Inc.
- Vectra AI Inc.
- Ixia (Keysight Technologies Inc.)
- Riverbed Technology LLC
- Nozomi Networks Inc.
- Nokia Corporation

Market Opportunities and Future Outlook
A core opportunity area is compliance-aligned traffic visibility that delivers audit-ready monitoring without depending on broad decryption, which aligns with privacy constraints and critical-infrastructure obligations. In Europe, NIS2-driven requirements for monitoring and logging, along with the EU proposal commonly referenced as a Cybersecurity Act 2 initiative (COM/2026/13), keep certification and incident-reporting alignment on procurement checklists. In the United States, NSPM-12 (June 2026) raises cybersecurity governance expectations for National Security Systems and their supporting cloud services, reinforcing demand for verifiable telemetry collection, incident evidence retention, and integration into standardized response playbooks.
Another visible whitespace is operationalizing NTA data for AI-assisted investigations and cross-domain workflows across SOC and NOC functions, where buyers want packet and flow evidence alongside DNS and identity context through common interfaces. Plixer 19.8 (July 2026) enabling Model Context Protocol connections to tools such as Claude and enterprise ChatGPT is one concrete example of NTA platforms being positioned as machine-queryable evidence stores, while Infoblox's agreement to acquire Kentik (July 2026) highlights platform convergence that links DNS or DDI control planes with network observability and traffic intelligence in hybrid and multi-cloud environments. High-throughput environments also support product and services opportunities in preprocessing and smart-data reduction, backed by Niagara Networks' 600 Gbps network intelligence platform (May 2026), which packages TLS 1.3 handling and flow generation to make downstream analytics more scalable.
Recent Industry Developments in Network Traffic Analysis Market
- July 2026: Infoblox announced a definitive agreement to acquire Kentik, bringing network intelligence and observability into its DNS/DDI and asset-visibility stack. The combination connects authoritative DNS context with real-time traffic telemetry across hybrid and multi-cloud environments, supporting consolidated monitoring and faster investigations from fewer consoles.
- May 2026: Niagara Networks launched the ePacketron 5520 appliance positioned as a 600 Gbps network intelligence platform with capabilities that include TLS 1.3 decryption, packet deduplication, and NetFlow/IPFIX generation. This expansion targets high-speed backbones where software-only sensors struggle, and it feeds NTA/NDR pipelines with preprocessed data at line rate.
- October 2024: BlueCat sought to acquire LiveAction, aiming to expand its network management footprint with packet analytics and traffic visibility capabilities. The move highlighted ongoing consolidation between network management and traffic-analysis tooling as buyers favor integrated platforms over stand-alone probes.


Network Traffic Analysis Market Report Scope and Research Methodology
Market Definition and Coverage
This market covers tools and services used to capture, inspect, and analyze network data flows so organizations can improve performance, visibility, and threat detection across enterprise and service-provider environments.
Scope exclusions: It excludes general endpoint security, generic SIEM not used for traffic-level analysis, and standalone network hardware unless it is bundled and priced as part of an NTA offer.
Segments Covered in This Report
- By Deployment
- On-premise
- Cloud-based
- Hybrid
- By Component
- Solutions
- Hardware Appliances
- Virtual Appliances
- SaaS Platform
- Services
- Professional Services
- Managed Services
- Solutions
- By Organization Size
- Large Enterprises
- Small and Medium Enterprises (SMEs)
- By End-user Industry
- BFSI
- IT and Telecom
- Government and Defense
- Energy and Utilities
- Retail and E-commerce
- Healthcare and Life Sciences
- Manufacturing
- Other End-user Industries
- By Application
- Security and Threat Detection
- Performance Monitoring and Optimization
- Compliance and Policy Enforcement
- Capacity Planning and Forecasting
- By Geography
- North America
- United States
- Canada
- Mexico
- South America
- Brazil
- Argentina
- Chile
- Rest of South America
- Europe
- Germany
- United Kingdom
- France
- Italy
- Spain
- Russia
- Rest of Europe
- Asia-Pacific
- China
- India
- Japan
- South Korea
- Malaysia
- Singapore
- Australia
- Rest of Asia-Pacific
- Middle East and Africa
- Middle East
- United Arab Emirates
- Saudi Arabia
- Turkey
- Rest of Middle East
- Africa
- South Africa
- Nigeria
- Rest of Africa
- Middle East
- North America
Data Sources, Market Sizing, and Validation
Desk Research
Desk research starts with building a clean view of the demand pool and the technology stack that creates measurable traffic. We typically pull public signals such as cybersecurity incident statistics and advisories from public agencies like CISA and NIST, internet and traffic measurement publications from sources such as ITU and OECD, and telecom and spectrum indicators from sources such as the FCC and national telecom regulators.
To anchor commercial reality, we also refer to company annual reports, earnings call transcripts, investor decks, and product documentation that clarifies packaging and deployment patterns in network traffic analysis. Patent databases are used to sanity-check feature direction, for example encrypted traffic analytics and behavioral detection, and a news and financials subscription helps track funding, M&A, and contract wins that can shift share. These examples are not exhaustive, and many other public sources were reviewed to collect, validate, and clarify inputs.
Primary Interviews and Surveys
Primary work is used to confirm what gets counted as network traffic analysis in real buying cycles, and to test pricing and adoption assumptions against what practitioners see in network environments. We speak with a mix of solution providers, channel partners, service providers, and enterprise users across major regions so gaps from desk inputs can be filled and then checked again before finalizing totals.
Distribution of primary research fieldwork respondents
| Company type | Respondent position | Region |
|---|---|---|
| Top tier: 27% | CXOs: 15% | APAC: 47% |
| Mid tier: 56% | Functional/Unit leaders: 30% | EMEA: 31% |
| Smaller Players: 17% | Managers: 55% | Americas: 22% |
Market-Sizing & Forecasting
Sizing starts from a top-down demand-pool build where enterprise network footprint growth and security monitoring needs are translated into spending for traffic capture, analysis, and related services. We map this using practical inputs, such as enterprise IT and security spend direction, cloud workload and data-center traffic growth, encrypted traffic share and visibility tooling needs, telecom and managed network adoption, and regulatory pressure tied to breach reporting and critical infrastructure.
Those totals are then corroborated using selective bottom-up approximations, including sampled vendor price ranges by deployment type, channel checks on typical contract sizes, and limited roll-ups for visible supplier revenues where disclosure is clear. Where a provider bundles NTA inside a broader suite, we apply allocation rules based on interview feedback and product packaging evidence, and we document any gap handling so the model can be replicated. For forecasting, scenario analysis is used, and assumptions are stress-tested against expert views on network complexity, AI-assisted detection uptake, and budget cycles.
Data Validation & Update Cycle
Validation is done in multiple steps so the final number is not driven by a single assumption. Model outputs are compared against independent signals like security spending growth, cloud traffic trends, and public disclosures on monitoring and observability budgets, and large variances are rechecked at the driver level.
Anomalies trigger follow-up with respondents, and then the model is reviewed by another analyst before sign-off so arithmetic and logic issues are caught early. Reports are refreshed annually, and interim updates are done when material events occur, such as major regulatory shifts or step-changes in pricing. Before delivery, a final pass is completed so the latest public updates are reflected in the published view.
Mordor Intelligence's Network Traffic Analysis Market Size Measured Against Other Published Estimates
Published market sizes for network traffic analysis can differ even when they sound like the same topic, because the counting rules are not identical. The largest gaps usually come from what gets included in the product scope, which year is treated as the starting point, and how pricing is moved forward in forecasts.
The main gap comes from whether adjacent network analytics and general observability tools are counted alongside dedicated NTA. In our view, Mordor Intelligence counts only solutions and services that explicitly analyze packet or flow traffic for monitoring, performance, or security outcomes, with 2025 treated as the stated current value and 2026 as the first forecast step.
Benchmark comparison
| Source | Market Size | Gaps in Research Methodology |
|---|---|---|
| Mordor Intelligence | USD 4.42 B (2025) | |
| Industry Research Publisher A | USD 4.52 B (2024) | Uses 2024 as the base year and applies a slower expansion path, and it can also fold broader network analytics and observability spend into the NTA definition, which inflates the addressable pool but reduces like-for-like comparability. |
| Regional Consultancy B | USD 2.32 B (2024) | Often narrows scope to security-led NTA use cases and may exclude performance monitoring and some service revenue, and differences in currency timing and what is treated as SMB adoption can further pull down the starting value. |
The spread across sources is mainly explained by scope choices and base-year alignment, followed by how bundled pricing and services are treated. By keeping inclusion rules tied to traffic-level analysis and then checking the totals against practical deployment and pricing signals, the estimate stays traceable to clear drivers and repeatable steps.


Key Questions Answered in the Report
What is driving the rapid growth of the network traffic analysis market?
Heightened zero-trust adoption, pervasive 5G networks, and migration to cloud-native environments are forcing organizations to gain deeper, real-time visibility into east-west and encrypted traffic, propelling an 11.06% CAGR to 2031.
How large is the network traffic analysis market today?
The network traffic analysis market size stands at USD 4.91 billion in 2026 and is projected to hit USD 8.29 billion by 2031.
Which deployment model is expanding fastest?
Hybrid deployments show the highest momentum at a 13.53% CAGR as firms bridge on-premises assets with public-cloud workloads while meeting residency mandates.
Why are services outpacing product sales?
Managed detection and response offerings address the acute analyst shortage, prompting services to outgrow solutions at 14.32% CAGR.
Which region offers the greatest growth headroom?
Asia-Pacific leads in growth with a projected 14.08% CAGR due to 5G rollouts, smart-city investments, and rising regulatory pressure on critical sectors.
What competitive moves stand out recently?
Cisco’s purchase of Splunk, Fortinet’s takeover of Lacework, and Zscaler’s agreement to acquire Red Canary exemplify strategic consolidation aimed at fusing observability with AI-driven threat detection.
Page last updated on:


 Your data is secure and never sold or shared.


