Market Overview
| Study Period | 2020 - 2031 |
|---|---|
| Market Size (2026) | USD 2.40 Billion |
| Market Size (2031) | USD 3.17 Billion |
| Growth Rate (2026 - 2031) | 5.73% CAGR |
| Fastest Growing Market | Middle East |
| Largest Market | Asia |
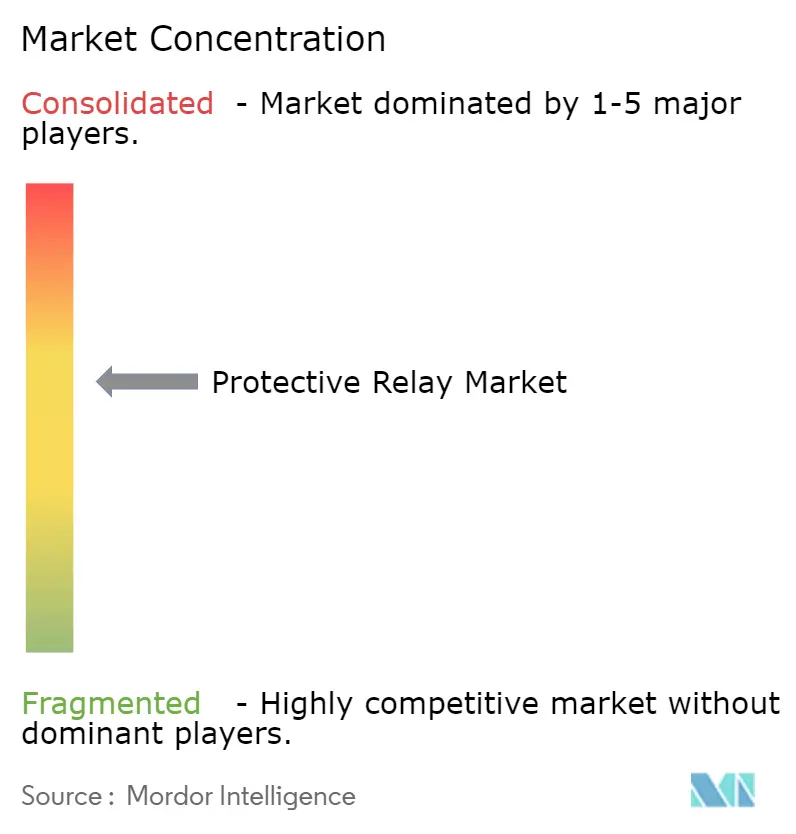
| Market Concentration | Medium |
Major Players *Disclaimer: Major Players sorted in no particular order Image © Mordor Intelligence. Reuse requires attribution under CC BY 4.0. | |
Protective Relay Market Analysis by Mordor Intelligence
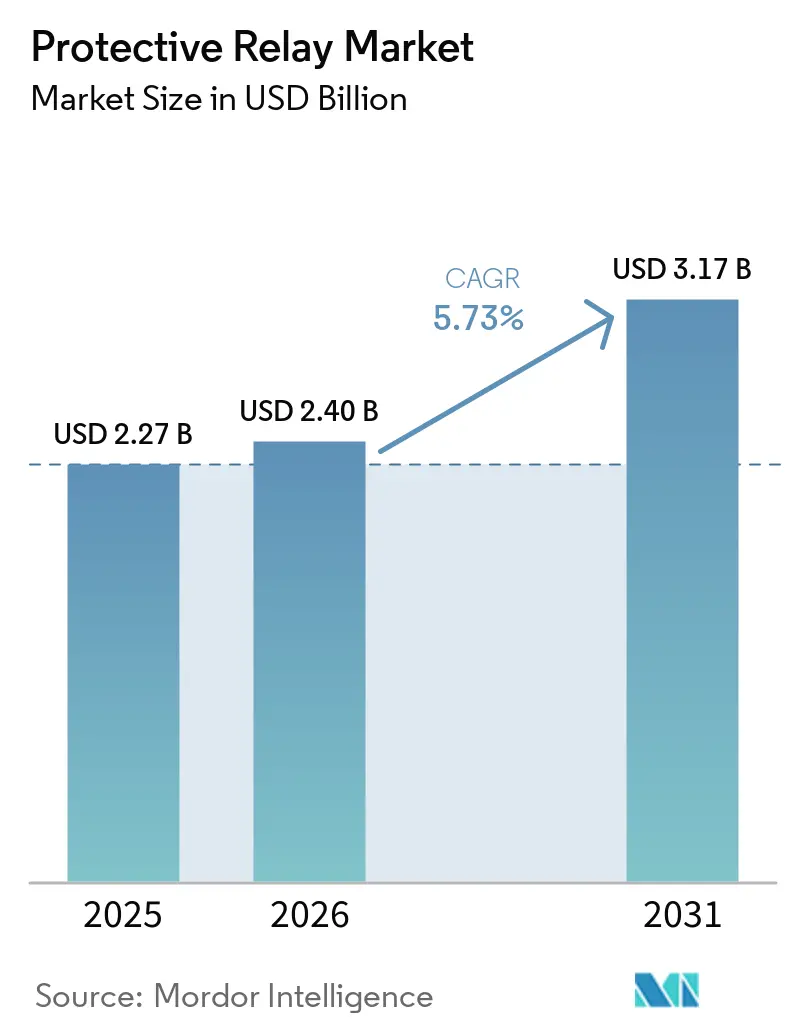
The protective relay market size is expected to grow from USD 2.27 billion in 2025 to USD 2.4 billion in 2026 and is forecast to reach USD 3.17 billion by 2031 at 5.73% CAGR over 2026-2031. Rising grid-modernization capital programs across developed economies, rapid renewable-energy integration, and accelerating digital-substation roll-outs continue to stimulate large-scale deployments of microprocessor-based relays that can manage bidirectional power flows, execute self-diagnostics, and exchange data over IEC 61850 protocols. High-voltage investments, especially China’s ±800 kV UHVDC corridors and North America’s long-haul transmission build-outs, are lifting demand for high-speed distance devices that respond in under two cycles and withstand harsh environments. Meanwhile, utilities and industrial owners are prioritizing retrofit upgrades on aging switchyards where more than 70% of transmission lines exceed 25 years of service, creating a sizeable aftermarket for drop-in digital replacements. Finally, cybersecurity mandates such as NERC CIP in North America and NIS-2 in Europe are reshaping product specifications toward embedded intrusion detection and secure firmware, giving vendors with strong software capabilities a competitive advantage.
Key Report Takeaways
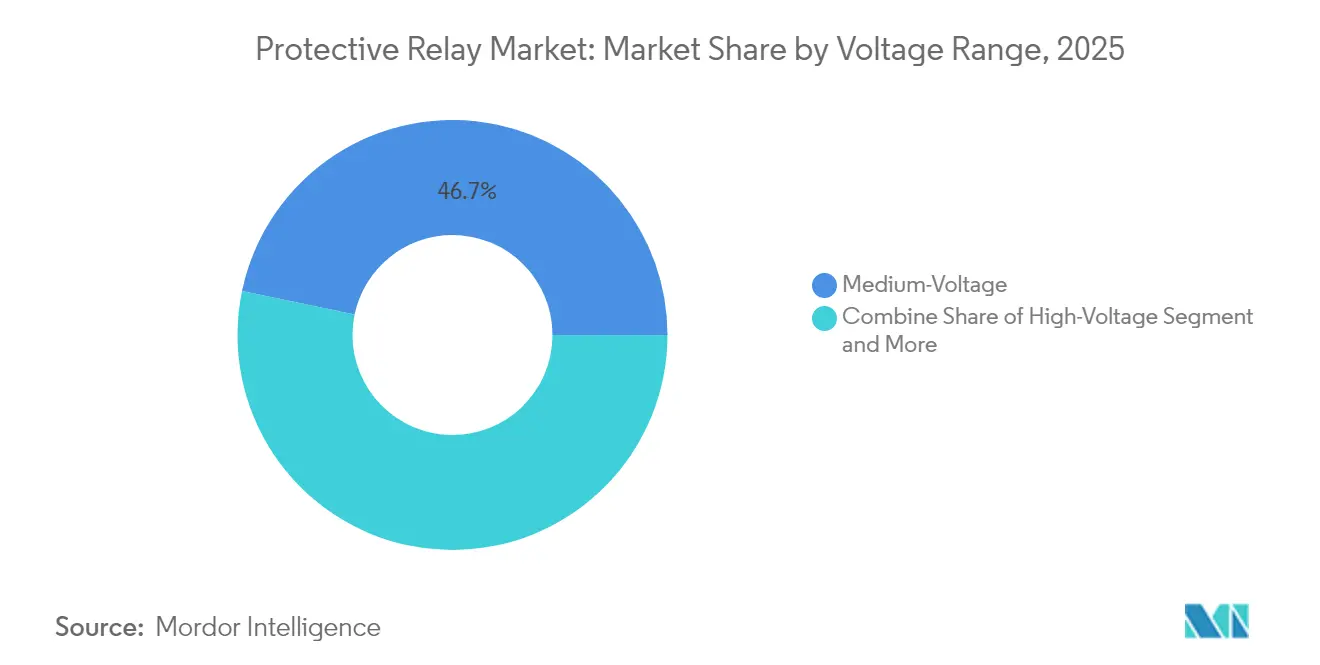
- By voltage range, medium-voltage systems held 46.72% of protective relay market share in 2025, while high-voltage applications are expanding at a 6.78% CAGR through 2031.
- By product type, feeder protection dominated with 27.95% of the protective relay market share in 2025; generator protection is forecast to grow at an 8.1% CAGR to 2031.
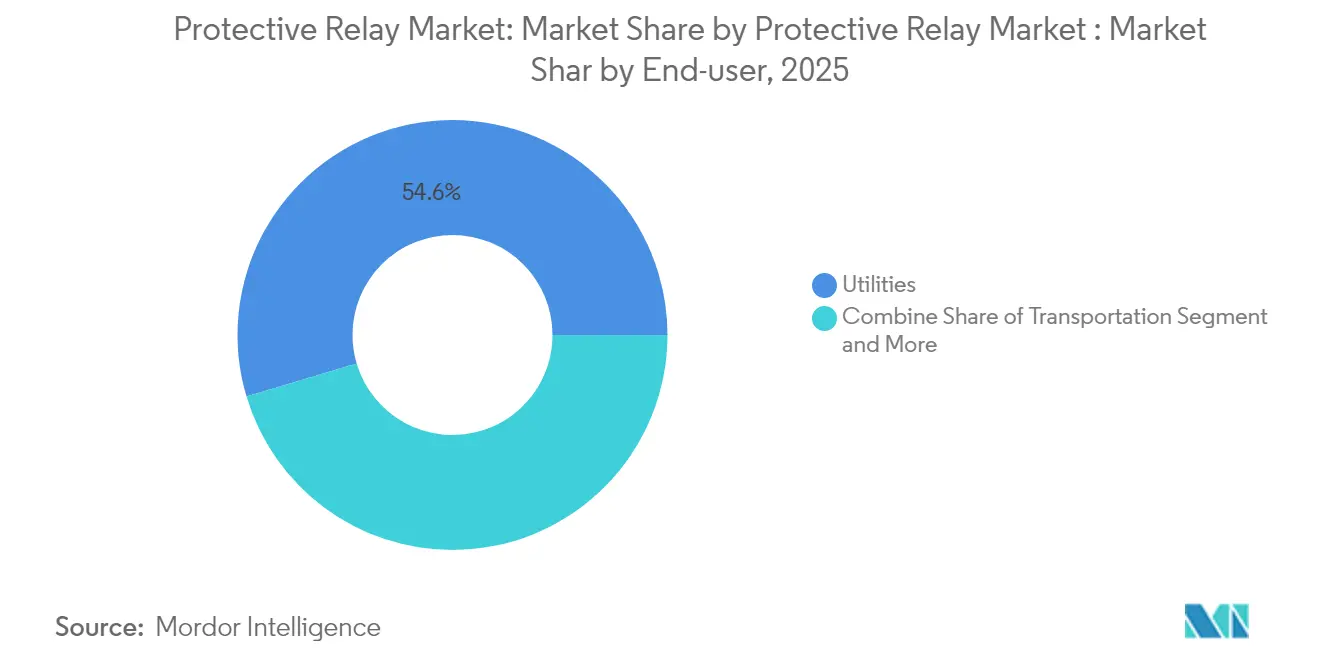
- By end-user, utilities accounted for 54.62% of protective relay market size in 2025, whereas transportation is advancing at a 7.74% CAGR over the forecast period.
- By installation, new-build projects represented 51.38% of the protective relay market size in 2025, but retrofit activity is rising at a 7.38% CAGR as operators modernize legacy assets.
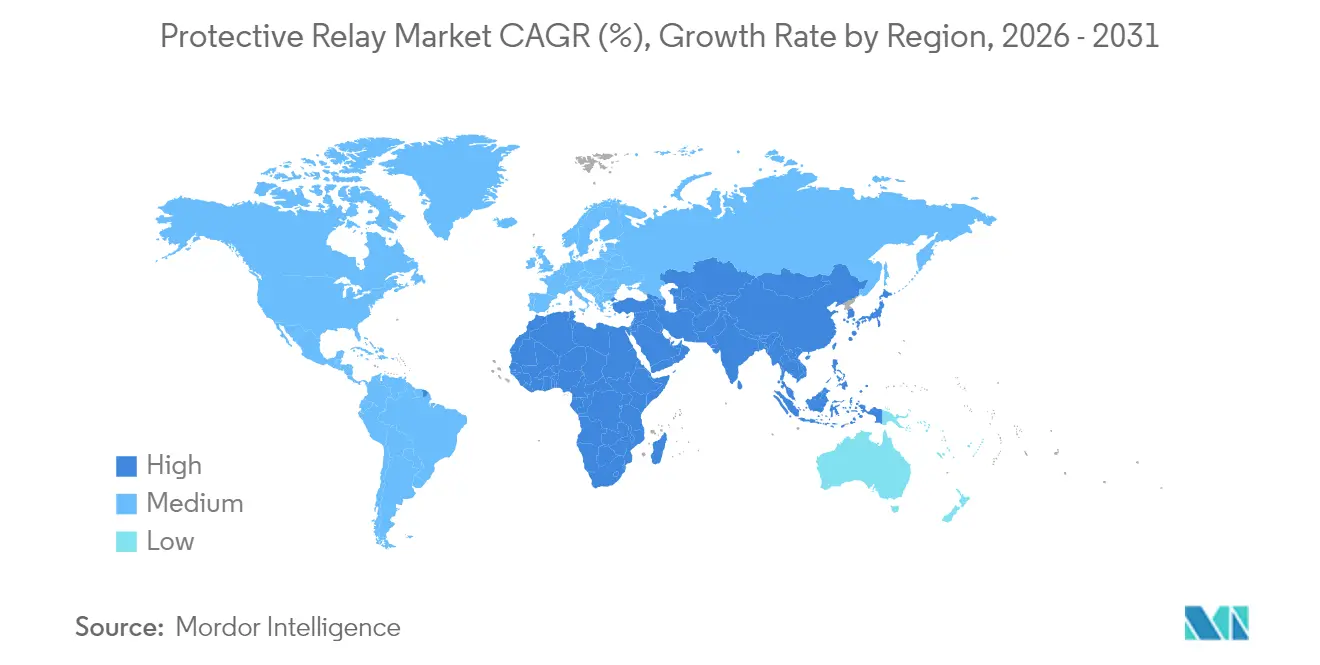
- By geography, Asia-Pacific led with 34.10% of protective relay market share in 2025, and the Middle East is projected to post the fastest 6.7% CAGR through 2031.
Note: Market size and forecast figures in this report are generated using Mordor Intelligence’s proprietary estimation framework, updated with the latest available data and insights as of 2026.
Global Protective Relay Market Trends and Insights
Drivers Impact Analysis*
| Driver | (~) % Impact on CAGR Forecast | Geographic Relevance | Impact Timeline |
|---|---|---|---|
| Grid-modernization investments surging in North America’s T&D infrastructure | +1.8% | North America, spillover to Europe | Medium term (2-4 years) |
| Rapid digital-substation roll-outs across EU to meet Fit-for-55 objectives | +1.2% | Europe, adoption spreading to APAC | Medium term (2-4 years) |
| Renewable-rich micro-grids in Pacific Island nations driving islanding protection demand | +0.4% | Pacific Islands, remote regions globally | Long term (≥ 4 years) |
| Chinese UHV projects necessitating high-speed distance relays | +1.1% | China, Belt and Road markets | Short term (≤ 2 years) |
| Industrial IoT-based predictive maintenance boosting self-diagnostic relays | +0.9% | Global, early adoption in North America and Europe | Medium term (2-4 years) |
| Source: Mordor Intelligence | |||
Grid-modernization investments surging in North America’s T&D infrastructure
Utility capex on United States transmission equipment reached USD 27.7 billion in 2024, almost triple the levels recorded at the start of the last decade, expanding investments across the broader relay market, and the Department of Energy’s Grid Resilience and Innovation Partnerships is allocating USD 2.2 billion to harden networks across 18 states, directly driving new protective relay market deployments.[1]U.S. Energy Information Administration, “Grid Infrastructure Investments Drive Increase in Utility Spending,” eia.gov The National Transmission Planning Study shows required transfer capability must double or triple by 2050, creating sustained demand for devices that coordinate long-distance, low-inertia power corridors.[2]National Renewable Energy Laboratory, “National Transmission Analysis Maps Next Chapter of US Grid Evolution,” nrel.gov With more than 70% of high-voltage lines older than 25 years, utilities are replacing electromechanical relays with numerical units that support synchrophasor inputs and high-speed peer-to-peer messaging for adaptive protection.[3]U.S. Department of Energy, “Biden-Harris Administration Invests $2.2 Billion in the Nation's Grid to Protect Against Extreme Weather,” energy.gov These upgrades are concentrated in renewable-rich regions where variable generation and reverse power flows require distance, under-frequency, and out-of-step functionality in the same housing. As a result, the protective relay market is seeing multi-year framework agreements that bundle hardware, secure firmware, and analytics into performance-based service contracts
Rapid digital-substation roll-outs across EU to meet Fit-for-55 objectives
European network operators are replacing copper-wired secondary systems with fiber-optic process buses, which cut substation construction costs by up to 30% and reduce outage windows during brownfield retrofits. National Grid has committed to 40 fully digital yards over the next decade, illustrating how Fit-for-55 decarbonization targets translate into large orders for protective relays that specify strict IEC 61850 Edition 2 interoperability. Mandated cybersecurity under NIS-2 is increasing demand for relays with hardware-root-of-trust, tenant-based access controls, and encrypted GOOSE messaging, making secure firmware updates a key purchase criterion. In addition, Europe’s rising offshore wind capacity requires differential schemes tuned for long AC export cables that exhibit high capacitance, leading manufacturers to integrate traveling-wave fault location into distance platforms. Manufacturers are integrating traveling-wave fault-location into distance platforms, and vendors able to certify end-to-end solutions from optical current transformers to station-level engineering workstations are capturing a premium on EU green-bond-funded turnkey projects.
Renewable-rich micro-grids in Pacific Island nations driving islanding protection demand
Pacific utilities are building hybrid systems where solar and battery capacity displace diesel gensets that historically provided essential inertia, prompting protection schemes that adapt to low fault levels and frequent mode transfers. Devices must detect islanding within 50 ms and ride through rapid voltage excursions to maintain power quality for desalination plants and telecom links. Adaptive settings groups that switch when renewable penetration crosses 60% are becoming standard as operators seek to maximize fuel savings without compromising reliability. Niche suppliers are launching compact numerical relays with built-in synchro-check, ROCOF, and undervoltage load-shedding logic optimized for micro-grid controllers, carving out a growing slice of the protective relay market. Lessons learned are informing mainland rural electrification programs, broadening the addressable demand for such specialized solutions
Chinese ultra-high-voltage (UHV) projects necessitating high-speed distance relays
State Grid Corporation completed 42 UHV AC/DC projects by late-2024, including the world’s highest UHVDC link that carries hydropower over 1,700 km from the Jinsha River basin, and each scheme specifies distance relays that operate in 1.5 cycles or less. Standardization work on ±800 kV performance margins has codified silicon-carbide arc-suppression technologies and optical sensor inputs, setting new global benchmarks competitors must meet or surpass. Belt and Road markets adopting similar corridors, such as the Pakistan-China HVDC artery, are importing Chinese hardware pre-loaded with bilingual HMI and wide-area control interfaces that support proprietary master-station commands. Consequently, the protective relay market is witnessing accelerated technology transfer that lifts global technical specifications while tightening delivery schedules to align with fast-track EPC contracts
Restraints Impact Analysis*
| Restraint | (~) % Impact on CAGR Forecast | Geographic Relevance | Impact Timeline |
|---|---|---|---|
| Counterfeit low-cost relays flooding emerging Asian markets | –0.8% | Emerging Asia, spillover to Africa and Latin America | Short term (≤ 2 years) |
| Supply-chain lead-time volatility for ASIC and FPGA components | –1.2% | Global, acute in North America and Europe | Medium term (2-4 years) |
| Complex cyber-security certification delays in EU | –0.6% | Europe, similar challenges in North America | Medium term (2-4 years) |
| Skilled workforce gap for IEC 61850 engineering in Africa | –0.4% | Sub-Saharan Africa, other developing regions | Long term (≥ 4 years) |
| Source: Mordor Intelligence | |||
Counterfeit low-cost relays flooding emerging Asian markets
Price-driven procurement in several South and Southeast Asian utilities has enabled grey-market vendors to supply devices that visually mimic legitimate units yet fail acceptance tests under multistage faults, undermining grid security and eroding trust in upgrades . China Quality Certification Centre has expanded type-test services to include spectral analysis of printed-circuit materials and destructive firmware audits in an attempt to curb counterfeit influx . However, enforcement remains uneven and utility engineers often lack resources to trace serial numbers back to factory batches, exposing networks to hidden failure modes that can trip large sections of the grid. The resulting reputational risk slows legitimate purchasing cycles and suppresses protective relay market growth until stronger anti-counterfeit frameworks are adopted
Supply-chain lead-time volatility for ASIC and FPGA components
Lead times for high-performance ADCs and SoC FPGAs used in 10-microsecond sampling architectures stretched beyond 52 weeks in 2024-2025, forcing relay manufacturers to carry elevated inventories or redesign boards around alternative silicon that may lack full IEC 61850 stacks. Parallel transformer shortages, with latency reaching 130 weeks, illustrate how component scarcity cascades through the entire protection ecosystem and delays substation energization schedules. Western Area Power Administration recommends multi-vendor qualification and common parts libraries, yet smaller OEMs face balance-sheet constraints that hamper such mitigation, constraining protective relay market deliveries. Firms able to lock long-term wafer allocations or adopt chiplet architectures gain supply resilience and pricing power, but systemic volatility will linger until additional 300 mm capacity comes online after 2026
*Our forecasts treat driver/restraint impacts as directional, not additive. The impact forecasts reflect baseline growth, mix effects, and variable interactions.
Segment Analysis
By Voltage Range: High-Voltage Drives Transmission Expansion
High-voltage devices targeting 100 kV and above delivered the fastest 6.78% CAGR and captured a growing share of the protective relay market in 2026, as China, the United States, and the Gulf Cooperation Council prioritized long-haul corridors that transport renewable energy to load centers. Medium-voltage remains the anchor with 46.72% of the protective relay market share in 2025 because distribution feeders, industrial campuses, and data centers require standardized overcurrent and earth-fault schemes that vendors ship in high volumes. Next-generation distance platforms integrate time-domain traveling-wave and line-differential logic to speed fault clearing on UHVDC lines, while optical current transformers reduce CT saturation risk at high burden, cutting footprint in compact GIS bays.
Enhanced power-quality monitoring bundled with synchrophasor publishing is becoming mandatory on transmission relays so that system operators can flag subsynchronous oscillations from large inverter parks, deepening penetration of multifunction units in the protective relay market. In parallel, low-voltage applications below 1 kV keep a steady demand in building automation, where arc-fault and residual-current functions are integrated into molded-case breakers that ship with embedded Bluetooth commissioning support.


By Product Type: Generator Protection Accelerates with Renewables
Feeder models held 27.95% of protective relay market share in 2025 because utilities deploy thousands of identical units per network, yet generator protection is advancing at an 8.1% CAGR through 2031 as solar PV and battery storage introduce fast-ramping dynamics that challenge legacy negative-sequence and loss-of-field logic. Manufacturers are embedding phase-locked loops that track weak-grid frequency and algorithms that distinguish fault current from inverter control responses, meeting evolving grid codes and securing incremental sales.
Motor, transformer, and busbar relays continue to form a stable mid-tier revenue block, but niche microgrid and process-bus relays featuring IEC 61850 -9-2 sampled-value inputs are emerging in petrochemical and semiconductor fabs seeking fibre-optic galvanic isolation. The protective relay market is therefore bifurcating: volume-driven feeder units optimized for pricing and high-function premium devices aimed at complex generation or process assets.
By End-user: Transportation Sector Electrification Accelerates
Utilities commanded 54.62% of protective relay market size in 2025 because bulk power assets require rigorous redundancy, dual-CPU logic, and remote firmware update channels that only specialized vendors supply. Transportation, led by rail and airport electrification, is expanding at a 7.74% CAGR through 2031 as operators deploy autotransformer feeders, regenerative braking interfaces, and wayside energy storage that need tailored overcurrent and neutral-section protection.
GE Vernova’s 245 kV breakers for Queensland illustrate how large renewable corridors must interact with traction loads, demanding sophisticated system studies that favor premium protective relay market offerings. Industrial users in mining, metals, and chemicals continue to invest in relays with harsh-environment conformal coating and predictive thermal models to reduce maintenance outages and meet safety-integrity-level requirements.
By Installation Type: Retrofit Market Gains Momentum
New-build projects represented 51.38% of the protective relay market size in 2025 as emerging regions expanded grids, yet retrofit activities are growing at a 7.38% CAGR because developed-market operators aim to modernize secondary systems without costly primary-equipment replacement. Utilities deploy drop-in frames that fit legacy cabinets and auto-convert copper wiring to fiber process buses through plug-and-play merging units, cutting commissioning time by 40% and avoiding extended outages.
Brownfield yards are increasingly specifying dual-protocol operation, allowing new digital IEDs to backhaul GOOSE messages while maintaining serial Modbus links to existing RTUs, thereby widening the addressable aftermarket for versatile relay families. Vendors are therefore offering modular IO boards and subscription-based firmware that unlock extra functions post-installation, cultivating an annuity revenue stream within the protective relay market.
Geography Analysis
Asia-Pacific delivered 34.10% of protective relay market share in 2025 as China invested CNY 500 billion (USD 68.5 billion) in UHV transmission and India accelerated renewable integration, prompting relay orders for both distance and differential schemes. Japan’s reconductoring projects and Southeast Asia’s data-center boom added steady medium-voltage demand, while local suppliers leveraged cost advantages and regional manufacturing incentives.
North America remains a technology test-bed where utilities pilot synchrophasor-based adaptive protection and vendor-agnostic process-bus architectures, pushing higher ASPs within the protective relay market. Canada’s hydro-export corridors and Mexico’s cross-border renewable projects further underpin high-voltage deployments. NERC CIP requirements compel purchase of devices with tamper-proof logging and multifactor authentication, raising the software content per unit.
The Middle East is forecast to post the fastest 6.7% CAGR through 2031 as Gulf states commit USD 54 billion for renewable portfolios and smart grid automation, spurring protective relay market growth in solar parks, hydrogen electrolyzers, and HVDC subsea links to trading partners. Dubai’s automatic grid-restoration platform demonstrates regional ambition for fully digital operations that integrate restoration logic into central EMS, elevating relay specification levels. Europe maintains mid-single-digit gains under Fit-for-55, with emphasis on cybersecurity certification and interoperability. South America offers upside tied to wind corridors in Brazil and cross-Andes interconnects but faces currency and political risks that delay approvals.

Competitive Landscape
The protective relay market is moderately fragmented; the top five players account for roughly 45-50% of global revenue, leaving ample share for regional specialists. shifting competition toward integrated platforms that bundle cloud analytics with on-premise IEDs. Siemens' acquisition of Trayer Engineering strengthens medium-voltage outdoor switchgear offerings, ensuring complete feeder-automation packages for utilities upgrading in climate-exposed areas.
Hitachi Energy's alliance with AWS illustrates how tie-ups with hyperscalers accelerate software roadmaps that deliver vegetation-interference prediction and distributed-energy orchestration, creating stickiness in multi-year service contracts. Emerging vendors from China and India are attacking price-sensitive segments with IEC 61850-ready devices that meet baseline cybersecurity but undercut Western incumbents by 20-30%, compelling global brands to localize assembly and partner with EPC firms for supply-chain agility.
Strategic consolidation is expected to intensify as component shortages and cybersecurity R&D costs pressure smaller firms; recent deals such as Power Grid Components–Vizimax highlight interest in niche intellectual property around transformer-inrush mitigation. Vendors offering secure firmware, silicon-level redundancy, and cloud-native APIs stand to capture premium margins, especially where regulations impose network-wide roll-outs on tight compliance deadlines.
Protective Relay Industry Leaders
ABB Ltd.
Schneider Electric SE
Mitsubishi Electric Corporation
Siemens AG
Bender GmbH & Co. KgG
- *Disclaimer: Major Players sorted in no particular order

Recent Industry Developments
- March 2025: Hitachi Energy and Amazon Web Services entered a multi-year collaboration to deliver AI-based vegetation-risk analytics that address the 20% of U.S. outages linked to tree contact.
- January 2025: ABB posted Q4 2024 orders of USD 8.1 billion and revenues of USD 8.6 billion, citing robust data-center and utility demand for electrification and protection products.
- November 2024: GE Vernova won a Powerlink contract to supply 69 dead-tank breakers rated 245 kV+, with deliveries scheduled Aug 2025-Mar 2026 to support renewable integration in Queensland.
- October 2024: Power Grid Components acquired Vizimax, adding point-on-wave energization tech for transformer protection portfolios worldwide.


Research Methodology Framework and Report Scope
Market Definitions and Key Coverage
Our study defines the protective relay market as the annual revenue generated by purpose-built electronic or electromechanical devices that continuously sense current, voltage, frequency, and phase angle on medium- and high-voltage circuits (>=1 kV) and command circuit breakers to isolate faults before equipment damage or service interruption occurs. According to Mordor Intelligence, the scope follows IEC 60255 functional classes and covers products sold for new build as well as retrofit installations across utilities, industrial plants, transport infrastructure, and commercial power systems.
Scope exclusion: miniature plug-in household relays and low-voltage automotive relays are outside this assessment.
Segmentation Overview
- By Voltage Range
- Low-Voltage (Less than 1 kV)
- Medium-Voltage (1-69 kV)
- High-Voltage (Above 69 kV)
- By Product Type
- Transformer Protection Relays
- Feeder Protection Relays
- Motor Protection Relays
- Generator Protection Relays
- Busbar and Process Protection Relays
- By End-user
- Utilities (Transmission, Distribution)
- Industrial (Oil and Gas, Metals and Mining, Chemicals, Manufacturing)
- Commercial and Infrastructure
- Transportation (Rail, Airports, Marine)
- By Installation Type
- New Build
- Retrofit/Upgrade
- By Geography
- North America
- United States
- Canada
- Mexico
- Europe
- Germany
- United Kingdom
- France
- Nordics
- Rest of Europe
- South America
- Brazil
- Rest of South America
- Asia-Pacific
- China
- Japan
- India
- South-East Asia
- Rest of Asia
- Middle East and Africa
- Middle East
- Israel
- Turkey
- Saudi Arabia
- United Arab Emirates
- Rest of Middle East
- Africa
- South Africa
- Rest of Africa
- Middle East
- North America
Detailed Research Methodology and Data Validation
Primary Research
Mordor analysts interviewed relay design engineers, protection and control managers at utilities across Asia-Pacific, North America, Europe, and the Middle East, plus procurement leads from EPC contractors. Conversations clarified typical asset life cycles, preferred relay form factors, and verified average selling prices assumed in the model.
Desk Research
We screened publicly available tier-1 sources such as International Energy Agency electricity statistics, US Energy Information Administration grid investment data, International Electrotechnical Commission digital substation guidelines, and regional transmission operator CAPEX filings. Trade bodies, for example, CIGRÉ and IEEE Power and Energy Society, supplied fault rate benchmarks, while customs logs accessed through Volza revealed relay import trends by voltage class. Company 10-Ks, utility sustainability reports, and news archives on Dow Jones Factiva completed our secondary evidence pool. These examples are illustrative; many additional references informed the work.
Market Sizing and Forecasting
A blended top-down and bottom-up approach was followed. We began with substation counts and circuit kilometer additions, applied protection device penetration ratios, and converted installed base into yearly demand using average replacement intervals. Supplier shipment roll-ups and sampled ASP × volume checks subsequently validated totals. Key variables like utility T&D CAPEX, renewable generation additions (GW), digital substation adoption rates, average relay replacement age, and regional currency movements were stress tested in multivariate regression to forecast 2026-2030 values. Data gaps in vendor roll-ups were bridged by channel check averages that were re-confirmed with primary experts before inclusion.
Data Validation and Update Cycle
Outputs pass a two-stage analyst review: first for cross-table coherence and anomaly flags, then for variance against independent grid investment indicators. Models refresh annually, with mid-cycle updates triggered by material events such as tariff shifts or large procurement tenders. A final pre-publication sweep ensures clients receive the latest validated view.
Why Our Protective Relay Baseline Commands Confidence
Published estimates often diverge because each firm selects different product mixes, input metrics, and refresh cadences. Our team anchors the baseline on the exact relay classes utilities specify in IEC-based protection schemes, couples that with real-time CAPEX trackers, and validates price spreads through field interviews, which together yield a figure decision makers can trace back to observable variables.
Key gap drivers include whether auxiliary devices like circuit breakers are bundled, the age of the baseline year, consistency of ASP escalation by voltage tier, and the depth of primary verification.
Benchmark comparison
| Market Size | Anonymized source | Primary gap driver |
|---|---|---|
| USD 2.27 Bn (2025) | Mordor Intelligence | - |
| USD 2.80 Bn (2024) | Global Consultancy A | Counts circuit breakers and numeric relays twice, refreshes every 18-24 months |
| USD 3.41 Bn (2023) | Industry Research Firm B | Uses single global ASP, older baseline, limited primary validation |
In sum, the disciplined selection of variables, yearly refresh, and live field checks mean Mordor's market view balances realism with transparency, giving stakeholders a dependable starting point for strategy and sizing conversations.


Key Questions Answered in the Report
What is the current size of the protective relay market?
The protective relay market reached USD 2.4 billion in 2026 and is projected to grow to USD 3.17 billion by 2031 at a 5.73% CAGR
Which voltage segment is growing fastest?
High-voltage applications lead growth with a 6.78% CAGR through 2031 on the back of ultra-high-voltage transmission expansion in China and new interstate lines in North America
Why are generator protection relays gaining momentum?
Renewable-energy integration and the rise of inverter-based resources require advanced negative-sequence and loss-of-field functions, pushing generator protection to an 8.1% CAGR to 2031
How big is the retrofit opportunity?
Retrofit and upgrade installations are expanding at a 7.38% CAGR as more than 70% of transmission assets in mature grids exceed 25 years, necessitating digital replacements
Which region will grow fastest?
The Middle East shows the strongest regional CAGR at 6.7% through 2031 as Gulf states fund large solar and smart-grid programs.
What role does cybersecurity play in relay selection?
Regulations such as NERC CIP and EU NIS-2 require embedded encryption, secure firmware updates, and network-intrusion monitoring, influencing procurement specifications and favoring vendors with mature software stacks.
Page last updated on:


