Additive Manufacturing And Materials Market Size and Share
Market Overview
| Study Period | 2020 - 2031 |
|---|---|
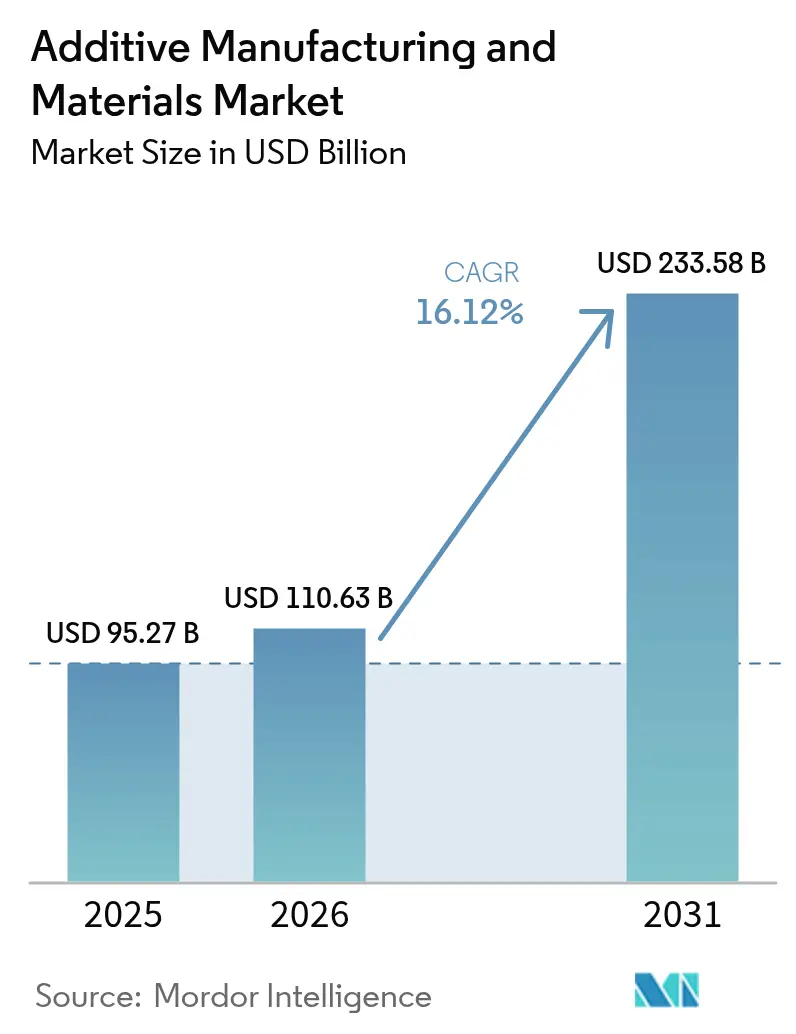
| Market Size (2026) | USD 110.63 Billion |
| Market Size (2031) | USD 233.58 Billion |
| Growth Rate (2026 - 2031) | 16.12% CAGR |
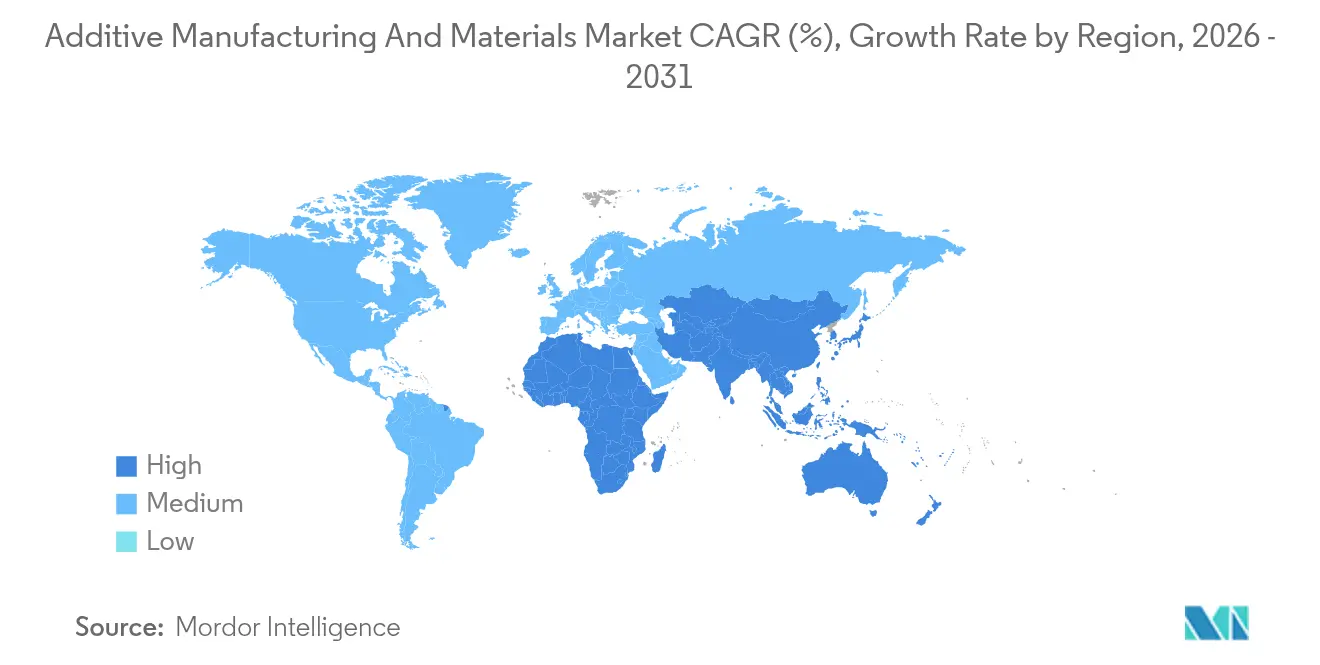
| Fastest Growing Market | Asia Pacific |
| Largest Market | North America |
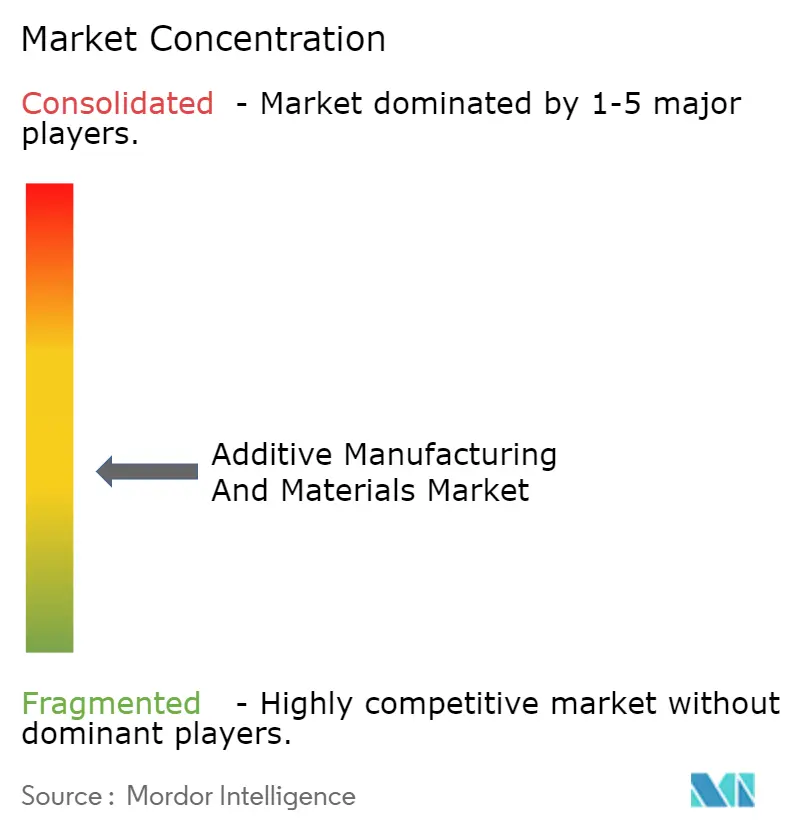
| Market Concentration | Medium |
Major Players *Disclaimer: Major Players sorted in no particular order Image © Mordor Intelligence. Reuse requires attribution under CC BY 4.0. | |
Additive Manufacturing And Materials Market Analysis by Mordor Intelligence
The additive manufacturing and materials market size is expected to grow from USD 95.27 billion in 2025 to USD 110.63 billion in 2026 and is forecast to reach USD 233.58 billion by 2031 at 16.12% CAGR over 2026-2031. Falling material prices, aerospace demand for lightweight parts, and rapid healthcare adoption shift the additive manufacturing and materials market away from prototyping and into volume production. Standardization programs at NIST and ASTM provide unified qualification pathways that lower certification costs, while government incentives in North America, Europe, and Asia Pacific accelerate factory-level deployment.[1]National Institute of Standards and Technology, “Additive Manufacturing Metrology Program,” nist.govCompetitive intensity rises as vendors integrate software, printers, and qualified powders to deliver turnkey production lines that meet industrial uptime requirements. Simultaneously, circular-economy policies motivate producers to qualify recycled polymer and metal feedstocks, creating cost and sustainability advantages for regions with established waste-processing capacity. Space agencies validate in-orbit metal printing, opening a long-term frontier for on-site micro-production that removes costly launch mass.
Key Report Takeaways
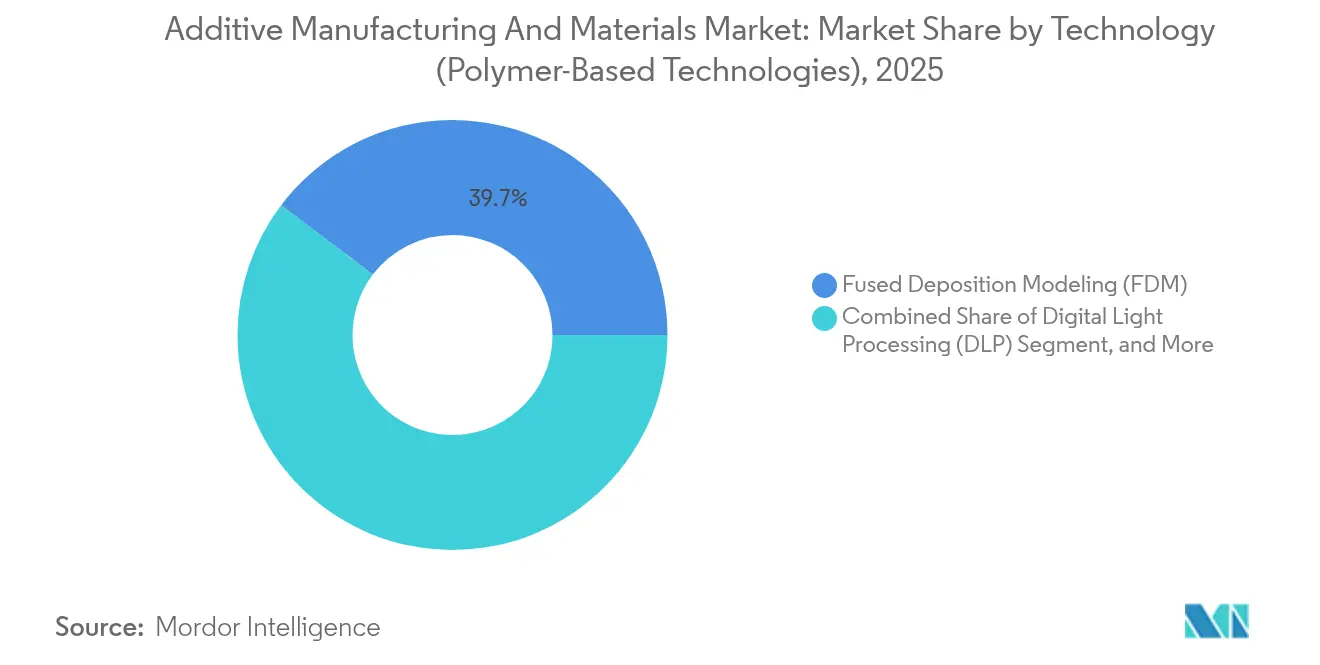
- By technology, Fused Deposition Modeling held 39.68% of additive manufacturing and materials market share in 2025, while Directed Energy Deposition is expected to expand at a 16.98% CAGR through 2031.
- By material type, plastics captured 55.12% share of the additive manufacturing and materials market size in 2025; high-performance thermoplastics are advancing at an 17.62% CAGR to 2031.
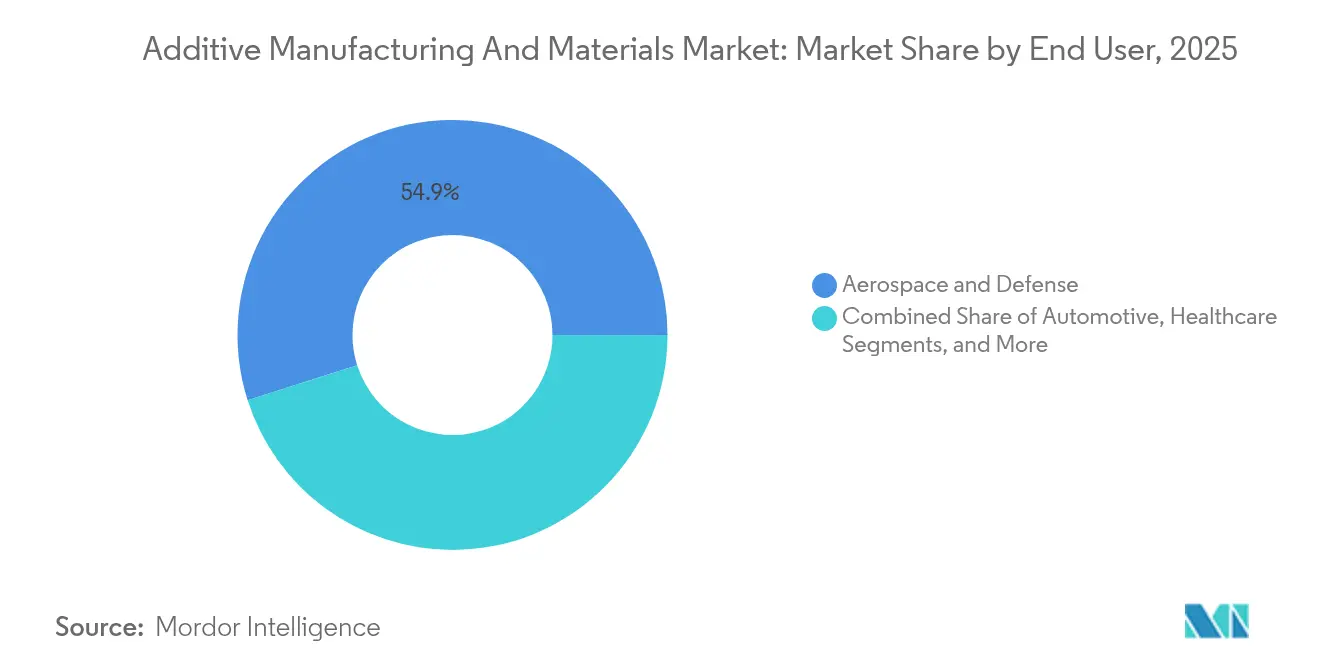
- By end user, aerospace and defense led with 54.90% revenue share in 2025, whereas healthcare is projected to log the highest CAGR at 16.91% through 2031.
- By geography, North America commanded 36.45% share of the additive manufacturing and materials market in 2025, while Asia Pacific is forecast to post a 16.55% CAGR during the outlook period.
Note: Market size and forecast figures in this report are generated using Mordor Intelligence’s proprietary estimation framework, updated with the latest available data and insights as of 2026.
Global Additive Manufacturing And Materials Market Trends and Insights
Drivers Impact Analysis*
| Driver | (~) % Impact on CAGR Forecast | Geographic Relevance | Impact Timeline |
|---|---|---|---|
| Aerospace & automotive weight reduction | +3.2% | North America, Europe | Medium term (2–4 years) |
| Patient-specific healthcare implants | +2.8% | North America, Europe | Short term (≤ 2 years) |
| Falling polymer and metal powder prices | +2.1% | Global | Short term (≤ 2 years) |
| Government funding and standards alignment | +2.5% | North America, Europe, Asia Pacific | Long term (≥ 4 years) |
| Circular-economy recycled feedstocks | +1.9% | Europe, North America | Medium term (2–4 years) |
| On-site micro-production for space missions | +1.4% | North America, Europe | Long term (≥ 4 years) |
| Source: Mordor Intelligence | |||
Demand for lightweight components in automotive and aerospace
Aerospace OEMs condense multi-part assemblies into single printed geometries to trim aircraft weight and maintenance. GE Aviation’s printed fuel nozzle replaces twenty components and saves carriers USD 1.6 million in lifetime operating costs per aircraft.[2]General Electric, “Fuel Nozzle Additive Manufacturing Case Study,” ge.comBoeing integrates titanium lattice brackets on the 787 that cut part cost by USD 2–3 million while meeting structural standards. Automotive firms replicate this consolidation in battery housings and brake systems to extend electric-vehicle range. Topology-optimization software unlocks organic shapes unattainable with machining, giving early adopters a performance edge. ASTM F2792 definitions standardize terminology and testing, helping certifiers approve flight-critical parts faster.
Rapid adoption of patient-specific healthcare implants
Powder-bed fusion enables porous titanium implants that match individual anatomy, improving osseointegration and cutting failure rates. Stryker has produced over 2 million such devices, proving the scalability of hospital-grade additive workflows.[3]Stryker Corp., “Additive Manufacturing Milestones,” stryker.comThe U.S. FDA’s point-of-care guidance lets certified hospitals print surgical guides onsite, reducing lead times and inventory costs. Distributed production shifts value from centralized factories to clinical settings, shrinking logistics footprints. Premium demand pushes cobalt-chrome and titanium powder suppliers to scale atomization capacity despite tight aerospace allocation.
Government funding and standards harmonization
NIST funds metrology projects that quantify porosity, residual stress, and dimensional accuracy across disparate printer platforms. America Makes funnels federal grants into industry–academia teams that qualify new steel and nickel alloys for flight hardware. Coordinated ASTM and ISO committees publish common parameter sets so parts certified in one region gain reciprocal acceptance. Such harmonisation lowers compliance costs for suppliers entering new verticals, especially in medical and defense.
Evonik’s Structured Polymers line processes shredded consumer plastics into uniform powders between 0.1 µm and 400 µm, retaining mechanical performance equal to virgin resins. European regulations monetise recycled inputs through tax credits, converting waste streams into revenue. Laser-powder-bed systems already recycle up to 75% of unused metal powder during recoating cycles, trimming material spend. Brands leverage sustainability labeling to justify premium pricing and meet Scope 3 carbon targets, turning environmental compliance into a sales lever.
Restraints Impact Analysis*
| Restraint | (~) % Impact on CAGR Forecast | Geographic Relevance | Impact Timeline |
|---|---|---|---|
| High cost of high-performance metals & polymers | -2.7% | Global | Short term (≤ 2 years) |
| Intellectual-property leakage risks | -1.8% | North America, Europe | Medium term (2-4 years) |
| Strict EHS rules for nano-powder handling | -1.5% | Europe, North America | Long term (≥ 4 years) |
| Critical-alloy supply volatility | -2.1% | Global | Medium term (2-4 years) |
| Source: Mordor Intelligence | |||
High cost of high-performance metals and polymers
PEEK, PEKK, and aerospace-grade titanium powders trade at premiums that smaller job shops struggle to absorb. Limited atomizer capacity and energy-intensive plasma processes elevate raw-material costs just as buyers push for volume pricing. Suppliers face a squeeze between customers requesting discounts and investors demanding R&D spending, delaying next-generation material rollouts. Automotive and consumer sectors therefore confine purchases to prototypes or high-margin components until cost curves fall.
Supply-chain volatility in critical alloying elements
Titanium sponge production remains concentrated in a handful of nations, exposing powder makers to geopolitical shock. Rare earths for superalloys face similar concentration risk, prompting OEMs to dual-source and pre-qualify substitute chemistries. Qualifying a new alloy for flight or implant use adds years of fatigue testing, so any disruption ripples across production schedules. Strategic stockpiles and forward contracts help, but cash-flow burdens rise in a capital-tight environment.
*Our forecasts treat driver/restraint impacts as directional, not additive. The impact forecasts reflect baseline growth, mix effects, and variable interactions.
Segment Analysis
By Technology: Metal processes lead premium growth
Directed Energy Deposition posts a 16.98% CAGR, underpinned by aerospace engine repair where meter-scale parts eclipse powder-bed build volumes. This segment benefits from wire feedstock that costs 30-50% less than powder and recoups material unused in other systems. Fused Deposition Modeling, however, retains 39.68% additive manufacturing and materials market share due to its ubiquity in education, design, and low-stress industrial fixtures. Hybrid CNC-additive platforms merge laser cladding with five-axis milling to meet tolerance and surface roughness targets in a single setup.
Powder Bed Fusion remains the benchmark for lattice-rich implants and rocket turbopump components requiring sub-80 µm layer heights. Binder Jetting evolves for steel pump housings and sand casting molds, offering throughput advantages when sintering bottlenecks are solved. Emerging microwave volumetric systems promise order-of-magnitude speed gains, foreshadowing a future where build time no longer dictates unit economics.


By Material Type: Performance polymers accelerate
Plastics maintain 55.12% share of additive manufacturing and materials market size in 2025, driven by ABS and PLA prototyping demand. High-performance thermoplastics log an 17.62% CAGR as aerospace cabins, rail interiors, and EV battery covers require flame-smoke-toxicity compliance at elevated temperatures.Additive manufacturing and materials market share tilts toward metal feedstocks in engines, landing gear, and orthopedic stems where titanium alloys deliver optimal strength-to-weight ratios. Carbon-fiber-reinforced PA12 filaments provide directional stiffness for drone frames and sporting goods, blurring the line between polymer and composite classes.
Recycled PET-G filaments satisfy consumer electronics brands pursuing closed-loop packaging targets, while copper powders with >95% conductivity unlock motor windings and heat exchangers. Material suppliers bundle digital process parameters with every batch, ensuring first-time-right builds that cut trial-and-error costs for end users.
By End User: Healthcare rises fastest
Aerospace and defense represented 54.90% of additive manufacturing and materials market share in 2025, anchored by flight-qualified fuel nozzles, satellite brackets, and hypersonic inlet liners. Healthcare delivers the fastest 16.91% CAGR as hospitals print patient-matched cranial plates, spinal cages, and surgical models directly from CT scans. Dental labs adopt intra-oral scanners and resin printers to ship same-day crowns, lifting throughput tenfold over milling. Automakers escalate deployment for lightweight brake calipers and topology-optimized brackets that extend EV range by several kilometers per charge.Industrial machinery OEMs embrace on-demand spare parts to minimize warehouse overhead and field downtime.
Geography Analysis
North America commands 36.45% additive manufacturing and materials market size in 2025, supported by defense budgets, NASA deep-space initiatives, and a mature supplier ecosystem. Federal tax incentives and Section 174 R&D expensing rules reward capital investment in new production lines. FDA 510(k) guidance for 3D-printed implants accelerates time-to-market for device OEMs, reinforcing domestic powder consumption.
Asia Pacific is the fastest-growing region at a 16.55% CAGR as China funds domestic printer champions to lessen dependence on imported engine parts. Singapore’s National Additive Manufacturing cluster certifies aerospace alloys and trains technicians, turning the island into a regional export hub.India’s Production-Linked Incentive program subsidizes metal-printer purchases for automotive and energy verticals, while Australia’s Cooperative Research Centre advances titanium powder atomization from local ore.
Europe focuses on sustainability; the EU’s Fit-for-55 package spurs OEMs to print lightweight brackets that reduce vehicle emissions. The European Space Agency demonstrates the first stainless-steel part fabricated aboard the ISS, validating micro-gravity printing for lunar infrastructure. German carmakers co-develop aluminum-silicon alloys that weld seamlessly without hot-crack defects, setting a benchmark for crash-relevant applications.

Competitive Landscape
Market fragmentation prevails, yet mounting losses push OEMs to consolidate. The top four public vendors collectively booked USD 986.2 million in net losses over the last fiscal year, sparking mergers that seek cost synergies rather than revenue growth. Nano Dimension’s USD 183 million acquisition of Desktop Metal unites polymer and metal platforms to offer an end-to-end production suite. Stratasys buys Arevo’s composite IP, adding continuous-fiber deposition that meets aerospace strength targets while lowering mass.
Suppliers diversify into certified powders and post-processing equipment to capture recurring margins as hardware prices slide. ISO 9001 and AS9100 registrations become prerequisites for aerospace purchase orders, weeding out under-capitalized entrants. Hybrid machining firms such as United Grinding integrate laser cladding modules into five-axis mills, collapsing workflows for turbine blades and tool inserts. Forward integration extends to software; build-simulation codes leverage multi-physics models to predict distortion, reducing scrap rates and shortening design loops.
Additive Manufacturing And Materials Industry Leaders
3D Systems Corporation
Stratasys Ltd
EnvisionTEC GmbH
Exone Company
General Electric Company (GE Additive)
- *Disclaimer: Major Players sorted in no particular order

Recent Industry Developments
- April 2025: Evonik closed the acquisition of Structured Polymers, gaining patented technology to convert post-consumer plastics into high-flow powders for laser-based systems.
- February 2025: Formlabs acquired Micronics to broaden its selective-laser-sintering lineup and democratize powder-bed fusion on the shop floor.
- February 2025: Nano Dimension completed its USD 183 million takeover of Desktop Metal, creating a combined entity with USD 246 million in pro-forma 2023 revenue and projected USD 30 million in synergy savings.
- November 2024: United Grinding Group bought GF Machining Solutions, integrating grinding, electrical-discharge machining, and additive modules for hybrid workflows.


Global Additive Manufacturing And Materials Market Report Scope
3D printing is a technology in which three-dimensional objects can be created by adding materials in layers to a computer-aided design (CAD) model. This 3D printing is also called Additive manufacturing (AM). AM enables the production of custom parts with intricate geometries and minimal waste, thereby reducing the cost of high-value parts. It helps in quick design alterations with efficiency during the manufacturing process, which reduces the lead times. The technology also makes it possible to construct things that formerly needed assembly from several pieces into a single entity, improving their strength and longevity.
Technology segments the Additive Manufacturing and Materials Market (Stereolithography, Fused Deposition Modeling, Laser Sintering, and Other Technologies), End User (Aerospace and Defense, Automotive, Healthcare, Industrial and Other End Users), Material (Plastic, Metals, and Ceramics), and Geography.
The market sizes and forecasts are provided in terms of value (USD million).
| Polymer-based Technologies | Fused Deposition Modeling (FDM) |
| Stereolithography (SLA) | |
| Digital Light Processing (DLP) | |
| Material Jetting (PolyJet) | |
| Binder Jetting - Polymers | |
| Metal-based Technologies | Powder Bed Fusion (SLM, EBM) |
| Directed Energy Deposition | |
| Ceramic-based Technologies | Ceramic SLA |
| Ceramic Binder Jetting | |
| Other Technologies |
| Polymers | Commodity Thermoplastics (ABS, PLA) |
| Engineering Plastics (PA, PEEK) | |
| Photopolymer Resins | |
| High-performance Thermoplastics (ULTEM, PEKK) | |
| Metals | Titanium Alloys |
| Aluminum Alloys | |
| Stainless Steels | |
| Nickel Super-alloys | |
| Precious Metals | |
| Ceramics | Alumina |
| Zirconia | |
| Silicon Carbide | |
| Composite and Other Emerging Material Feedstocks |
| Aerospace and Defense | |
| Automotive | |
| Healthcare | Medical Devices |
| Dental | |
| Industrial Machinery | |
| Consumer Products | |
| Construction | |
| Education and Research | |
| Other End Users |
| North America | United States |
| Canada | |
| Mexico | |
| South America | Brazil |
| Argentina | |
| Rest of South America | |
| Europe | United Kingdom |
| Germany | |
| France | |
| Italy | |
| Spain | |
| Russia | |
| Rest of Europe | |
| Asia Pacific | China |
| Japan | |
| India | |
| South Korea | |
| Australia and New Zealand | |
| Southeast Asia | |
| Rest of Asia Pacific | |
| Middle East | United Arab Emirates |
| Saudi Arabia | |
| Turkey | |
| Rest of Middle East | |
| Africa | South Africa |
| Nigeria | |
| Egypt | |
| Rest of Africa |
| By Technology | Polymer-based Technologies | Fused Deposition Modeling (FDM) |
| Stereolithography (SLA) | ||
| Digital Light Processing (DLP) | ||
| Material Jetting (PolyJet) | ||
| Binder Jetting - Polymers | ||
| Metal-based Technologies | Powder Bed Fusion (SLM, EBM) | |
| Directed Energy Deposition | ||
| Ceramic-based Technologies | Ceramic SLA | |
| Ceramic Binder Jetting | ||
| Other Technologies | ||
| By Material Type | Polymers | Commodity Thermoplastics (ABS, PLA) |
| Engineering Plastics (PA, PEEK) | ||
| Photopolymer Resins | ||
| High-performance Thermoplastics (ULTEM, PEKK) | ||
| Metals | Titanium Alloys | |
| Aluminum Alloys | ||
| Stainless Steels | ||
| Nickel Super-alloys | ||
| Precious Metals | ||
| Ceramics | Alumina | |
| Zirconia | ||
| Silicon Carbide | ||
| Composite and Other Emerging Material Feedstocks | ||
| By End User | Aerospace and Defense | |
| Automotive | ||
| Healthcare | Medical Devices | |
| Dental | ||
| Industrial Machinery | ||
| Consumer Products | ||
| Construction | ||
| Education and Research | ||
| Other End Users | ||
| By Geography | North America | United States |
| Canada | ||
| Mexico | ||
| South America | Brazil | |
| Argentina | ||
| Rest of South America | ||
| Europe | United Kingdom | |
| Germany | ||
| France | ||
| Italy | ||
| Spain | ||
| Russia | ||
| Rest of Europe | ||
| Asia Pacific | China | |
| Japan | ||
| India | ||
| South Korea | ||
| Australia and New Zealand | ||
| Southeast Asia | ||
| Rest of Asia Pacific | ||
| Middle East | United Arab Emirates | |
| Saudi Arabia | ||
| Turkey | ||
| Rest of Middle East | ||
| Africa | South Africa | |
| Nigeria | ||
| Egypt | ||
| Rest of Africa | ||


Key Questions Answered in the Report
How fast is revenue growing in the additive manufacturing and materials market?
Global sales are projected to rise from USD 110.63 billion in 2026 to USD 233.58 billion by 2031, equating to a 16.12% CAGR.
Which technology leads unit shipments today?
Fused Deposition Modeling remains the volume leader, holding 39.68% market share in 2025.
What segment is expanding the quickest?
Directed Energy Deposition is the fastest technology segment, expected to post a 16.98% CAGR through 2031.
Why is healthcare adoption accelerating now?
FDA guidance and proven implants such as Stryker's porous titanium devices enable hospitals to print patient-specific parts, driving a 16.91% CAGR in the segment.
Which region offers the highest growth runway?
Asia Pacific is forecast to grow at 16.55% CAGR, backed by government incentives, expanding manufacturing bases, and aggressive aerospace ambitions.
How is sustainability influencing material choices?
Recycled polymer and metal powders reduce cost and carbon footprint, aligning with EU circular-economy policies and growing demand for low-impact supply chains.
Page last updated on:


