Process Instrumentation Market Size and Share
Market Overview
| Study Period | 2020 - 2031 |
|---|---|
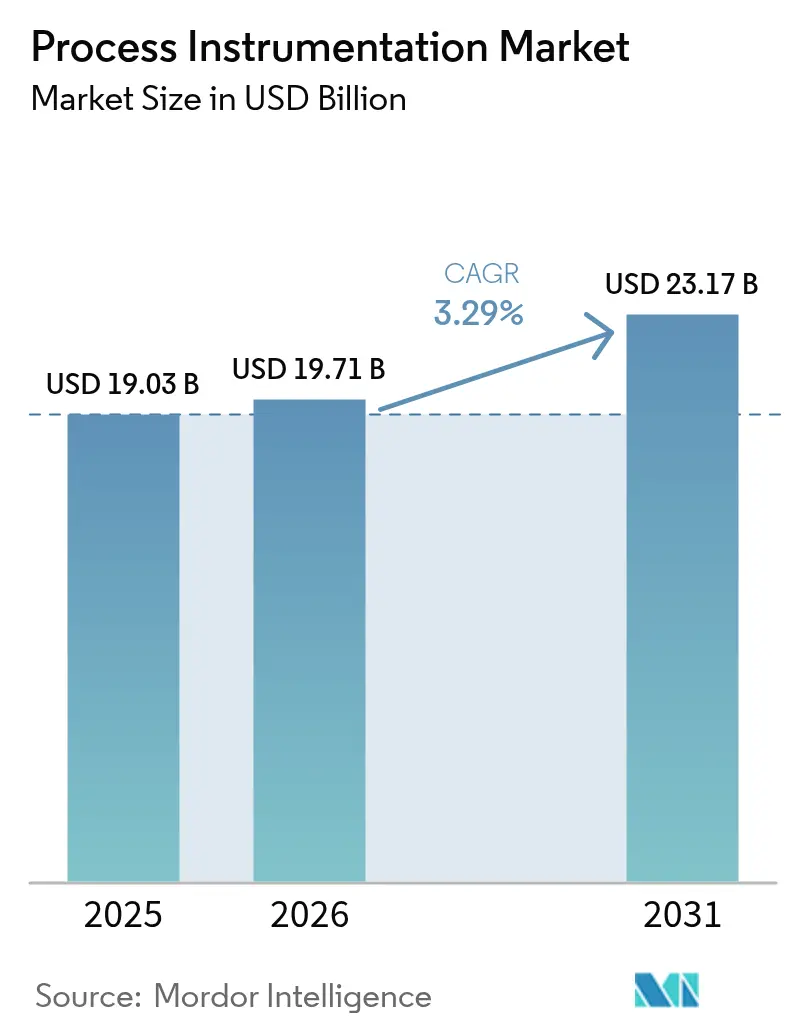
| Market Size (2026) | USD 19.71 Billion |
| Market Size (2031) | USD 23.17 Billion |
| Growth Rate (2026 - 2031) | 3.29% CAGR |
| Fastest Growing Market | Asia Pacific |
| Largest Market | North America |
| Market Concentration | Medium |
Major Players *Disclaimer: Major Players sorted in no particular order Image © Mordor Intelligence. Reuse requires attribution under CC BY 4.0. | |
Process Instrumentation Market Analysis by Mordor Intelligence
The Process Instrumentation market size is projected to expand from USD 19.03 billion in 2025 and USD 19.71 billion in 2026 to USD 23.17 billion by 2031, registering a 3.29% CAGR between 2026-2031. Rising retrofit programs, decarbonization mandates, and Ethernet-APL field-network upgrades keep demand resilient even as operators divert capital from new-build capacity to brownfield optimization. In Europe and North America, continuous-emissions monitoring is now a license-to-operate requirement, causing sensor replacement cycles to accelerate. Asia-Pacific manufacturers, meanwhile, leapfrog legacy SCADA limitations by fitting edge-analytics chipsets directly on smart transmitters, unlocking predictive-maintenance gains without cloud latency. Suppliers able to bundle hardware, software, and calibration services into subscription contracts are capturing premium pricing, while pure-play device vendors face margin compression as commoditization advances. Semiconductor shortages that lingered through 2025 still ripple across order books, but most majors report improving lead times in 2026, signaling that deferred projects will flow back into the Process Instrumentation market during the next 18 months.
Key Report Takeaways
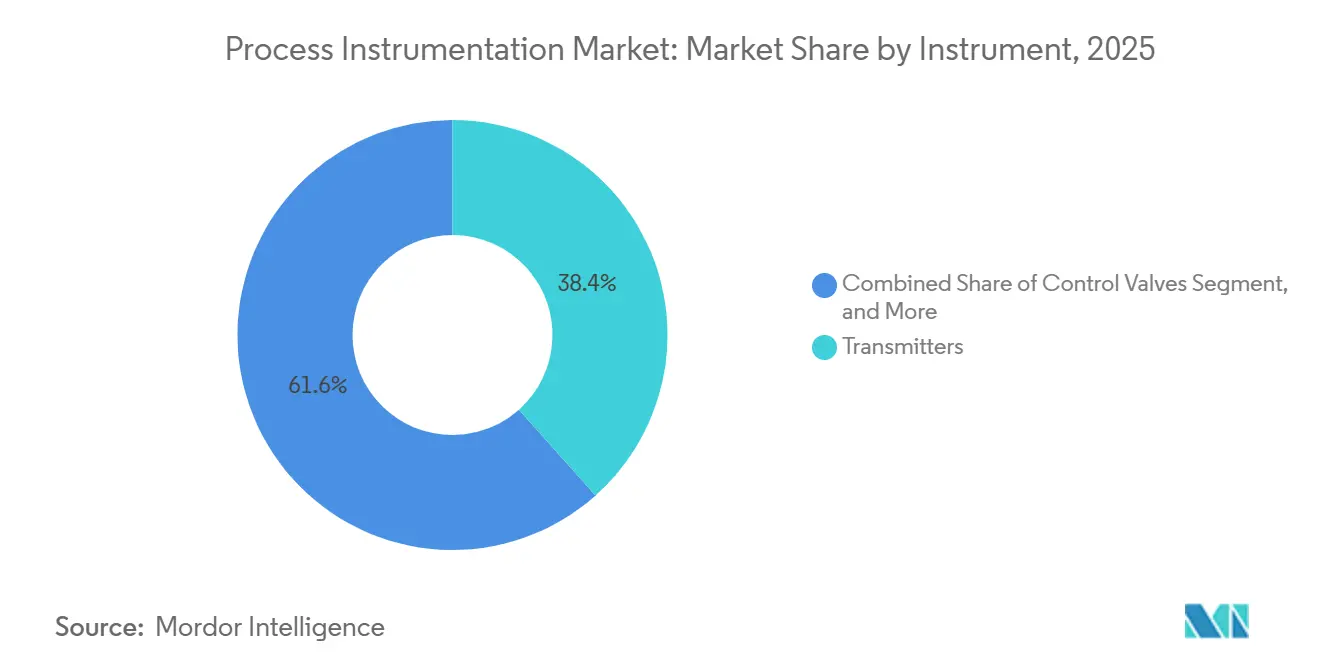
- By instrument, transmitters commanded 38.42% of 2025 revenue, whereas analytical instruments post the quickest 5.62% CAGR to 2031.
- By technology, distributed control systems held 42.83% share in 2025, but manufacturing execution systems record the highest 5.12% CAGR through 2031.
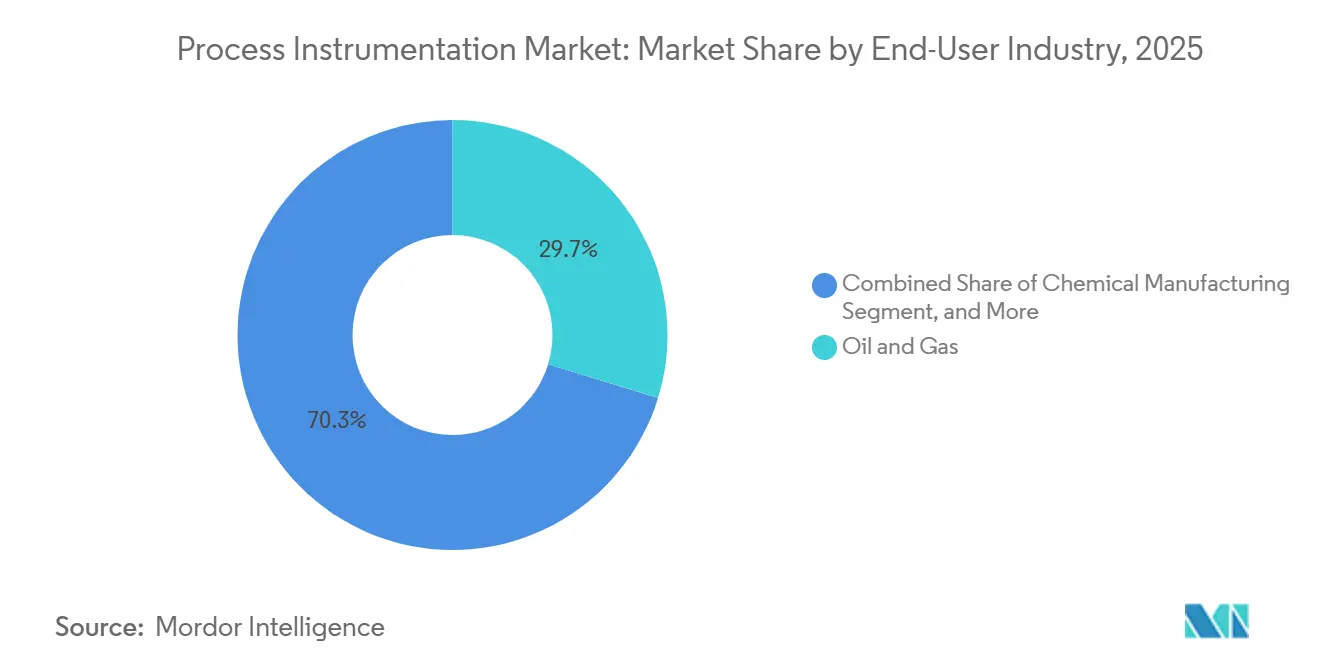
- By end-user, oil and gas accounted for 29.73% of 2025 spending, while pharmaceuticals expand at a leading 6.83% CAGR to 2031.
- By measurement parameter, flow measurement took 33.97% share in 2025, yet humidity sensing accelerates at a 6.03% CAGR across the forecast horizon.
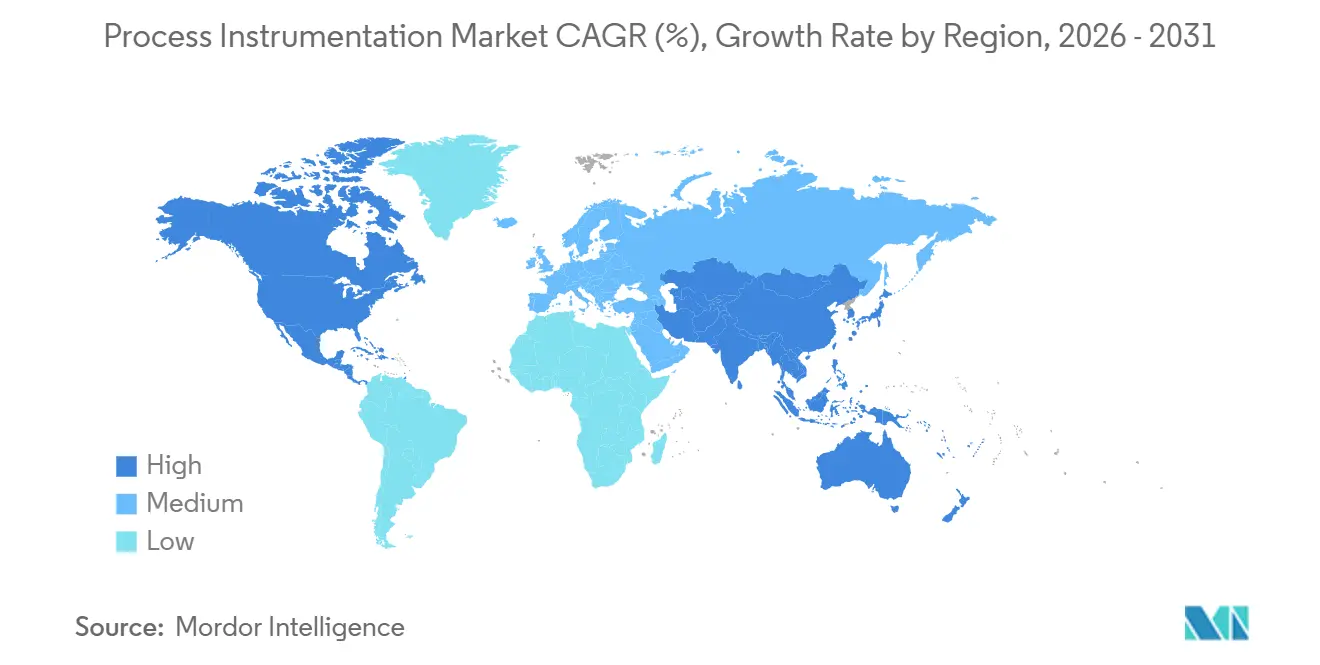
- By geography, North America led with 44.79% revenue share in 2025, while Asia-Pacific is set to grow fastest at a 4.98% CAGR to 2031.
Note: Market size and forecast figures in this report are generated using Mordor Intelligence’s proprietary estimation framework, updated with the latest available data and insights as of 2026.
Global Process Instrumentation Market Trends and Insights
Drivers Impact Analysis*
| Driver | (~) % Impact on CAGR Forecast | Geographic Relevance | Impact Timeline |
|---|---|---|---|
| Decarbonisation-linked optimisation mandates | +0.9% | Europe and North America, spillover to Asia-Pacific export-oriented facilities | Medium term (2-4 years) |
| Explosive-sensor retrofit cycles in ageing plants | +0.7% | North America and Middle East, concentrated in petrochemical and refining corridors | Short term (≤ 2 years) |
| Ethernet-APL single-pair Ethernet roll-outs | +0.6% | Global, with early adoption in Germany, United States, Japan | Medium term (2-4 years) |
| Bundled O&M instrument-as-a-service contracts | +0.5% | North America and Europe, emerging in Asia-Pacific tier-1 cities | Long term (≥ 4 years) |
| AI-driven calibration-as-a-service ecosystems | +0.4% | Global, concentrated in pharmaceutical and semiconductor clusters | Long term (≥ 4 years) |
| Sub-milliwatt edge-analytics chipsets for remote IIoT | +0.3% | Asia-Pacific and Middle East, remote oil and gas and mining sites | Medium term (2-4 years) |
| Source: Mordor Intelligence | |||
Decarbonization-Linked Optimization Mandates
Europe’s Corporate Sustainability Reporting Directive obliges roughly 50,000 firms to publish quarterly Scope 1 and Scope 2 data, forcing chemical, refining, and steel operators to add continuous emissions-monitoring and energy-optimization loops.[1]Corporate Sustainability Reporting Directive Text, European Commission, finance.ec.europa.eu The United States mirrors the trend via a USD 6 billion Industrial Demonstrations Program that conditions grants on digital-twin deployment. Siemens, for example, embedded carbon-aware algorithms in its SIMATIC PCS neo release during 2025 to shift production toward renewable-heavy grid hours, cutting plant CO₂ intensity by up to 15% without major capex. As penalty rates rise to EUR 100 per tonne for unreported CO₂ in 2026, process operators shorten payback thresholds and redirect budgets toward smart instrumentation.
Explosive-Sensor Retrofit Cycles in Ageing Plants
Updated NFPA 72-2025 rules halve permissible response time for combustible-gas detectors, rendering many units installed in the late 1990s non-compliant.[2]NFPA 72-2025 Code Update, National Fire Protection Association, nfpa.org Insurers add 20-40% premium surcharges for plants missing the new benchmark, accelerating retrofit projects along the U.S. Gulf Coast and Middle East LNG corridors. Honeywell’s wireless Sensepoint XCD, fitted with Bluetooth setup and five-year sensor cells, reduces installed cost by roughly 30% compared with wired 4-20 mA loops. Retrofit demand peaks in 2026-2027 when several petrochemical parks hit 20-year service anniversaries and calibration drift outpaces repair economics.
Ethernet-APL Single-Pair Ethernet Roll-Outs
IEC 63026, finalized in 2023, certifies two-wire 10 Mbps data-plus-power lines as intrinsically safe, unifying fieldbus layers at last. By December 2025, 47 certified devices spanned 18 vendors, giving operators credible vendor diversity.[3]Ethernet-APL Certified Device List, FieldComm Group, fieldcommgroup.org ABB’s Ability Edgenius controller can now run TensorFlow Lite inference on raw transmitter waveforms, predicting valve failures a month in advance without cloud backhaul. German chemical hubs and U.S. refineries lead deployments, while Japanese hydrogen pilots follow close behind.
Bundled O&M Instrument-as-a-Service Contracts
Endress+Hauser’s Netilion platform surpassed 12,000 field devices under subscription in 2025, affirming appetite for opex-based acquisition models. Emerson counters with DeltaV-as-a-Service, delivering distributed control logic at a monthly fee that includes cyber-patching and software upgrades. Deloitte’s 2025 survey shows 38% of process manufacturers prefer subscription finance to smooth cash flow. Pharmaceutical plants cite pre-validated calibration certificates as a key compliance benefit, slicing FDA audit prep by about 40%. Vendor lock-in risk rises, prompting Yokogawa to launch an open architecture IA-Service plan that keeps third-party devices welcome.
Restraints Impact Analysis*
| Restraint | (~) % Impact on CAGR Forecast | Geographic Relevance | Impact Timeline |
|---|---|---|---|
| Chip-supply bottlenecks for smart transmitters | -0.6% | Global, acute in North America and Europe due to just-in-time inventory practices | Short term (≤ 2 years) |
| Multi-protocol legacy lock-in costs | -0.5% | North America and Europe, concentrated in facilities with 20+ year installed base | Medium term (2-4 years) |
| Shortage of accredited calibration-lab capacity | -0.3% | North America Gulf Coast, Middle East, and Asia-Pacific emerging markets | Short term (≤ 2 years) |
| Cyber-insurance surcharges on IIoT links | -0.2% | North America and Europe, facilities in critical infrastructure sectors | Medium term (2-4 years) |
| Source: Mordor Intelligence | |||
Chip-Supply Bottlenecks for Smart Transmitters
Industrial-grade microcontroller lead times stretched to 52 weeks during 2025, lifting Emerson’s automation backlog to USD 1.8 billion. Many asset owners prolonged 4-20 mA device life and postponed digital-readiness upgrades. The CHIPS and Science Act finances USD 39 billion of onshore fabs, yet new lines in Arizona and Kumamoto come online only in late 2026, keeping tension high into mid-2027. Counterfeit analog ICs slipped into some supply chains, triggering functional-safety audits and unplanned downtime.
Multi-Protocol Legacy Lock-In Costs
Average chemical plants run 3.2 fieldbus variants, and ripping them out for Ethernet-APL can exceed 30% of installed asset value. ABB’s protocol-agnostic 800xA system eases migration through OPC UA, yet brownfield operators still juggle duplicate engineering tools. Europe’s pending Cyber Resilience Act will mandate 10-year patch support, threatening early obsolescence of orphaned devices. Hybrid architecture—new APL backbones alongside stable legacy loops, remains the pragmatic compromise until ROI hurdles fall below internal thresholds.
*Our forecasts treat driver/restraint impacts as directional, not additive. The impact forecasts reflect baseline growth, mix effects, and variable interactions.
Segment Analysis
By Instrument: Analytics Accelerate While Transmitters Retain Scale
Transmitters accounted for 38.42% of 2025 revenue, anchoring the installed base that defines the Process Instrumentation market share for device classes. Analytical instruments, however, register a 5.62% CAGR to 2031, the fastest of any instrument category, as FDA process analytical technology guidelines reward real-time compositional insight. Subscription-based calibration services further tilt budgets toward spectrometers, gas chromatographs, and Raman probes that lower quality-control lag. Commodity transmitters face price pressure, but Ethernet-APL-native designs with embedded edge compute regain margin and protect the Process Instrumentation market size for premium devices.
Across brownfield plants, control-valve upgrades shift from pneumatic to electric actuators to curb fugitive methane, while field controllers grow on the back of containerized analytics that shrink cloud-traffic bills. Process analyzers inside refineries save millions in catalyst costs by enabling ppm-level sulfur control, highlighting the earnings leverage hidden in accurate composition data. Integrated multi-parameter devices that collapse pH, conductivity, and dissolved-oxygen sensing into one APL housing slash installation footprint by up to 40%, underscoring how layered intelligence, not mechanical robustness alone, now dictates procurement shortlists in the Process Instrumentation market.


By Technology: DCS Still Rules, MES Gains Ground
Distributed control systems preserved a leading 42.83% revenue slice in 2025, sustaining the backbone of the Process Instrumentation market across continuous industries that prize redundant sub-second loops. Manufacturing execution systems, though, outpace every peer with a 5.12% CAGR toward 2031 as discrete and hybrid factories converge shop-floor data, sustainability metrics, and enterprise resource planning. Emerging zero-trust security modules inside SCADA reinvigorate demand among water utilities and electric grids, where ransomware fears dominate board agendas.
Programmable logic controllers enjoy a renaissance as vendors pack process-library blocks and SIL-rated redundancy into formerly discrete-oriented hardware, helping them nibble at entry-level DCS domains. Unified engineering environments that stretch from edge to cloud reduce total lifecycle cost by about 25% in newly commissioned modular plants. Over time, IT-OT convergence will blur product lines further, yet long service lives mean each cohort persists, keeping the overall Process Instrumentation market diversified for at least another decade.
By End-User Industry: Pharmaceuticals Sprint Ahead
Oil and gas extraction spent the most in 2025 at 29.73% of total outlays, but its share erodes as exploration budgets shift to methane-leak detection and flare-minimization compliance. Pharmaceuticals accelerate at a 6.83% CAGR, powered by biologics manufacturing and cell-therapy production that demand ±0.1 °C environmental regulation and serialization-enabled batch records. Water and wastewater utilities benefit from infrastructure-stimulus checks that bundle SCADA clauses, while chemicals pivot to skid-mounted, Ethernet-APL-ready modular units that slice engineering hours.
The energy-transition wave lifts hydrogen pilot plants, carbon-capture skid packages, and next-generation battery cell lines, each saturated with high-accuracy flowmeters and humidity probes. As a result, suppliers that package domain models, AI libraries, and regulatory templates inside device firmware grow faster than those pitching hardware alone, reshaping wallet share allocations within the Process Instrumentation market.
By Measurement Parameter: Flow Dominates, Humidity Rises Fast
Flow measurement retained a 33.97% revenue position in 2025 thanks to custody-transfer accuracy mandates and high-value LNG streams. Humidity sensing, however, logs the quickest 6.03% CAGR through 2031 on the back of lithium-ion dry-room build-outs and pharmaceutical freeze-drying quality windows. Level transmitters migrate toward non-contact radar, slashing maintenance by up to 70%, while pressure devices stay core to safety-instrumented systems that trip boilers and reactors within milliseconds.
Temperature technologies pivot to battery-free or vibration-harvested power for rotating assets, illustrating how energy autonomy becomes a decisive feature for remote mines and offshore platforms. Multivariable transmitters that consolidate density, viscosity, and mass flow sharpen mass-balance calculations and simplify piping layouts, enhancing return on capital. Together, these trajectories keep the Process Instrumentation market on a healthy innovation curve even inside mature measurement classes.
Geography Analysis
North America generated 44.79% of 2025 revenue, yet capital emphasis shifts from greenfield additions to efficiency-driven retrofits. Clean-hydrogen tax incentives steer funds toward distributed control systems able to handle high-purity process streams, while aging petrochemical complexes race to replace flame detectors ahead of insurance audits. Mexico’s near-shoring surge boosts programmable logic controller shipments as electronics and automotive plants demand discrete automation rather than classical DCS architectures, subtly reshaping portfolio mixes for suppliers active in the Process Instrumentation market.
Asia-Pacific posts the fastest 4.98% CAGR through 2031 as China arms chip fabs with Ethernet-APL networks, India funnels production-linked incentives toward continuous-manufacturing pharma corridors, and Japan advances hydrogen supply chains that rely on ultra-trace gas analysis. Battery-cell giants in South Korea insulate dry rooms with redundant humidity sensors to prevent dendrite formation, while Australia’s irrigation districts embed satellite-enabled SCADA to secure water reserves. Collectively, these projects enlarge the Process Instrumentation market size for high-bandwidth analytics devices across the region.
Europe balances decarbonization targets with energy-security anxieties. Chemical parks in Germany pilot plant-wide APL backbones that cut engineering hours by 35%, and United Kingdom offshore wind farms entrust SCADA upgrades to guard against grid intermittency. French nuclear safety retrofits pull in SIL-3-rated transmitters, while Southern Europe adopts hygienic instrumentation to meet updated food-safety codes. The Middle East invests in unconventional gas and green-hydrogen complexes laden with wireless mesh networks, whereas Africa’s uptake remains tied to mining safety instruments and LNG export trains.

Competitive Landscape
The Process Instrumentation market shows moderate concentration. Emerson, Siemens, ABB, Honeywell, and Yokogawa together hold about 60% of distributed-control-system revenue. Their grip weakens in transmitters and analytic niches where more than 100 suppliers compete. Platform leaders now bundle hardware, software, and calibration under multi-year subscriptions that raise switching costs. Device-only vendors face price pressure as commoditization advances.
Specialists such as KROHNE and Endress+Hauser exploit Ethernet-APL early, offering self-diagnosing transmitters that win brownfield retrofits. Smaller firms with deep parameter knowledge, for example VEGA in radar level or HIMA in functional safety, capture projects that demand high certification rigor. Edge-compute options, led by ABB’s Edgenius and Honeywell’s Forge, move analytics to the field instrument, trimming cloud fees and unlocking predictive maintenance. Customers value cyber-secure firmware and zero-downtime patching as much as measurement accuracy.
Patent filings cluster around intrinsically safe power-over-Ethernet and wireless mesh networking, signaling where incumbents guard margins. Mid-tier consolidation is quickening as AMETEK, Spectris, and TE Connectivity acquire niche sensor makers to fill portfolio gaps and reach new geographies. Software-defined instrumentation startups challenge the legacy stack by decoupling sensing from processing, offering rapid analytic upgrades over the air. Cybersecurity posture has become a tender differentiator after 2024 ransomware attacks on water utilities pushed insurers to demand zero-trust controls. Suppliers that fail to integrate hardware, analytics, and lifecycle services risk sliding into low-margin commodity tiers over the next five years.
Process Instrumentation Industry Leaders
Honeywell International Inc.
Siemens AG
Omron Corporation
ABB Limited
Emerson Electric Co.
- *Disclaimer: Major Players sorted in no particular order

Recent Industry Developments
- February 2026: Siemens earmarked EUR 500 million (USD 565 million) to expand its Karlsruhe process-automation plant, adding Ethernet-APL transmitter lines and 800 new jobs.
- January 2026: Emerson closed a USD 1.2 billion purchase of Mita-Teknik, gaining software-defined control IP for district-energy grids.
- December 2025: ABB unveiled the Ability Edgenius 900 edge controller, delivering on-device machine learning for predictive diagnostics.
- November 2025: Honeywell won a USD 180 million Experion PKS contract for Saudi Aramco’s Jafurah shale-gas project.


Global Process Instrumentation Market Report Scope
Process Instrumentation shows the real-time measurement of control process variables. These variables range from temperature and pH to flow, pressure and humidity. The instrumentation process offers single-source measurement solutions that enable the increase of efficiency as well as the enhancement of product quality. Process Instrumentation is valuable as it often allows for the real-time evaluation and control of these variables.
The Process Instrumentation Market is Segmented by Instrument (Transmitters, Control Valves, Analytical Instruments, and More), Technology (DCS, PLC, SCADA, MES, Other Control Technologies), End-User Industry (Water and Wastewater Treatment, Oil and Gas Extraction, and More), Measurement Parameter (Flow, Pressure, Level, Temperature, Humidity), and Geography. The Market Forecasts are Provided in Terms of Value (USD).
| Transmitters |
| Control Valves |
| Analytical Instruments |
| Field Controllers (RTU / PLC) |
| Process Analysers |
| Other Instruments |
| Distributed Control Systems (DCS) |
| Programmable Logic Controllers (PLC) |
| Supervisory Control and Data Acquisition (SCADA) |
| Manufacturing Execution Systems (MES) |
| Other Control Technologies |
| Water and Wastewater Treatment |
| Oil and Gas Extraction |
| Chemical Manufacturing |
| Energy and Utilities |
| Pharmaceuticals |
| Metals and Mining |
| Food and Beverage |
| Paper and Pulp |
| Other Process Industries |
| Flow |
| Pressure |
| Level |
| Temperature |
| Humidity |
| North America | United States |
| Canada | |
| Mexico | |
| South America | Brazil |
| Argentina | |
| Rest of South America | |
| Europe | Germany |
| United Kingdom | |
| France | |
| Italy | |
| Spain | |
| Rest of Europe | |
| Asia-Pacific | China |
| India | |
| Japan | |
| South Korea | |
| Australia and New Zealand | |
| Rest of Asia-Pacific | |
| Middle East | Saudi Arabia |
| United Arab Emirates | |
| Turkey | |
| Rest of Middle East | |
| Africa | South Africa |
| Nigeria | |
| Egypt | |
| Rest of Africa |
| By Instrument | Transmitters | |
| Control Valves | ||
| Analytical Instruments | ||
| Field Controllers (RTU / PLC) | ||
| Process Analysers | ||
| Other Instruments | ||
| By Technology | Distributed Control Systems (DCS) | |
| Programmable Logic Controllers (PLC) | ||
| Supervisory Control and Data Acquisition (SCADA) | ||
| Manufacturing Execution Systems (MES) | ||
| Other Control Technologies | ||
| By End-User Industry | Water and Wastewater Treatment | |
| Oil and Gas Extraction | ||
| Chemical Manufacturing | ||
| Energy and Utilities | ||
| Pharmaceuticals | ||
| Metals and Mining | ||
| Food and Beverage | ||
| Paper and Pulp | ||
| Other Process Industries | ||
| By Measurement Parameter | Flow | |
| Pressure | ||
| Level | ||
| Temperature | ||
| Humidity | ||
| By Geography | North America | United States |
| Canada | ||
| Mexico | ||
| South America | Brazil | |
| Argentina | ||
| Rest of South America | ||
| Europe | Germany | |
| United Kingdom | ||
| France | ||
| Italy | ||
| Spain | ||
| Rest of Europe | ||
| Asia-Pacific | China | |
| India | ||
| Japan | ||
| South Korea | ||
| Australia and New Zealand | ||
| Rest of Asia-Pacific | ||
| Middle East | Saudi Arabia | |
| United Arab Emirates | ||
| Turkey | ||
| Rest of Middle East | ||
| Africa | South Africa | |
| Nigeria | ||
| Egypt | ||
| Rest of Africa | ||


Key Questions Answered in the Report
What is the 2026 value of the Process Instrumentation market?
The market stands at USD 19.71 billion in 2026 based on Mordor Intelligence estimates.
Which region is growing fastest in process automation spending?
Asia-Pacific shows the quickest expansion with a 4.98% CAGR through 2031, led by semiconductor, pharma, and hydrogen investments.
Why are analytical instruments outpacing transmitters in growth?
Regulatory pushes for real-time quality assurance and subscription calibration services lift analytical-instrument demand at a 5.62% CAGR to 2031.
How are chip shortages affecting project timelines?
Extended microcontroller lead times deferred smart-transmitter deliveries, forcing many plants to keep analog loops in service until new fabs open in late 2026.
What technology trend is replacing legacy fieldbus networks?
Ethernet-APL enables 10 Mbps data and power on a single intrinsically safe pair, providing a migration path away from HART and Profibus while supporting edge analytics.
Which end-user industry will add the most new spending by 2031?
Pharmaceuticals, expanding at 6.83% CAGR, will add the largest incremental outlay as biologics and cell-therapy lines demand stringent environmental and traceability controls.
Page last updated on:


