Process Analytical Technology Market Size and Share
Market Overview
| Study Period | 2019 - 2030 |
|---|---|
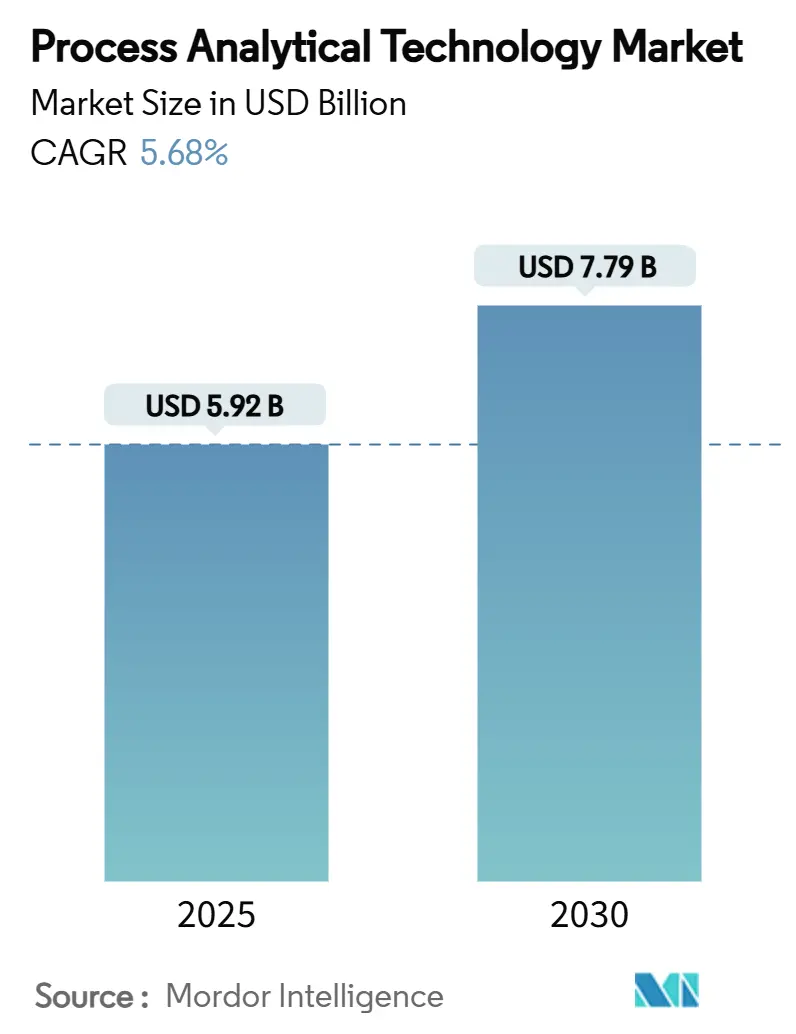
| Market Size (2025) | USD 5.92 Billion |
| Market Size (2030) | USD 7.79 Billion |
| Growth Rate (2025 - 2030) | 5.68% CAGR |
| Fastest Growing Market | North America |
| Largest Market | Asia Pacific |
| Market Concentration | Medium |
Major Players *Disclaimer: Major Players sorted in no particular order Image © Mordor Intelligence. Reuse requires attribution under CC BY 4.0. | |
Process Analytical Technology Market Analysis by Mordor Intelligence
The process analytical technology market size stands at USD 5.92 billion in 2025 and is forecast to reach USD 7.79 billion by 2030, expanding at a 5.68% CAGR over the period. Adoption accelerates as regulators mandate Quality-by-Design frameworks, producers migrate from batch to continuous manufacturing, and advanced analytics deliver real-time control. Continuous workflows shorten approval timelines and open high-margin revenue windows, while artificial-intelligence chemometrics transform PAT from passive measurement to predictive optimization. Spectroscopy’s maturing toolkits, growing biologics pipelines, and the emergence of AI-enabled analytics platforms together widen competitive openings for incumbents and entrants alike. Against these positives, high capital costs and a shortage of multivariate-data talent restrain smaller firms, yet targeted FDA incentives offset part of the burden and keep overall growth momentum intact.
Key Report Takeaways
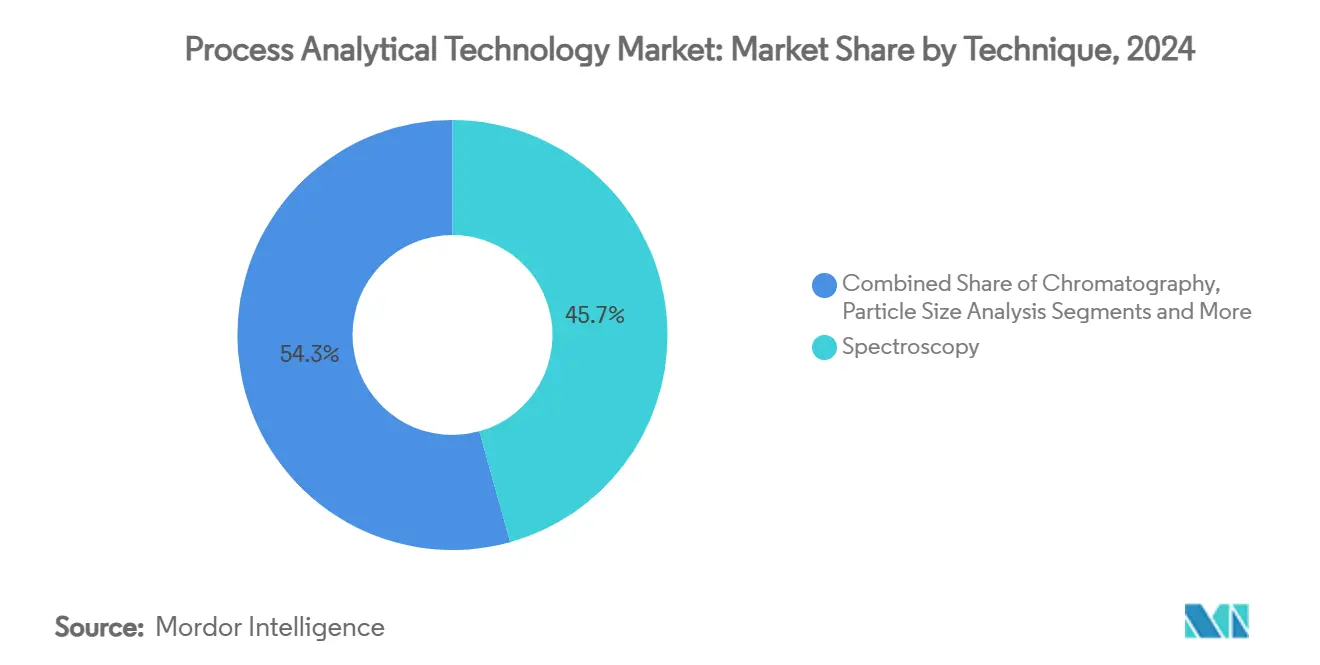
- By technique, spectroscopy led with 45.68% revenue share in 2024, and the segment is projected to post an 8.34% CAGR through 2030.
- By product, analyzers held 39.57% of the process analytical technology market share in 2024, while software and services are forecast to expand at 9.63% CAGR.
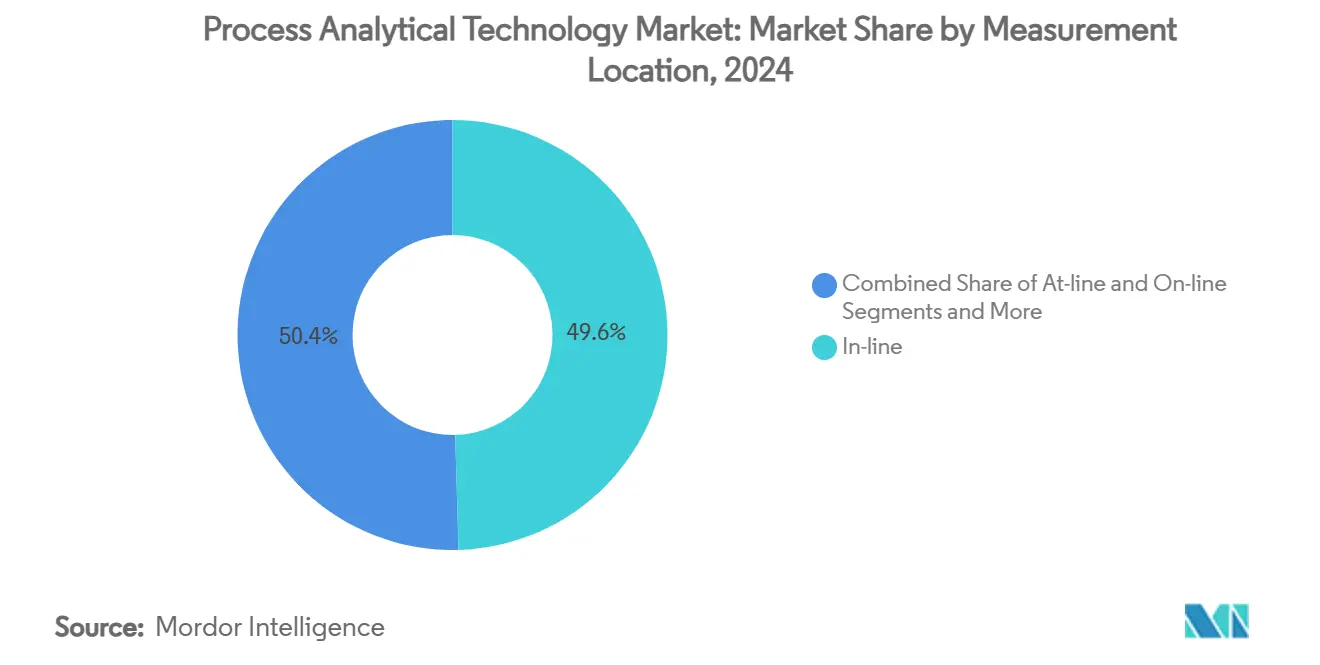
- By measurement location, in-line systems captured 49.56% share in 2024 and are poised to grow at 8.56% CAGR during the outlook.
- By end-user industry, pharmaceutical and biotechnology firms accounted for 61.23% of the process analytical technology market size in 2024 and are set to advance at an 8.08% CAGR to 2030.
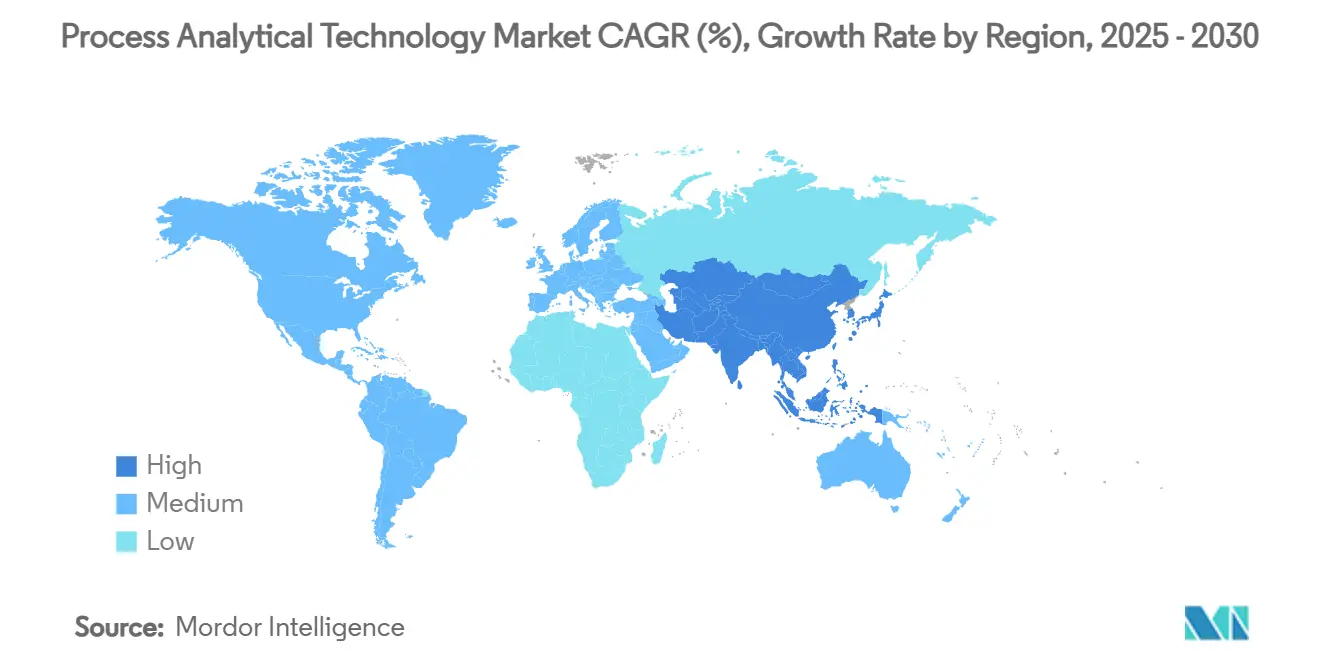
- By geography, North America remained dominant with 33.47% share in 2024; Asia-Pacific is the fastest-growing region at a 7.83% CAGR.
Global Process Analytical Technology Market Trends and Insights
Drivers Impact Analysis*
| Driver | (~) % Impact on CAGR Forecast | Geographic Relevance | Impact Timeline |
|---|---|---|---|
| Regulatory mandate for Quality-by-Design & cGMP | +1.5% | North America, European Union | Medium term (2-4 years) |
| Shift to continuous manufacturing workflows | +1.2% | North America, EU core, expanding to APAC | Long term (≥ 4 years) |
| Growing biologics & cell-gene therapy pipelines | +0.8% | Global, strongest in North America & EU | Medium term (2-4 years) |
| AI-driven chemometrics enabling predictive control | +0.6% | North America & EU leading, APAC following | Long term (≥ 4 years) |
| PAT in cultivated/alternative protein production | +0.4% | North America & EU, emerging in APAC | Long term (≥ 4 years) |
| Real-time sustainability monitoring for decarbonised operations | +0.3% | Global, EU regulatory leadership | Medium term (2-4 years) |
| Source: Mordor Intelligence | |||
Regulatory Mandate for Quality-by-Design & cGMP Compliance
The FDA’s graduation of continuous direct compression from its Emerging Technology Program in 2025 confirms that PAT-enabled continuous manufacturing has crossed from pilot to mainstream status.[1]Center for Drug Evaluation and Research, “News from Emerging Technology Program (ETP),” FDA, fda.govComplementary ICH Q2(R2) and Q14 guidelines finalized in 2024 set harmonized validation benchmarks, lowering global compliance uncertainty.[2]European Medicines Agency, “ICH Q2(R2) Guideline on Validation of Analytical Procedures – Step 5,” ema.europa.euManufacturers now face explicit expectations for real-time control that offline assays cannot satisfy. As a result, the process analytical technology market witnesses purchase decisions framed less around optional innovation and more around regulatory necessity. The agency’s Quality Management Maturity Assessment Program further positions advanced analytics as a clear differentiator during inspections, nudging late adopters to act.
Shift to Continuous Manufacturing Workflows
Continuous facilities documented 6-month faster approvals against batch counterparts, translating to USD 171–573 million extra revenue per asset. ICH Q13 clarified validation pathways in 2023, eliminating ambiguity around control strategies. PAT is indispensable in these lines because quality must be assured in real time, not after-the-fact. The tighter coupling of PAT and continuous processing reshapes plant economics and compels board-level investment even amid budget scrutiny. Vendors able to deliver turnkey, regulator-ready platforms therefore gain a strategic edge across the process analytical technology market.
Growing Biologics & Cell-Gene Therapy Pipelines
Complex, living systems require near-continuous surveillance of metabolites, viability, and product attributes—areas where classical testing falters. Machine-learning PAT models now predict cell culture drift with accuracy that exceeds manual oversight. Asia-Pacific capacity build-outs intensify demand for scalable, compliant solutions capable of operating across variable utility infrastructures. Perfusion bioreactors in particular depend on real-time PAT to balance productivity with quality, ensuring lot-to-lot consistency. Consequently, biologics remain a core engine pushing the process analytical technology market toward more sophisticated multi-parametric platforms.
AI-Driven Chemometrics Enabling Predictive Control
Neural networks applied to Raman spectra achieve up to 100% classification accuracy during fermentation runs.[3]PubMed Listing, “Deep-Learning Raman Classification for Fermentation Monitoring,” pubmed.ncbi.nlm.nih.gov This leap moves analytics from reactive alarms to genuine foresight, allowing operators to intervene before deviations manifest. Draft FDA guidance on AI in manufacturing underpins regulatory confidence, easing adoption hurdles. Organizations with strong data science benches now pull ahead, while smaller players grapple with infrastructure and talent gaps. Nevertheless, cost declines in edge computing and cloud-native chemometric packages gradually democratize access, sustaining broader market uptake.
Restraints Impact Analysis*
| Restraint | (~) % Impact on CAGR Forecast | Geographic Relevance | Impact Timeline |
|---|---|---|---|
| High capital cost & complex brown-field integration | –0.9% | Global, heavier in emerging markets | Short term (≤ 2 years) |
| Shortage of multivariate-data-skilled workforce | –0.7% | Worldwide, acute in Asia-Pacific | Medium term (2-4 years) |
| Cyber-security risks for network-connected instruments | –0.5% | Global, pronounced in regulated plants | Medium term (2-4 years) |
| Data-integrity & compliance concerns | –0.4% | North America & EU | Short term (≤ 2 years) |
| Source: Mordor Intelligence | |||
High Capital Cost & Complex Brown-Field Integration
Retrofitting legacy plants can double initial hardware budgets once engineering, validation, and downtime are tallied. Brown-field projects often face 12–18-month timelines to weave PAT into entrenched control loops. Smaller contract manufacturers struggle most, amplifying industry consolidation as well-capitalized peers forge ahead. FDA’s Advanced Manufacturing Technologies Designation Program partly offsets pain through speedier approvals, yet out-of-pocket cash remains substantial.
Shortage of Multivariate-Data-Skilled Workforce
Demand outstrips supply for specialists fluent in chemometrics, AI, and process engineering. Retraining classical chemists is time-consuming, while data scientists new to pharma battle steep learning curves. Asia-Pacific’s capacity surge magnifies the shortage, raising wage inflation and poaching risk. Universities have launched PAT-specific curricula, but a multiyear lag persists, keeping labor as a gating factor for the process analytical technology market in the medium term.
*Our forecasts treat driver/restraint impacts as directional, not additive. The impact forecasts reflect baseline growth, mix effects, and variable interactions.
Segment Analysis
Spectroscopy commanded 45.68% of 2024 revenue, underscoring its entrenched status as the workhorse technology across solids, liquids, and gases. Near-infrared assays now deliver 99–100% identification accuracy in fermentation media, proving that spectrum-based tools evolved far beyond basic fingerprinting. The segment’s 8.34% CAGR keeps it atop the process analytical technology market even as alternative modalities mature. Raman paired with AI classifies monoclonal-antibody charge variants in real time, allowing immediate chromatographic tweaks. Fourier-transform infrared units contribute to solvent-reduction strategies, aiding corporate sustainability. Chromatography remains indispensable for trace-level impurities despite slower growth; particle-size analyzers support drug-product performance; capillary electrophoresis and niche mass spectrometers fill specialized gaps. Together, these options build a layered analytic ecosystem that broadens the process analytical technology market without dethroning spectroscopy.
Second-generation spectrometers emphasize speed, miniaturization, and embedded intelligence, aligning with continuous-line needs. Suppliers bundle smart calibration libraries so operators can deploy models without coding skills, a boon in talent-tight settings. Regulatory comfort has risen as agencies review multivariate validation files more frequently, smoothing submissions. However, heightened instrument connectivity also raises cyber-risk exposure, prompting secure-by-design firmware rollouts. Despite these caveats, spectroscopy’s blend of versatility, affordability, and solid regulatory precedent secures its place as the backbone technology for years to come.


By Product: Software & Services Power Digital Transformation
Analyzers held a 39.57% slice of 2024 spending, but software and services post the briskest 9.63% CAGR as firms pivot toward data-centric value. Digital twins simulate plant conditions and recommend optimal set-points, turning raw spectra into actionable intelligence. Vendors monetize subscription updates, model libraries, and remote calibration, unlocking annuity streams that slightly decouple revenue from hardware cycles. The process analytical technology market size for software modules attached to analyzers is projected to reach USD 3.2 billion by 2030, illustrating the shift toward intangible assets.
Samplers and probes, though less glamorous, are critical. Continuous reactors need rugged, sterile interfaces that prevent fouling and maintain representativeness. Sensor platforms extend monitoring to temperature, pH, and dissolved gases, enabling holistic dashboards. The product mix trend indicates buyers no longer evaluate hardware in isolation; integrated ecosystems that combine sturdy analyzers with smart analytics and lifecycle services increasingly win procurement battles.
By Measurement Location: In-Line Instruments Take Center Stage
In-line systems captured 49.56% revenue in 2024 while expanding at 8.56% CAGR, reflecting a preference for non-intrusive, immediate feedback. Tablets now undergo content-uniformity checks via UV/Vis probes mounted directly inside coating drums, sidestepping sample prep delays. The resulting data feeds machine-learning algorithms that fine-tune spray rates, slashing waste. On-line configurations sit adjacent to the line, used when optical access is tricky or hazardous; at-line stations serve high-viscosity biologics where filtration or dilution is compulsory.
The hierarchy mirrors economic logic: deeper integration costs more upfront but avoids scrap and recalls. As continuous lines proliferate, the premium for true in-line capability appears justified, sustaining a robust pipeline for fiber-optic probes, flow cells, and sapphire-windowed reactors. Simultaneously, vendors work to miniaturize instrumentation so it can fit within space-constrained skid layouts while still delivering full chemometric horsepower.
By End-User Industry: Pharma & Biotech Remain the Engine
Pharmaceutical and biotechnology producers controlled 61.23% of 2024 demand and should climb at 8.08% CAGR through 2030, reinforcing their anchor role in the process analytical technology market. FDA guidance couples continuous manufacturing and PAT inextricably, converting capital budgets into compliance necessities. Biologic therapies introduce complexity that multiplies PAT touchpoints across seed trains, perfusion reactors, and ultrafiltration steps.
Outside pharma, food-and-beverage firms embed near-infrared sensors for moisture and adulterant detection, while chemicals and petrochemicals target catalyst monitoring to extend run lengths. Oil and gas operators deploy predictive maintenance modules to bypass unplanned downtime. Water and wastewater utilities rely on optical probes for nutrient and contaminant surveillance, meeting stricter environmental codes. Cross-industry interest diversifies revenue, yet the regulatory urgency within life sciences continues to dominate vendor R&D roadmaps.
Geography Analysis
North America retained 33.47% of 2024 revenue on the back of robust biopharma infrastructure and transparent regulatory pathways. The FDA’s Advanced Manufacturing Technologies Designation accelerates approvals, incentivizing domestic facilities to integrate end-to-end analytics. Canadian producers leverage proximity to United States know-how, while Mexico’s contract manufacturing growth spurs demand for more affordable yet compliant solutions. The process analytical technology market size in the region is projected at USD 2.8 billion by 2030, reflecting steady upgrade cycles and digital-first initiatives.
Asia-Pacific is the fastest climber at 7.83% CAGR, underpinned by large-scale capacity additions in China and India. Government modernization programs, paired with harmonization to ICH norms, stoke investment in state-of-the-art plants that leapfrog legacy practices. South Korea’s biosimilar boom and Japan’s focus on continuous small-molecule lines further thicken demand. The rise of alternative-protein ventures in Singapore and cultivated-meat pilots in Australia round out a multi-sector growth picture that bolsters the process analytical technology market across the region.
Europe holds a mature but dynamic stance. Germany’s strong instrument manufacturing base feeds local supply chains, while France and the Netherlands channel funds into cell-therapy hubs. The European Medicines Agency’s updated analytical procedure guideline tightens expectations but also harmonizes submissions, trimming project risk. Post-Brexit United Kingdom maintains alignment to assure export continuity, and Scandinavian countries push green-manufacturing PAT use cases tied to decarbonisation. Overall, Europe balances incremental upgrades in legacy plants with greenfield biologics mega-sites, keeping demand resilient.

Competitive Landscape
The field remains moderately fragmented, with the top five vendors capturing just above 40% of 2024 turnover. Thermo Fisher Scientific’s USD 4.1 billion purchase of Solventum’s purification and filtration unit signals a deeper dive into upstream bioproduction analytics, broadening the firm’s already extensive toolkit. Bruker’s acquisition of Optimal Group injects the synTQ knowledge-management suite, enabling vendor-agnostic integration that appeals to buyers wary of lock-in.
ABB’s Do More With Digital campaign positions its distributed control platforms as analytics-ready, adding value beyond traditional electromechanical strengths. Emerson’s DeltaV upgrades expand Ethernet options and streamline state-based control, smoothing PAT data flow into plant historians. Specialized newcomers target AI chemometrics in cloud-native packages, challenging incumbents on speed of model deployment rather than brute hardware prowess. Midsize firms differentiate through turnkey cultivated-protein kits or modular, single-use sampling probes, capitalizing on niches the giants overlook.
Supply-side moves increasingly revolve around ecosystem creation: cloud analytics, open APIs, and subscription calibration libraries. End-users seek lifecycle partners, not just instrument vendors, rewarding firms that can bundle validation templates, cyber-security certification, and 24/7 remote diagnostics. Despite consolidation, white-space remains in regional service delivery and tailored AI model development, ensuring competitive churn within the process analytical technology market.
Process Analytical Technology Industry Leaders
Thermo Fisher Scientific
Agilent Technologies
Danaher
Sartorius AG
Bruker Corporation
- *Disclaimer: Major Players sorted in no particular order

Recent Industry Developments
- March 2025: Repligen Corporation bought 908 Devices’ desktop portfolio to deepen its PAT offering for bioprocessing, while 908 Devices refocused on handheld safety tools.
- March 2025: HORIBA unveiled four instruments, including a molecular-fingerprinting system and a Raman screening tool aimed at vaccine development and protein characterization.
- February 2025: Thermo Fisher Scientific closed the USD 4.1 billion Solventum purification and filtration acquisition, targeting USD 125 million synergies within five years


Global Process Analytical Technology Market Report Scope
| Spectroscopy | Near-Infrared (NIR) |
| Fourier-Transform Infrared (FT-IR) | |
| Raman | |
| Chromatography | |
| Particle Size Analysis | |
| Capillary Electrophoresis | |
| Others (NMR, Mass-Spec, Titrators) |
| Analyzers |
| Samplers & Probes |
| Sensors |
| Software & Services |
| In-line |
| On-line |
| At-line |
| Pharmaceutical & Biotechnology |
| Food & Beverage |
| Chemical & Petrochemical |
| Oil & Gas |
| Water & Wastewater |
| Others (Metals, Mining, Pulp-&-Paper) |
| North America | United States |
| Canada | |
| Mexico | |
| Europe | Germany |
| United Kingdom | |
| France | |
| Italy | |
| Spain | |
| Rest of Europe | |
| Asia-Pacific | China |
| Japan | |
| India | |
| Australia | |
| South Korea | |
| Rest of Asia-Pacific | |
| Middle East and Africa | GCC |
| South Africa | |
| Rest of Middle East and Africa | |
| South America | Brazil |
| Argentina | |
| Rest of South America |
| By Technique | Spectroscopy | Near-Infrared (NIR) |
| Fourier-Transform Infrared (FT-IR) | ||
| Raman | ||
| Chromatography | ||
| Particle Size Analysis | ||
| Capillary Electrophoresis | ||
| Others (NMR, Mass-Spec, Titrators) | ||
| By Product | Analyzers | |
| Samplers & Probes | ||
| Sensors | ||
| Software & Services | ||
| By Measurement Location | In-line | |
| On-line | ||
| At-line | ||
| By End-User Industry | Pharmaceutical & Biotechnology | |
| Food & Beverage | ||
| Chemical & Petrochemical | ||
| Oil & Gas | ||
| Water & Wastewater | ||
| Others (Metals, Mining, Pulp-&-Paper) | ||
| By Geography | North America | United States |
| Canada | ||
| Mexico | ||
| Europe | Germany | |
| United Kingdom | ||
| France | ||
| Italy | ||
| Spain | ||
| Rest of Europe | ||
| Asia-Pacific | China | |
| Japan | ||
| India | ||
| Australia | ||
| South Korea | ||
| Rest of Asia-Pacific | ||
| Middle East and Africa | GCC | |
| South Africa | ||
| Rest of Middle East and Africa | ||
| South America | Brazil | |
| Argentina | ||
| Rest of South America | ||


Key Questions Answered in the Report
1. What is the current value of the process analytical technology market?
The market is valued at USD 5.92 billion in 2025 and is projected to reach USD 7.79 billion by 2030.
2. Which technique leads the process analytical technology market?
Spectroscopy dominates with 45.68% revenue share in 2024 and is growing at an 8.34% CAGR.
3. Why is continuous manufacturing important for PAT adoption?
Continuous lines rely on real-time quality assurance; PAT integration shortens approvals by six months and can unlock up to USD 573 million in extra revenue per product.
4. Which region is expanding fastest?
Asia-Pacific exhibits the highest growth at a 7.83% CAGR through 2030, driven by biopharma capacity expansion and regulatory harmonization.
5. What are the main barriers to wider PAT deployment?
High retrofit costs, limited multivariate-data talent, cyber-security concerns, and strict data-integrity requirements remain key hurdles.
Page last updated on:


