
Analytical Standards Market Size and Share
Market Overview
| Study Period | 2020 - 2031 |
|---|---|
| Market Size (2026) | USD 1.61 Billion |
| Market Size (2031) | USD 2.13 Billion |
| Growth Rate (2026 - 2031) | 5.82 % |
| Fastest Growing Market | Asia Pacific |
| Largest Market | North America |
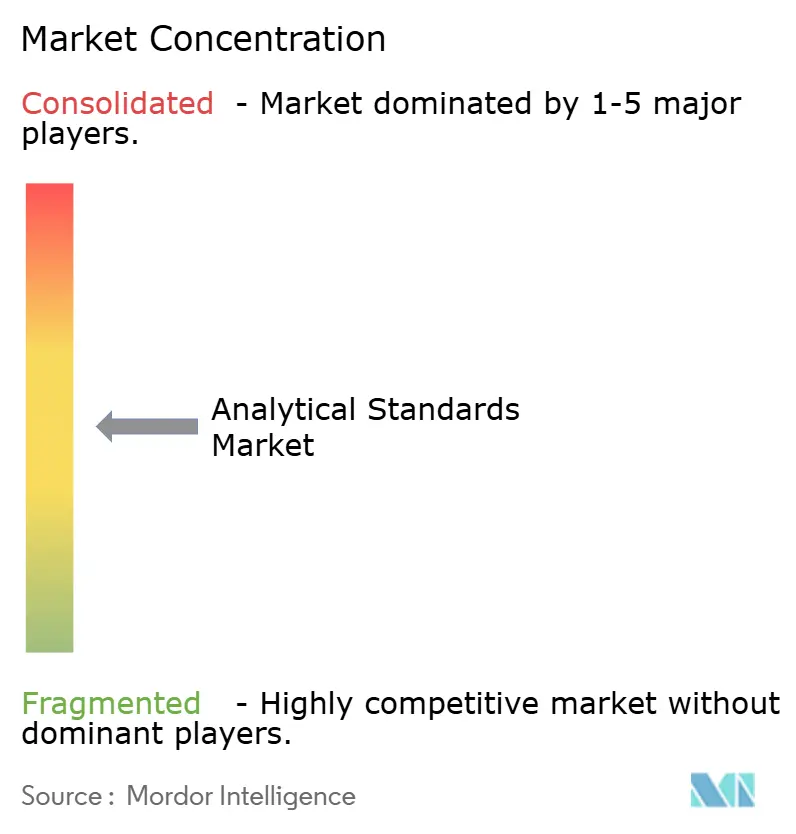
| Market Concentration | Medium |
Major Players *Disclaimer: Major Players sorted in no particular order Image © Mordor Intelligence. Reuse requires attribution under CC BY 4.0. | |
Analytical Standards Market Analysis by Mordor Intelligence
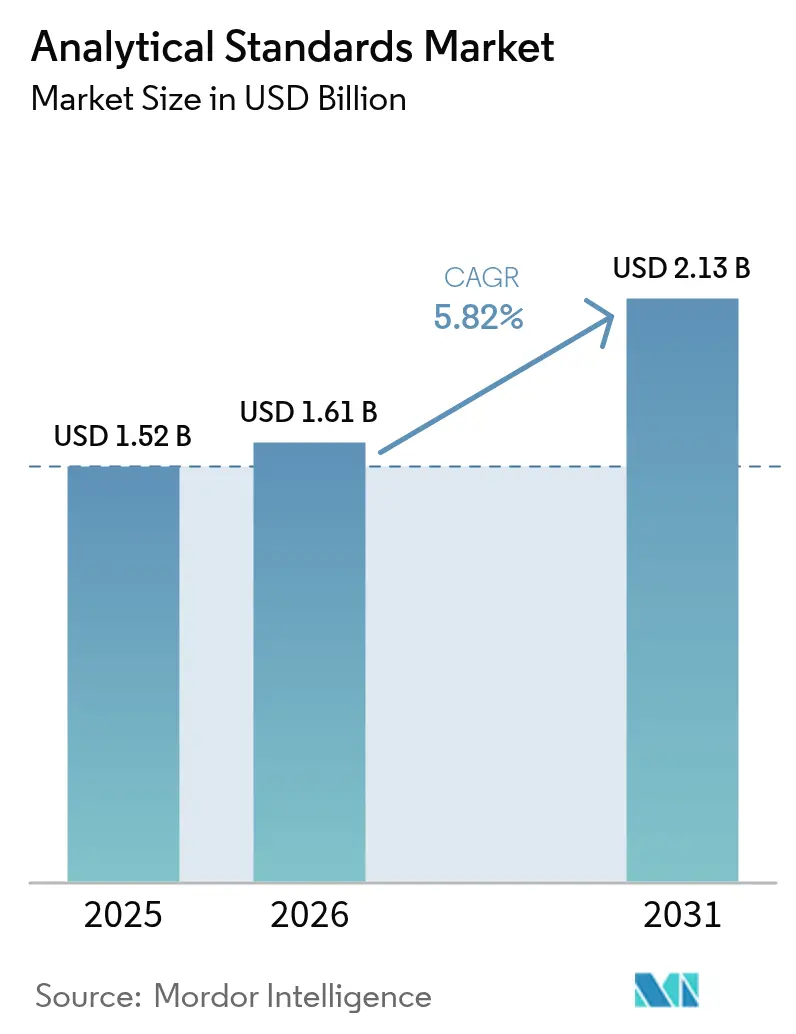
The analytical standards market size was valued at USD 1.52 billion in 2025 and estimated to grow from USD 1.61 billion in 2026 to reach USD 2.13 billion by 2031, at a CAGR of 5.82% during the forecast period (2026-2031). This trajectory underscores how demand has expanded from core pharmaceutical usage into food, environmental and forensic testing. Multijurisdictional guidelines such as ICH Q2(R2) and Q14, adopted in 2024, have reshaped validation rules, prompting laboratories to upgrade reference-material portfolios. Certified reference material (CRM) producers benefit as users seek products that satisfy new requirements for specificity, selectivity and traceability. Meanwhile, contract research organizations (CROs) concentrate procurement power, heightening volume purchases and price sensitivity across the analytical standards market. Intensifying environmental rules—most notably the U.S. EPA’s PFAS Method 1633—create fresh demand for matrix-matched CRMs that mimic complex field samples. Counterbalancing those drivers are supply-chain volatility for specialty chemicals and a severe shortage of skilled analysts, both of which constrain expansion.
Key Report Takeaways
- By technique, chromatography held 38.05% of analytical standards market share in 2025; mass spectrometry is forecast to advance at a 7.38% CAGR through 2031.
- By product type, organic standards captured 60.72% of the analytical standards market size in 2025, while matrix-matched CRMs are set to post an 7.66% CAGR to 2031.
- By application, bioanalytical testing commanded 29.12% of the analytical standards market size in 2025; microbial and environmental testing is projected to expand at an 8.26% CAGR through 2031.
- By end-user, the pharmaceutical and biotechnology segment led with 41.86% revenue share in 2025, whereas forensics and toxicology is poised for an 8.05% CAGR to 2031.
- By geography, North America led with 39.20% revenue share in 2025, whereas Asia-Pacific is poised for an 6.36% CAGR to 2031.
Note: Market size and forecast figures in this report are generated using Mordor Intelligence’s proprietary estimation framework, updated with the latest available data and insights as of 2026.
Market Trends and Insights
Drivers Impact Analysis of Analytical Standards Market*
| Driver | % Impact on CAGR Forecast | Geographic Relevance | Impact Timeline |
|---|---|---|---|
| Increasing global pharmaceutical and biotechnology expenditure | +1.8% | North America, Europe, Asia | Long term (≥ 4 years) |
| Stringent international quality and safety regulations | +1.5% | Global | Medium term (2-4 years) |
| Growth in contract research and testing organizations | +1.2% | Global, with APAC fastest | Medium term (2-4 years) |
| Emergence of personalized medicine and complex biologics requiring advanced reference standards | +1.3% | North America & Europe innovation hubs, APAC adoption | Long term (≥ 4 years) |
| Technological advancements in analytical instrumentation | +0.8% | North America & Europe R&D centers, APAC rollout | Short term (≤ 2 years) |
| Rising adoption of certified reference materials across industries | +0.6% | Regulated industries worldwide | Medium term (2-4 years) |
| Source: Mordor Intelligence | |||
Global Pharmaceutical and Biotechnology Spend Escalation
Pharmaceutical outlays touched USD 1.64 trillion in 2024 and remain on track to reach USD 2.25 trillion by 2028, a trend that multiplies analytical runs needed for drug development, release and stability testing. Biotechnology outsourcing widens the effect as sponsors require CRO partners to maintain extensive CRM libraries for each study phase. The U.S. Food and Drug Administration cleared 50 new drugs in 2024 and anticipates roughly 70 approvals in 2025, each reliant on validated methods anchored by traceable reference materials[1]U.S. Food and Drug Administration, “CDER Drug Approvals 2024,” fda.gov. Oncology leads therapeutics value and demands ultra-high-purity standards to qualify complex biologics. Collectively these factors power sustained growth across the analytical standards market.
Stringent International Quality and Safety Regulations
ICH Q2(R2) and Q14 introduced lifecycle thinking to analytical procedure validation, mandating periodic revalidation whenever methods transfer between sites. Laboratories now require additional CRMs to demonstrate robustness across matrix, range and linearity assessments. Europe complements the shift through guidance on environmental risk and artificial-intelligence applications in medicines, expanding testing breadth[2]European Medicines Agency, “Guideline on Artificial Intelligence in Medicinal Products,” ema.europa.eu. Fifty-two authorities participating in the Pharmaceutical Inspection Co-operation Scheme (PIC/S) are aligning good-manufacturing-practice audits, creating unified demand for high-quality reference materials. In the United States, the FDA’s Quality Management Maturity program underscores automation, further tightening calibration and verification needs that only certified standards can meet.
Expansion of Contract Research and Testing Organizations
Leading CROs such as IQVIA and Thermo Fisher’s PPD division generated double-digit revenue growth in 2024 as sponsors shifted fixed costs into outsourced models. Nearly 37% of laboratories designate analytical testing as their top outsourced activity, concentrating orders with service providers that in turn purchase standards in bulk. Chinese CROs including Wuxi AppTec and Pharmaron broaden global footprints, reinforcing Asia’s pull on CRM supply. The clustering effect improves forecast visibility for CRM vendors but raises expectations for just-in-time delivery and multi-compound custom blends.
Technological Advances in Analytical Instrumentation
Orbitrap Astral Zoom and Orbitrap Excedion Pro systems introduced in 2025 cut analysis time by 35% and lift throughput by 40%, allowing labs to analyze more samples per shift. Smaller injection volumes and higher mass accuracy favor CRMs with lower uncertainty, spurring premium-priced offerings. Artificial-intelligence data workflows reduce manual review yet require rigorously characterized performance-qualification standards to ensure algorithm reliability. Instrument automation also builds the case for synthetic multicomponent reference mixes that can serve dozens of methods through autodilution modules.
Restraints Impact Analysis of Analytical Standards Market*
| Restraints Impact Analysis | (~) % Impact on CAGR Forecast | Geographic Relevance | Impact Timeline |
|---|---|---|---|
| High cost of high-purity standards and instrumentation | -1.4% | Global, with acute effect in emerging markets | Medium term (2-4 years) |
| Shortage of skilled analytical personnel | -1.1% | Severe in North America & Europe | Long term (≥ 4 years) |
| Complex multijurisdictional regulatory compliance | -1.0% | Global | Medium term (2-4 years) |
| Supply chain vulnerabilities for specialty chemicals | -0.9% | Global, most disruptive in Asia-Pacific manufacturing | Short to medium term (≤ 4 years) |
| Source: Mordor Intelligence | |||
High Cost of High-Purity Standards and Instrumentation
Premium CRMs entail multi-stage purification, isotopic characterization and ISO 17034 audits, elevating unit prices beyond many small laboratories’ budgets. Advanced LC-MS, GC-MS and ICP-MS platforms needed to exploit those standards have list prices easily topping USD 1 million, stretching capital allocations. Tariff discussions related to semiconductor supply add additional cost uncertainty for detectors and optics. As a result, some labs defer upgrades or lengthen CRM replacement cycles, tempering growth in the analytical standards market[3]SEMATECH, “Semiconductor Supply Chain Tariff Analysis,” sematech.org.
Shortage of Skilled Analytical Personnel
Vacancy surveys show more than 46% open positions in clinical labs during 2024, while retirements loom large in cytology and blood banking. Analytical chemist roles are forecast to grow 6% through 2032, yet academic programs yield too few graduates to fill demand. Salary compression, pandemic-era burnout and lengthy training pipelines worsen attrition. Staffing gaps cap instrument utilization and occasionally force reliance on contract testing, indirectly slowing in-house CRM consumption.
*Our forecasts treat driver/restraint impacts as directional, not additive. The impact forecasts reflect baseline growth, mix effects, and variable interactions.
Analytical Standards Market Segment Analysis
By Technique:
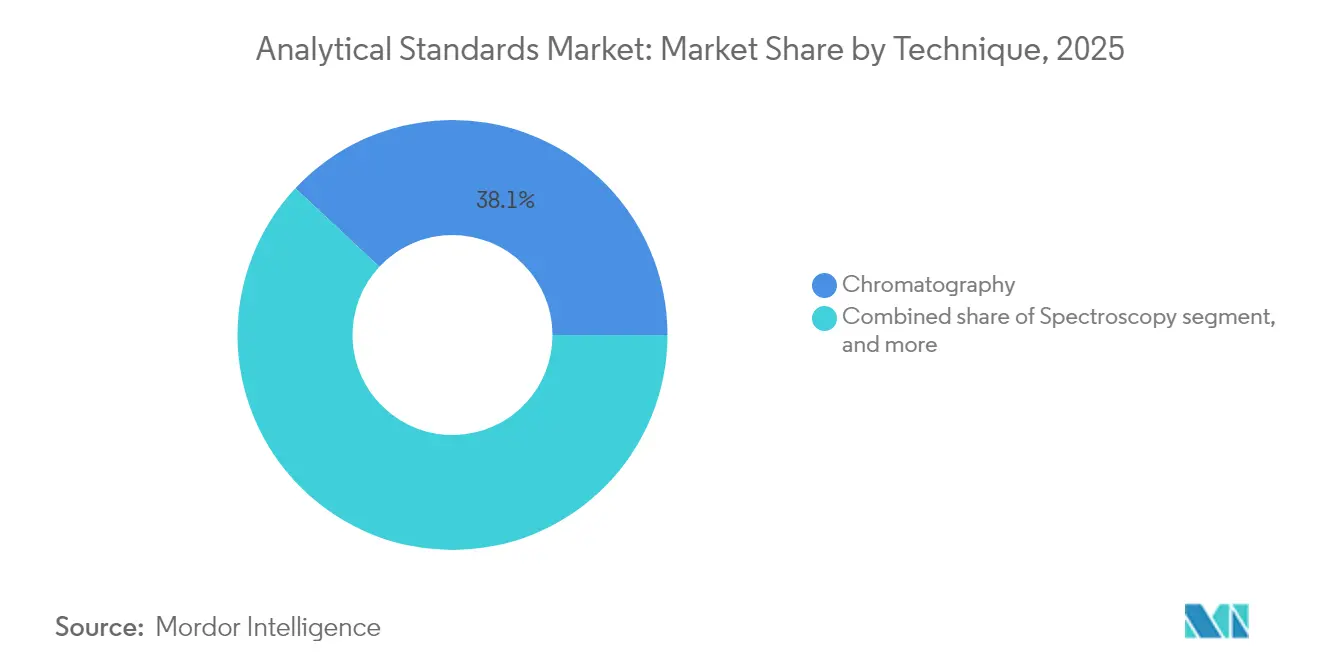
Mass-Spectrometry Innovation Accelerates Precision ApplicationsChromatography retained 38.05% of analytical standards market share in 2025 thanks to its cross-sector versatility. Meanwhile, mass spectrometry is projected to log a 7.38% CAGR to 2031, buoyed by Orbitrap, time-of-flight and ion-mobility advances that improve speed and sensitivity. The analytical standards market size attached to mass-spectrometry methods is anticipated to expand steadily as oncology, neurology and metabolomics studies demand ever lower limits of detection. New platforms such as Orbitrap Astral Zoom deliver 10 Hz scan rates while cutting solvent use, magnifying laboratories’ demand for multianalyte CRMs that streamline calibration. Spectroscopy and titrimetry maintain niche relevance; Karl Fischer titration remains irreplaceable for moisture assays of drug substances and depends on traceable water standards certified to 0.1% uncertainty.



By Product Type:
Matrix-Matched CRMs Earn Regulatory PreferenceOrganic CRMs covered 60.72% of total revenues in 2025, yet the fastest expanding slice is matrix-matched materials with an 7.66% CAGR forecast. Environmental authorities insist on standards blended into wastewater, soil or serum backgrounds to replicate ion-suppression effects. That need pushes CRM producers to master homogenization and long-term stability studies across complex matrices. Inorganic standards keep a foothold through heavy-metal surveillance in food, soil and recycled plastics. Distinct classification between CRMs and working standards grows sharper as ISO 17034 proliferates; only CRMs offer legally defensible traceability, making them indispensable for regulated submissions.
By Application:
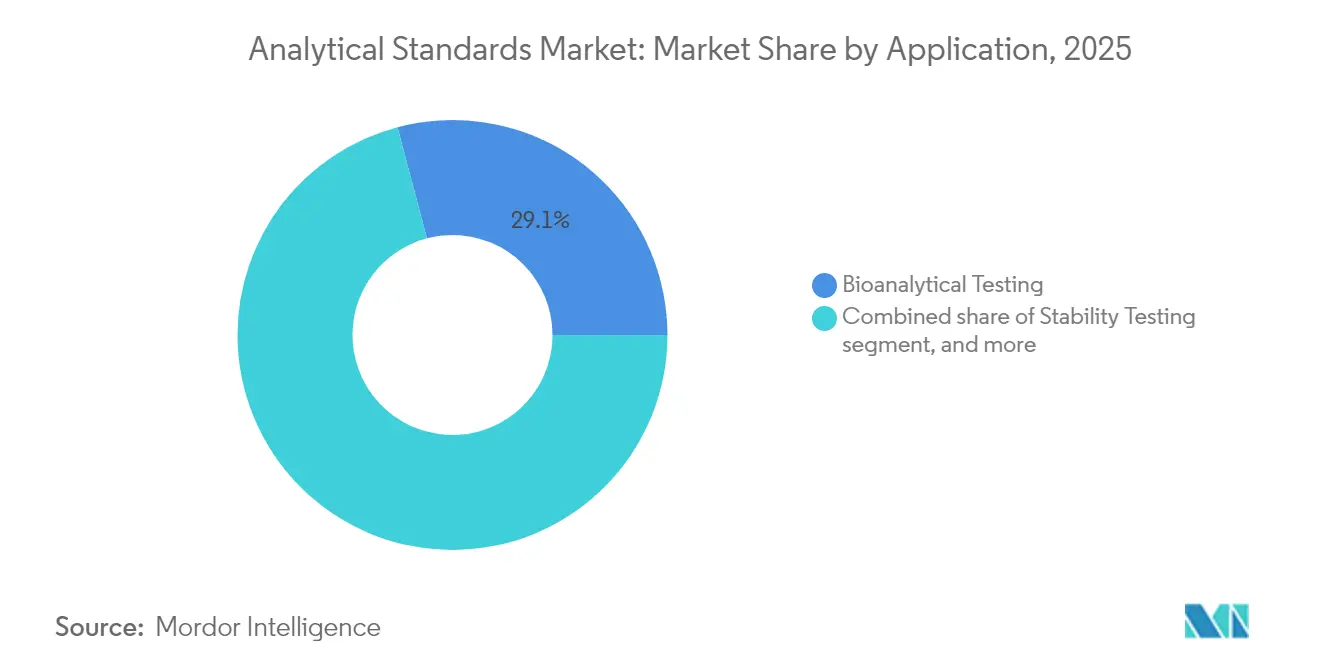
Environmental Testing Surges Amid PFAS ScrutinyBioanalytical procedures accounted for 29.12% of 2025 revenue, but microbial and environmental testing shows the highest momentum with an 8.26% CAGR outlook. The analytical standards market size tied to PFAS, PCBs and emerging contaminants climbs rapidly as water utilities and remediation firms race to meet stricter discharge limits. In pharmaceuticals, raw-material ID and batch release rely on authenticated reference materials for potency and impurity profiling, creating steady baseline demand. Circular-economy initiatives add new use cases—such as heavy-metal screening in recycled PET—further lifting consumption of multi-element CRMs.
By End-User:
Forensics Drives Rapid-Screening InnovationPharmaceutical and biotechnology firms retained 41.86% of 2025 turnover, reflecting exhaustive in-house and outsourced testing needs. Forensics and toxicology, however, will outpace with an 8.05% CAGR as workplace drug monitoring and narcotics enforcement intensify. Methods like ambient ionization-MS can scan a hair sample in 1 minute, but still depend on robust calibration curves anchored by CRMs covering opioids, stimulants and novel psychoactive substances. Food-and-beverage labs retain stable demand, especially where PFAS and mycotoxin limits converge across jurisdictions.
Geography Analysis
North America Analytical Standards Market
North America held 39.20% revenue share in 2025 thanks to entrenched pharma manufacturing and a mature regulatory climate. Laboratories across the United States are early adopters of ICH Q2(R2) lifecycle validation, accelerating CRM refresh cycles.
Europe and APAC Analytical Standards Market
Europe sustains high penetration via EMA-driven harmonization and a strong culture of accredited reference materials. The analytical standards market size in Asia-Pacific is primed for a 6.36% CAGR through 2031, underpinned by China and India scaling GMP facilities and embracing PIC/S membership. Singapore’s biopharma clusters and South Korea’s push into cell-and-gene therapy add incremental pull.
South America and Middle East Analytical Standards Market
South America and the Middle East witness rising investment in food safety and petrochemical testing, creating entry points for CRM suppliers that can localize inventory and technical support.


Regulatory Landscape
Analytical standards demand is governed by a mix of global method-validation guidance, accreditation rules, and pharmacopeial expectations that define traceability for reference materials and method performance. ICH Q2(R2) (Validation of Analytical Procedures) and ICH Q14 (Analytical Procedure Development) became effective on 14 June 2024, codifying lifecycle-based validation and increasing the frequency of comparability exercises during method transfer and site changes, which in turn elevates requirements for certified reference materials (CRMs) and well-characterized working standards.
In 2026, standard-setting activity added new anchors for compliance programs. Parenteral Drug Association published PDA/ANSI Standard 07-2026 (April 2026) covering analytical procedure transfer, comparability, and the use of platform analytical procedures in biologics, supporting more structured transfer packages and reference-standard control strategies. Separately, Eurachem and CITAC released the 4th edition of the Guide to Quality in Analytical Chemistry (2026), reinforcing accreditation-aligned expectations for measurement uncertainty, traceability, and quality systems used by testing laboratories and reference material producers.
Value Chain Analysis
The value chain begins with high-purity chemical and biochemical inputs (including specialty synthesis, stable isotopes, and solvent systems) and proceeds through reference material design, synthesis/isolation, characterization (purity assignment, homogeneity, stability, and uncertainty), and certification under quality systems such as ISO 17034 and lab accreditation practices aligned with ISO/IEC 17025. Producers then package and distribute catalog standards and custom blends via direct sales and distributor networks, while technical documentation (certificates of analysis, traceability statements, and storage/handling instructions) is a core value-added output that determines suitability for regulated submissions.
Downstream, pharmaceutical and biotechnology manufacturers, CROs/CDMOs, environmental and water labs, and forensics labs consume standards in method development, validation, transfer, and routine QC. Bottlenecks concentrate in limited capacity for GMP-grade, high-purity materials and in long lead times for custom formulations (commonly cited at 12-18 months), which pushes buyers toward earlier forecasting and higher safety-stock strategies (reported shifts from 30-60 days in 2020 to 90-120 days by 2026 for critical reagents in the United States). Analytical testing itself acts as a throughput constraint in advanced modalities (for example, ADC release testing), increasing outsourcing and bulk procurement by large testing organizations that demand reliable supply continuity and consistent lot-to-lot performance.
Competitive Landscape
The analytical standards industry remains moderately fragmented, yet consolidation is accelerating. Thermo Fisher Scientific plans USD 40-50 billion for acquisitions and recently agreed to buy Solventum’s Purification & Filtration unit for USD 4.1 billion, extending downstream bioprocess coverage.
Waters Corporation’s USD 17.5 billion merger with BD’s biosciences business will create a combined entity spanning chromatography, clinical diagnostics and cellular analysis. Agilent reinforces its position via the USD 925 million BIOVECTRA purchase and the Infinity III LC launch that embeds self-diagnostic software to simplify compliance.
Bruker’s timsMetabo platform showcases innovation in 4D-metabolomics, slashing solvent consumption by 95% while boosting compound-annotation confidence. Mid-tier specialists compete effectively in matrix-matched CRMs where agility and custom formulation trump sheer scale.
Analytical Standards Industry Leaders
Agilent Technologies
Merck KGaA (Sigma-Aldrich)
Waters Corporation
LGC Group
Thermo Fisher Scientific, Inc.
- *Disclaimer: Major Players sorted in no particular order
Analytical Standards Market Companies Covered in this Report
- Agilent Technologies
- Merck
- Waters Corporation
- Thermo Fisher Scientific
- LGC Group
- Spex Certiprep
- Restek
- Mallinckrodt Pharmaceuticals
- GFS Chemicals
- Chiron
- Cytiva
- AccuStandard Inc.
- Dr. Ehrenstorfer GmbH
- TRC (Toronto Research Chemicals)
- Absolute Standards Inc.
- Phenomenex Inc.
- PerkinElmer (Revvity)
- Bruker
- Honeywell – Fluka Analytical
- TraceCERT (Sigma-Aldrich)

Market Opportunities and Future Outlook
Whitespace is expanding where laboratories need standards that align with newer validation, transfer, and digital-workflow requirements, especially for complex biologics and multi-attribute analytics. USP actions in 2026 provide concrete demand signals: USP launched MethodConnect (May 2026) as a machine-readable digital library of 2,600 USP-NF test methods designed for integration into digital laboratory ecosystems, and USP published product-specific emerging biologics standards for public comment (June 2026) covering epoetin, interferon beta 1a, rituximab, and bevacizumab. These initiatives elevate the premium on reference materials that are tightly mapped to compendial and platform methods, with robust metadata and change-control support suitable for regulated environments.
On the supply side, updates to competence frameworks and harmonization projects create an opportunity for CRM producers and instrument-aligned standard providers to differentiate via accreditation readiness and documentation quality. A new ISO work item to revise ISO 17034:2016 (ISO/AWI 17034, approved December 2025) highlights ongoing tightening around reference material producer competence, favoring suppliers that can demonstrate rigorous characterization, uncertainty assignment, and traceability. The combination of compendial digitization (USP MethodConnect), emerging biologics monographs/standards under consultation, and evolving producer-competence expectations supports product lines such as matrix-matched CRMs, multi-analyte mixes compatible with automated workflows, and reference materials designed explicitly for method transfer and comparability packages.
Recent Industry Developments in Analytical Standards Market
- May 2026: Agilent Technologies launched new 8890B and 8860B gas chromatography systems featuring GC Assist for remote monitoring, diagnostics, and troubleshooting. The upgrade targets uptime and data-quality control in regulated labs, supporting more consistent runs that rely on tightly controlled calibration and verification standards.
- July 2025: Waters Corporation and Becton Dickinson announced a USD 17.5 billion merger combining Waters with BD’s biosciences business. The combination broadened an integrated instruments-and-consumables footprint, influencing bundled workflows that can pull through demand for application-specific standards used in chromatography and bioanalysis.
- October 2024: Agilent Technologies launched the Infinity III LC Series with InfinityLab Assist Technology. Added self-diagnostics and workflow automation strengthened compliance-oriented operation and increased the need for well-characterized reference materials that maintain method performance across higher-throughput LC environments.


Analytical Standards Market Report Scope and Research Methodology
Market Definition and Coverage
This market covers revenues generated from analytical standards that are used to calibrate instruments and verify analytical methods, mainly in regulated laboratory workflows where accuracy and traceability are required.
Scope exclusions: We exclude analytical instruments, general lab consumables, and testing services that do not include the sale of analytical standards as a product.
Segments Covered in This Report
- By Technique
- Chromatography
- Spectroscopy
- Mass Spectrometry
- Titrimetry
- Physical-Properties Tests
- Other Techniques
- By Product Type
- Organic Standards
- Inorganic Standards
- Matrix-Matched/Certified Reference Materials
- By Application
- Bioanalytical Testing
- Stability Testing
- Raw-Material & Batch-Release Testing
- Microbial & Environmental Testing
- Other Applications
- By End-User
- Pharmaceutical & Biotechnology
- Food & Beverage
- Environmental & Water
- Forensics & Toxicology
- Chemicals & Petrochemicals
- Academic & Contract Labs
- Geography
- North America
- United States
- Canada
- Mexico
- Europe
- Germany
- United Kingdom
- France
- Italy
- Spain
- Rest of Europe
- Asia-Pacific
- China
- Japan
- India
- Australia
- South Korea
- Rest of Asia-Pacific
- Middle East & Africa
- GCC
- South Africa
- Rest of Middle East & Africa
- South America
- Brazil
- Argentina
- Rest of South America
- Rest of Middle East
- North America
Data Sources, Market Sizing, and Validation
Desk Research
Desk research was used to set market context and build consistent assumptions that can be cross-checked before the numbers are finalized. We relied on public, non-paywalled sources such as USP and other pharmacopeial publications, ICH guidance updates, US EPA method documentation for emerging contaminants, and government trade statistics where relevant for specialty chemicals.
In parallel, we reviewed company annual reports, investor presentations, product catalogs, and press releases to understand product positioning and the usual price and pack-size patterns. We also scanned patent databases to see where new analyte panels and matrix-specific formats are being developed, which supported the demand indicators used in our model. The desk inputs referenced in this section are illustrative only, and additional public sources were used for data collection, validation, and clarification.
Primary Interviews and Surveys
Primary work was used to test assumptions that are hard to read from public sources, such as how quickly labs shift to new regulated methods, which reference material formats end users prefer, and how procurement cycles influence volumes. We spoke with a mix of manufacturers, distributors, and end users across APAC, EMEA, and the Americas, so regional differences in regulatory intensity and lab testing mix could be reflected in the sizing and forecast.
Distribution of primary research fieldwork respondents
| Company type | Respondent position | Region |
|---|---|---|
| Top tier: 28% | CXOs: 13% | APAC: 42% |
| Mid tier: 57% | Functional/Unit leaders: 30% | EMEA: 31% |
| Smaller Players: 15% | Managers: 57% | Americas: 27% |
Market-Sizing & Forecasting
Sizing is built using a top-down demand pool, where regulated testing activity and method-driven adoption are reconstructed by end-use labs and by the frequency of calibration and verification needs. To keep the totals realistic, we then check them with selective bottom-up approximations, such as sampled price per standard multiplied by estimated consumption volumes for common analyte panels, followed by distributor channel checks where coverage is meaningful.
Key model inputs include the pace of updates in analytical validation guidance (for example ICH Q2(R2) and Q14), the expansion of environmental and food testing panels, the share of tests requiring certified reference materials, the shift toward matrix-matched formats for complex samples, and observed pricing progression by concentration level and pack configuration. If the bottom-up view is incomplete for small suppliers or niche analytes, gaps are handled through ratio-based scaling using the best-supported application mixes from interviews.
For forecasting, we use scenario analysis supported by short time-series smoothing on the most stable demand indicators, and we filter those scenarios through expert consensus from the primary discussions. This keeps the forward view tied to practical drivers such as regulatory enforcement strength, lab capacity additions, and method adoption timing, rather than assuming a single straight-line growth path.
Data Validation & Update Cycle
Model outputs are validated through multiple checks that are easy to explain and repeat, including year-on-year variance reviews, cross-region share sanity checks, and comparisons against independent signals such as regulated method rollouts and lab testing intensity trends. When an outlier appears, we trace it back to a specific driver (for example an application mix change or pricing input) and recheck the relevant sources.
Before sign-off, another analyst reviews the work in steps to ensure calculation logic, units, and currency handling are consistent. Reports are refreshed annually, and interim updates are made when material events occur that can change demand, such as major method releases or sudden supply constraints. Right before delivery, a final pass is completed so clients receive the most current view available.
Mordor Intelligence's Analytical Standards Market Size Versus Other Published Estimates
Published market sizes for analytical standards can differ even when the topic appears identical, because each publisher chooses its own product scope, year definitions, and pricing logic. Differences also show up when one estimate is built around regulated lab demand signals, while another relies more on supplier revenues and broader chemical reference categories.
Some published figures appear to include adjacent reference materials and broader lab reference offerings, which pushes the number higher. In Mordor Intelligence's model, revenues are counted only for analytical standards used for calibration and method verification, and adjacent lab consumables and instrument spending are excluded so the demand pool stays consistent by application and region.
Benchmark comparison
| Source | Market Size | Gaps in Research Methodology |
|---|---|---|
| Mordor Intelligence | USD 1.52 B (2025) | |
| Industry Research Publisher A | USD 1.34 B (2023) | Uses a different base year and may apply a broader category structure, which can shift what is counted as an analytical standard versus related reference materials. The shorter historic window can also change the starting point for price and volume normalization. |
| Global Research Publisher B | USD 1.77 B (2025) | Defines the market using a revenue accounting view that emphasizes sales at the creator level and may capture a wider set of analytical standard sales across the supply chain definitions. It also uses a different growth profile, which can raise the stated 2025 level versus a demand-indicator-led build. |
Taken together, the spread is mostly explained by how narrowly the product category is set, which base year anchors the series, and how pricing is carried forward across applications. By keeping the counted items tied to clear lab-use cases and then validating assumptions with interview feedback, our estimate stays transparent and easier to replicate when clients run their own sensitivity checks.


Key Questions Answered in the Report
What is the projected size of the analytical standards market by 2031?
The analytical standards market size is forecast to reach USD 2.13 billion by 2031 based on a 5.82% CAGR.
Which technique segment is expanding the fastest?
Mass spectrometry leads growth with a projected 7.38% CAGR through 2031, propelled by oncology and precision-medicine applications.
Why are matrix-matched certified reference materials gaining traction?
Regulators now expect standards to mimic real-world sample backgrounds, making matrix-matched CRMs essential for accurate PFAS, pesticide and mycotoxin assays.
Which region shows the highest growth potential?
Asia-Pacific is set for a 6.36% CAGR as China and India align with PIC/S guidelines and scale pharmaceutical manufacturing.
How does the talent shortage impact laboratories?
Vacancies exceeding 46% in clinical labs restrict instrument utilization and push facilities toward outsourcing, influencing purchasing patterns for CRMs.
What recent deal significantly reshaped the competitive landscape?
Waters Corporation’s USD 17.5 billion merger with BD’s biosciences arm formed the largest analytical-instrumentation combination to date.
Page last updated on:


 Your data is secure and never sold or shared.


