Preparative And Process Chromatography Market Size and Share
Market Overview
| Study Period | 2020 - 2031 |
|---|---|
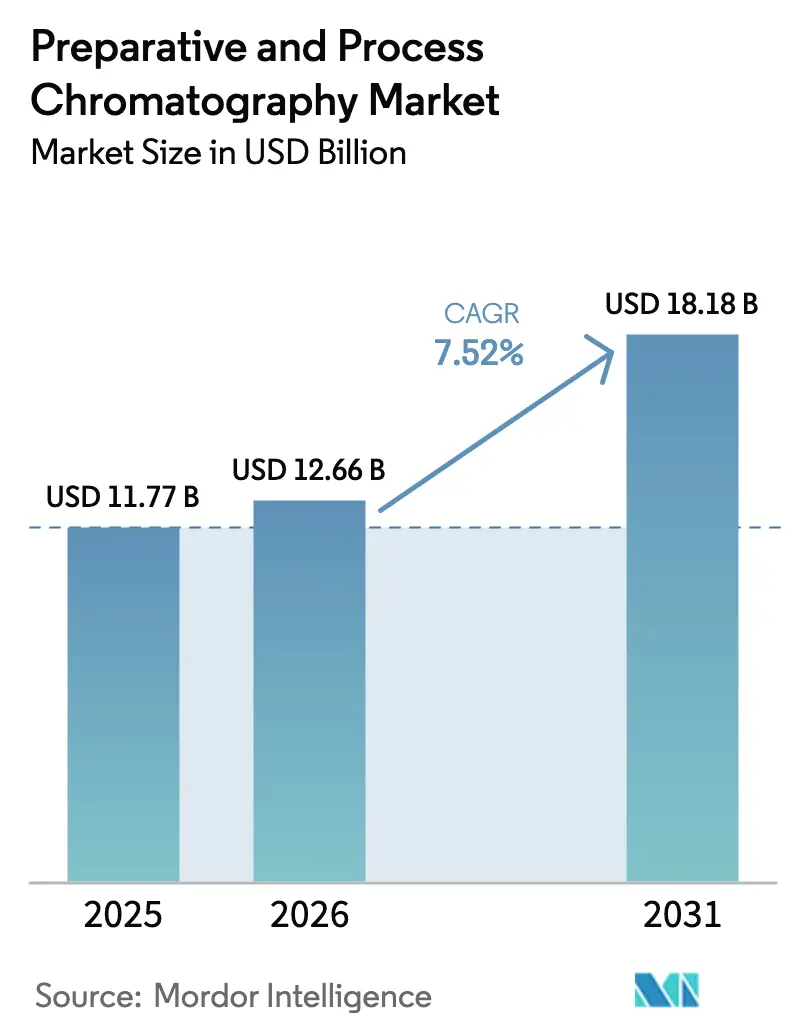
| Market Size (2026) | USD 12.66 Billion |
| Market Size (2031) | USD 18.18 Billion |
| Growth Rate (2026 - 2031) | 7.52% CAGR |
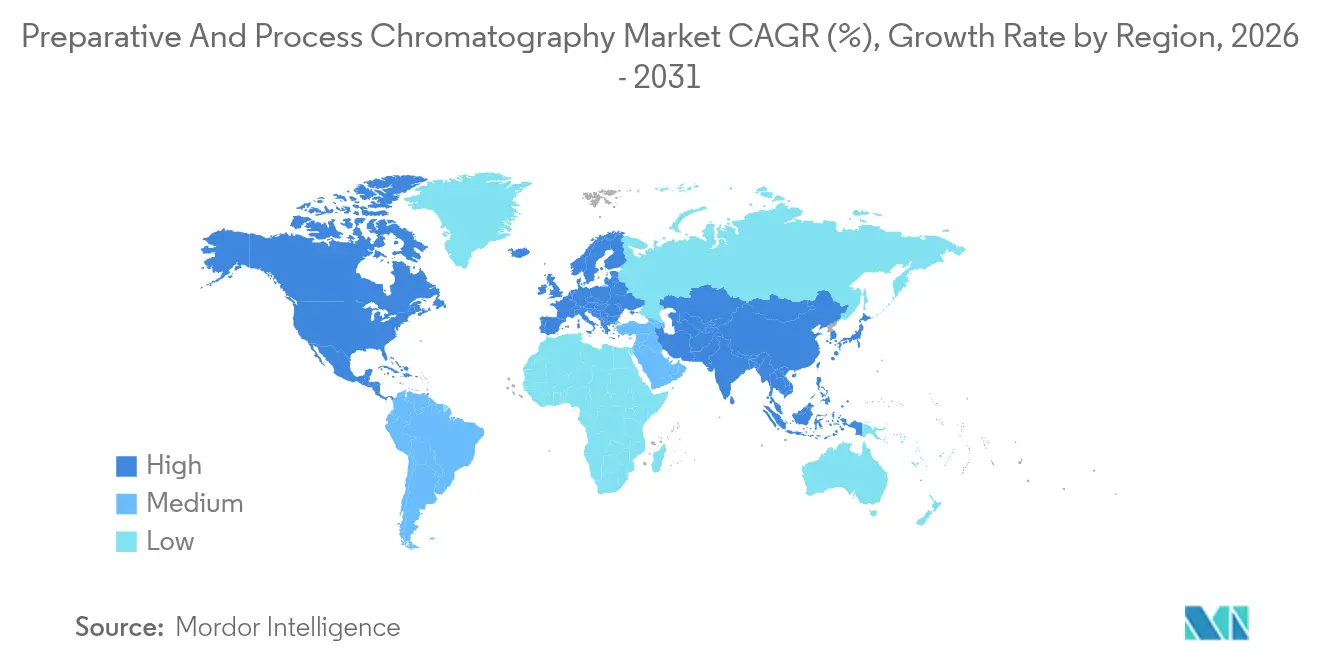
| Fastest Growing Market | Asia Pacific |
| Largest Market | North America |
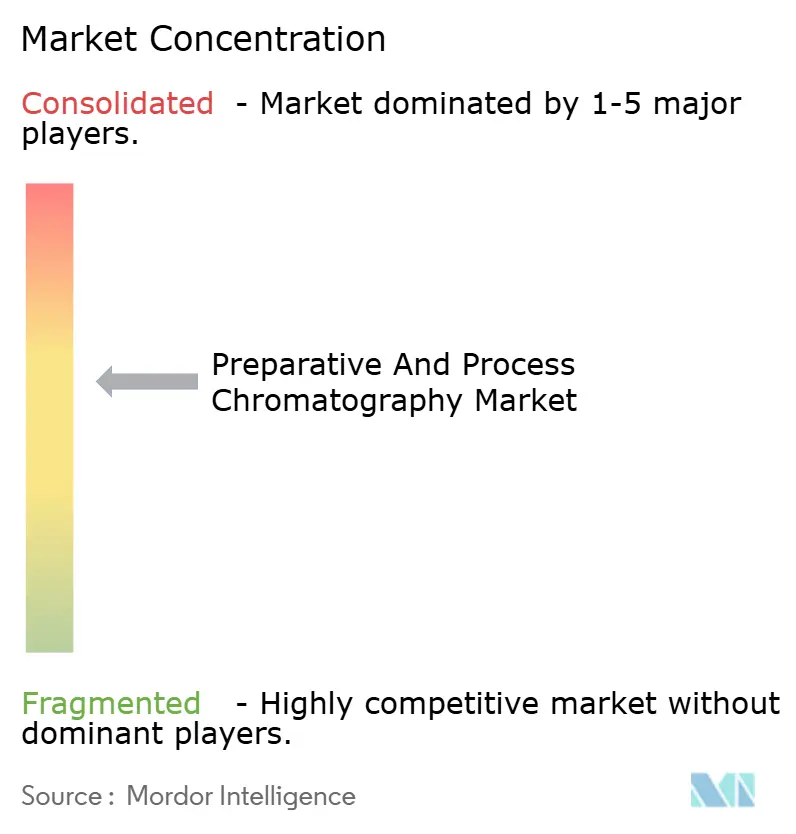
| Market Concentration | Medium |
Major Players *Disclaimer: Major Players sorted in no particular order Image © Mordor Intelligence. Reuse requires attribution under CC BY 4.0. | |
Preparative And Process Chromatography Market Analysis by Mordor Intelligence
The preparative and process chromatography market size is expected to grow from USD 11.77 billion in 2025 to USD 12.66 billion in 2026 and is forecast to reach USD 18.18 billion by 2031 at 7.52% CAGR over 2026-2031. Demand is rising because next-generation biologics facilities must resolve downstream purification bottlenecks or risk losing revenue. Continuous multi-column equipment that lifts productivity 10 times over batch operations is moving from pilot to full-scale use, while resin manufacturers speed capacity projects to match the expanding bioreactor footprint. Capital spending that exceeds USD 50 billion across new plants, plus a USD 1.5 billion resin investment led by Danaher, illustrates the scale of commitment. Liquid chromatography remains the workhorse technique, yet supercritical fluid platforms are gaining momentum as manufacturers seek solvent cuts and greener footprints. Regional patterns show North America holding volume leadership, but Asia Pacific posting the fastest gains as China and India build global-grade GMP sites.
Key Report Takeaways
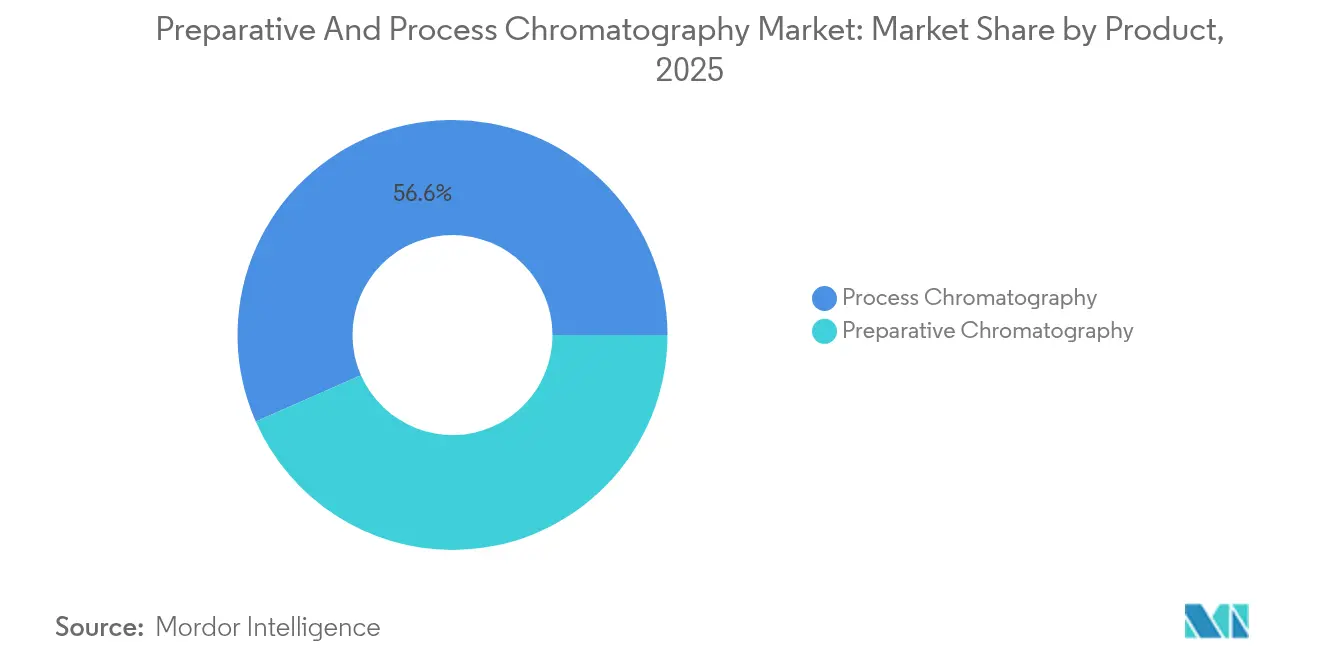
- By product type, process chromatography held 56.60% of the preparative and process chromatography market share in 2025; preparative chromatography is forecast to expand at a 7.68% CAGR through 2031.
- By technique, liquid chromatography led with 52.90% revenue share in 2025, while supercritical fluid chromatography is set to advance at an 10.86% CAGR to 2031.
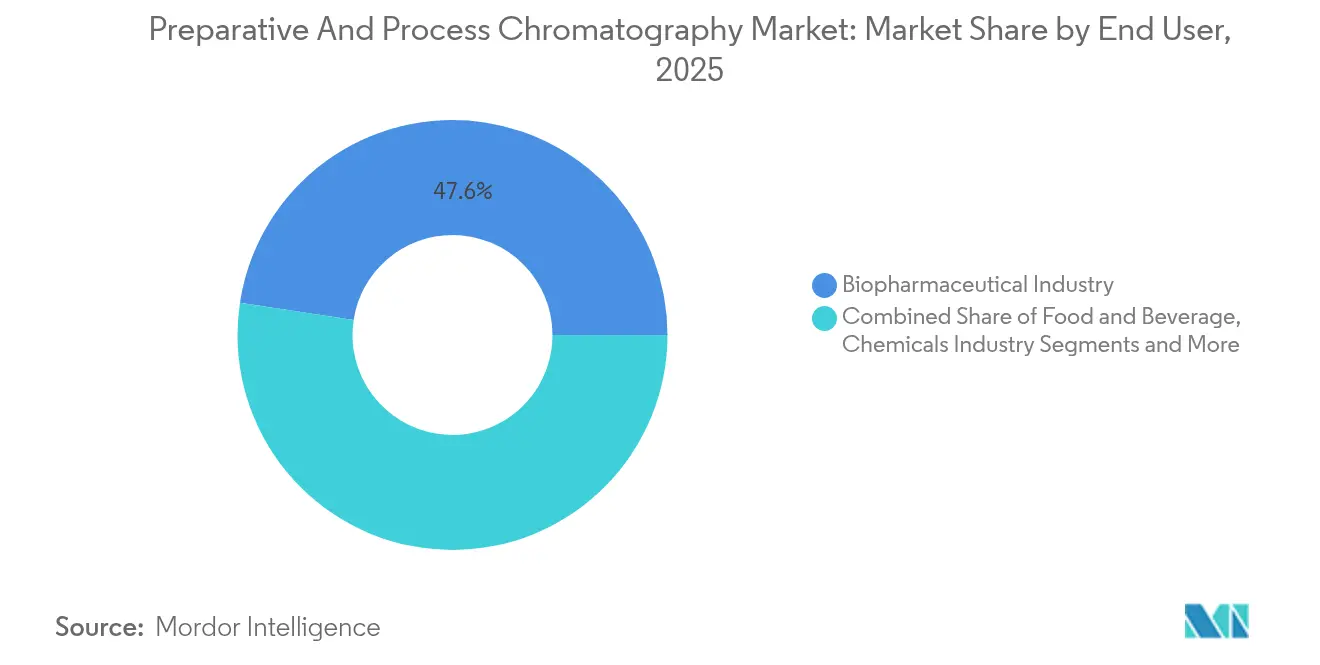
- By end user, the biopharmaceutical sector accounted for a 47.60% share of the preparative and process chromatography market size in 2025, whereas environmental testing laboratories are growing at a 8.88% CAGR through 2031.
- By geography, North America commanded 35.10% of the preparative and process chromatography market size in 2025, yet Asia Pacific is projected to record an 8.32% CAGR to 2031.
Note: Market size and forecast figures in this report are generated using Mordor Intelligence’s proprietary estimation framework, updated with the latest available data and insights as of 2026.
Global Preparative And Process Chromatography Market Trends and Insights
Drivers Impact Analysis*
| Driver | (~) % Impact on CAGR Forecast | Geographic Relevance | Impact Timeline |
|---|---|---|---|
| Investments in R&D for next-gen biologics | +1.80% | Global with focus in North America and EU | Medium term (2-4 years) |
| Biopharma facility build-out wave | +1.50% | Global with acceleration in Asia Pacific | Short term (≤ 2 years) |
| Expansion of biopharma manufacturing capacity | +1.20% | North America and Asia Pacific | Short term (≤ 2 years) |
| Shift to continuous multi-column SMB systems | +1.00% | Early adoption in EU and North America | Medium term (2-4 years) |
| Cannabis and nutraceutical purification demand | +0.80% | North America and EU | Medium term (2-4 years) |
| Single-use pre-packed columns adoption | +0.70% | Global, driven by GMP compliance | Short term (≤ 2 years) |
| Source: Mordor Intelligence | |||
Investments in R&D for Next-Gen Biologics
Higher budgets devoted to bispecific antibodies, cell therapies, and mRNA products lift orders for flexible chromatography systems able to swap between multiple capture chemistries. Merck KGaA’s EUR 300 million (USD 351 million) Advanced Research Center underscores the trend, highlighting analytical platforms tailored for novel modalities. Cost modeling shows that switching from affinity to alternative capture methods can trim production expenses by 23%, motivating producers to modernize in parallel with pipeline shifts. Regulatory dossiers for complex biologics require detailed impurity profiles, so plants install additional polishing steps to secure approvals. Strong R&D pipelines translate directly into greater demand for disposable columns that support rapid turnover.
Biopharma Facility Build-Out Wave
More than USD 15 billion went into new North American biopharma plants in 2024, with each installation creating immediate downstream equipment needs. Fujifilm’s 160,000 L expansion in North Carolina and Eli Lilly’s massive injectable campus both require matched chromatography lines to clear product backlogs. Investors favor single-use layouts that cut changeover time, pushing vendors to supply pre-packed columns on compressed schedules. The simultaneity of many builds squeezes suppliers, triggering long-term resin supply agreements. Because construction is clustered in established hubs, local service organizations must scale faster to handle installation and validation workloads.
Expansion of Biopharma Manufacturing Capacity
Existing facilities pursue debottleneck projects that prioritize purification hardware. Contract development and manufacturing organizations expect 54% of global capacity to fall under their control by 2028, so they standardize on proven chromatography platforms for reliability and audit readiness. Upstream increases of one liter typically require 1.5–2 L of added chromatography resin; resins therefore remain a recurring expenditure even when system hardware lasts longer. Capacity growth also stretches lead times on specialty consumables, prompting some buyers to hold buffer stock that ties up working capital yet ensures production continuity.
Shift to Continuous Multi-Column SMB Systems
Simulated moving bed platforms demonstrate 21% higher yield and 75% lower solvent use versus batch purification. Users report steady 24/7 operation with smaller footprints, leading to savings on facility space and utilities. Regulatory guidance in ICH Q13 encourages steady-state processing, easing past adoption barriers. Vendors respond with modular skids that integrate inline analytics and automatic column switching, helping operators maintain product quality while boosting throughput. As more license applications cite continuous chromatography data, the approach gains credibility across the sector.
Restraints Impact Analysis*
| Restraint | (~) % Impact on CAGR Forecast | Geographic Relevance | Impact Timeline |
|---|---|---|---|
| Capital Intensity Of Large-Scale Equipment | -1.20% | Global, acute in emerging markets | Short term (≤ 2 years) |
| Lack Of Trained Chromatography Engineers | -0.80% | Global, severe in APAC expansion regions | Medium term (2-4 years) |
| Protein-A & Novel Ligand Resin Supply Volatility | -0.60% | Global, concentrated supplier base | Short term (≤ 2 years) |
| Stricter Solvent-Emission Regulations Raising OPEX | -0.40% | North America & EU regulatory frameworks | Medium term (2-4 years) |
| Source: Mordor Intelligence | |||
Capital Intensity of Large-Scale Equipment
Full-scale preparative HPLC systems often cost above USD 500,000, and complete downstream trains run into multi-million-dollar territory. Smaller biotech firms struggle to justify such outlays, especially when early-stage pipelines carry high attrition risk. Compliance demands double spending because redundant trains and exhaustive validation steps are mandatory. Leasing models and equipment-as-a-service offerings help, though consumables and maintenance still burden operating budgets. Financing challenges slow adoption in emerging markets where interest rates rise, delaying project greenlights and limiting immediate sales for suppliers.
Lack of Trained Chromatography Engineers
Advanced systems need skilled operators versed in gradient optimization, column packing science, and automated control logic.[1]American Chemical Society Reporters, “Survey Reveals Skills Gap in Chromatography Training,” Cen.acs.org University programs cover the basics but rarely address industrial-scale purification, leading to new graduates who require months of in-house training before achieving proficiency. Surveys flag mass spectrometry and liquid chromatography as top skill gaps. Apprenticeship schemes help, but remain limited relative to demand. The shortage is most acute in Asia Pacific, where facility build speed outruns talent pipelines, forcing firms to import expertise at premium wages.
*Our forecasts treat driver/restraint impacts as directional, not additive. The impact forecasts reflect baseline growth, mix effects, and variable interactions.
Segment Analysis
By Product: Process Systems Drive Market Leadership
The process systems segment generated the largest revenue in 2025 on the strength of its 56.60% preparative and process chromatography market share. These high-value systems integrate pumps, detectors, automation, and validation packages that satisfy GMP audits. Growth follows expanding monoclonal antibody and recombinant protein production, with resin makers like Purolite adding new agarose plants to guarantee supply. Columns, buffers, and cleaning agents provide predictable recurring sales tied to batch cycles, though generic offerings exert price pressure. Preparative equipment grows the fastest at 7.68% CAGR because discovery groups and contract research organizations demand quick-turn platforms for compound isolation. Vendors differentiate through smaller footprint skids, intuitive method libraries, and connectivity to electronic lab notebooks. Across product lines, digitization features such as predictive maintenance alerts increasingly factor into purchase decisions.
Process resins remain the volume backbone in both constant and intensified processes. Users maintain multiple resin sets to avoid cross-contamination, extending total inventory requirements. Single-use and pre-packed formats reduce cleaning costs and simplify changeovers, but resin shelf life and storage constraints influence plant layout. Portable skids enable movement between rooms to match modular upstream suites. Collectively, these developments keep process systems on top of the preparative and process chromatography market, while keeping pressure on suppliers to shorten lead times and prove supply chain resilience.


By Technique: Liquid Chromatography Maintains Dominance Despite SFC Disruption
Liquid chromatography retained 52.90% revenue leadership in 2025 because of its versatility from early-phase method scouting through commercial purification. Protein A affinity and ion-exchange remain essential for monoclonal antibody capture and polishing, even when plants move to continuous modes. Size-exclusion analytics provide critical aggregate checks, supporting regulatory filings. Gas chromatography fills niche needs in volatile analytics, yet supercritical fluid chromatography is the rising star. Its projected 10.86% CAGR signals broader adoption as firms chase solvent reduction and shorter runtimes, particularly for chiral separations in small-molecule pipelines. Instrument makers address historical barriers through method translation software and wider application notes, reducing qualification overhead.
Hybrid platforms that merge liquid and membrane technologies promise further disruption. Users test membrane adsorbers for flow-through polishing to overlay conventional steps, targeting higher throughput at lower pressure drops. Technique choices therefore remain fluid, guided by compound properties, lifecycle stage, and corporate sustainability pledges. The diversity keeps liquid chromatography in front yet leaves room for alternatives to carve out specialized roles, balancing the preparative and process chromatography market landscape.
By End User: Environmental Testing Labs Challenge Biopharma Dominance
Biopharmaceutical manufacturers consumed the most systems in 2025 with 47.60% share of the preparative and process chromatography market size, thanks to strict purity targets and large-volume production. They prefer platform approaches that standardize hardware across multiple facilities, achieving economies of scale in training and spares. Contract development and manufacturing organizations amplify demand by purchasing parallel lines to service multiple clients simultaneously. Environmental labs, however, represent the fastest climber at 8.88% CAGR through 2031. New regulations on PFAS and emerging contaminants require instruments capable of ng/L sensitivity. Dedicated LC-MS/MS workflows paired with sample-prep automation drive steady upgrades in government and private labs.
Food and beverage players invest in rugged equipment to verify contaminants like pesticides and mycotoxins under tightening import rules. Chemical producers use chromatography for in-process monitoring to trim waste and increase yield, while agricultural labs focus on soil and water surveillance. Academic institutions continue to refresh equipment, though budget cycles moderate spending peaks. Overall, varied end-user needs sustain broad product portfolios, ensuring no single sector dominates future growth entirely.
Geography Analysis
North America commanded 35.10% of the preparative and process chromatography market size in 2025, fueled by the world’s most mature biopharmaceutical ecosystem and clear regulatory pathways that reward innovation. Ongoing multibillion-dollar plant projects by Amgen, Fujifilm, and Novo Nordisk maintain a steady equipment pipeline. The region also benefits from deep service infrastructure and supplier proximity, which cuts installation timelines. Nonetheless, rising labor costs and limited skilled workforce availability pose headwinds. Several states offer tax incentives to keep manufacturing local, yet competition from offshore sites is intensifying.
Europe remains a stable, innovation-focused region with a strong heritage in pharma manufacturing. Sustainability priorities guide purchasing decisions, pushing companies toward supercritical fluid systems that reduce solvent footprints. Harmonized EMA regulations simplify cross-border deployments, and initiatives such as the EU Green Deal influence equipment design and energy efficiency. Brexit does introduce customs delays for UK-centric operations, prompting firms to reroute spare parts stocks. European vendors leverage niche expertise, for example, in multi-column continuous systems, to hold technical leadership.
Asia Pacific is the fastest moving region with an 8.32% CAGR forecast, driven by aggressive government incentives and private investment aimed at capturing biologics market share. China’s managers plan global GMP compliance, prompting heavy spending on Western-standard analytical suites. India parlayes its generics know-how into biologics capabilities, while South Korea and Singapore specialize in advanced modalities like cell therapies and peptides. Regional firms often pursue localization, encouraging foreign suppliers to establish local manufacturing or joint ventures. Workforce training lags behind infrastructure growth, making competency development a top priority for both governments and industry. Overall, heightened regional competition pressures all participants to sharpen pricing and support strategies.

Competitive Landscape
The preparative and process chromatography market is moderately concentrated. Integrated giants such as Danaher, Thermo Fisher Scientific, and Merck KGaA leverage broad portfolios that span cell culture through final fill, creating stickiness via single-vendor convenience. Thermo Fisher’s USD 4.1 billion purchase of Solventum’s purification business underscores the strategic value of downstream operations and signals continued consolidation. These leaders couple hardware with consumables and digital services, locking in recurring revenue streams.
Disruptive challengers target pain points around speed, solvent use, and automation. Membrane column innovators, exemplified by GORE, promise 6–10 times faster cycles for capsid capture while keeping quality intact. AI-driven method development software shortens process transfer timelines, appealing to CDMOs under tight schedules. Patent activity clusters around continuous chromatography and single-use formats, and smaller firms partner with established vendors to penetrate regulated markets without building global sales forces from scratch.
Supply-chain resilience emerges as a competitive differentiator. Protein A resin lead times stretch beyond 15 weeks, so producers that own manufacturing assets gain an advantage. Service offerings now include predictive maintenance and remote calibration, which reduce downtime. From a customer view, total cost of ownership increasingly trumps upfront price, rewarding suppliers that demonstrate long-term support. The combined share of the top five players currently sits just above 70%, supporting a market concentration score of 7.
Preparative And Process Chromatography Industry Leaders
Thermo Fisher Scientific Inc.
Merck KGaA
Bio-Rad Laboratories Inc.
Agilent Technologies
Danaher Corporation
- *Disclaimer: Major Players sorted in no particular order

Recent Industry Developments
- February 2025: Thermo Fisher Scientific completed its USD 4.1 billion acquisition of Solventum's Purification and Filtration business, expanding chromatography and purification capabilities.
- January 2025: Fujifilm Diosynth Biotechnologies confirmed plans to triple bioreactor volume at Holly Springs during 2025 to support growing downstream capacity needs.
- December 2024: Testa Analytical released FlowChrom, a non-invasive tracker that ties solvent-delivery metrics with chromatographic results for compliance.
- October 2024: Agilent Technologies launched the Agilent Infinity III LC Series, which features automation and sustainability upgrades.
- October 2024: Agilent Technologies launched the Agilent Infinity III LC Series, which features automation and sustainability upgrades.


Research Methodology Framework and Report Scope
Market Definitions and Key Coverage
Our study defines the preparative and process chromatography market as all large-scale chromatographic systems, resins, columns, buffers, and associated software that purify or separate gram-to-kilogram quantities of biological or chemical compounds used in drug, vaccine, food, nutraceutical, and specialty-chemical production. The valuation is expressed in USD at manufacturer selling price and covers permanent equipment as well as regularly replaced consumables.
Scope exclusion: analytical-only bench-top instruments and micro-scale research columns are kept outside the model.
Segmentation Overview
- By Product
- Process Chromatography
- Systems
- Resins
- Columns
- Chemicals & Reagents
- Preparative Chromatography
- Systems
- Resins
- Columns
- Chemicals & Reagents
- Process Chromatography
- By Technique
- Liquid Chromatography
- Gas Chromatography
- Ion-Exchange Chromatography
- Affinity Chromatography
- Size-Exclusion Chromatography
- Supercritical Fluid Chromatography
- By End User
- Biopharmaceutical Industry
- Food & Beverage Industry
- Chemicals Industry
- Agriculture Industry
- Environmental Testing Labs
- Academic & Research Institutes
- By Geography
- North America
- United States
- Canada
- Mexico
- Europe
- Germany
- United Kingdom
- France
- Italy
- Spain
- Rest of Europe
- Asia Pacific
- China
- Japan
- India
- South Korea
- Australia
- Rest of Asia Pacific
- Middle East & Africa
- GCC
- South Africa
- Rest of Middle East & Africa
- South America
- Brazil
- Argentina
- Rest of South America
- North America
Detailed Research Methodology and Data Validation
Primary Research
Our analysts interviewed chromatography product managers, bioprocess engineers across North America, Europe, and Asia Pacific, and procurement heads at contract manufacturing organizations. The conversations validated typical system throughputs, resin usage patterns, pricing corridors, and the pace at which multi-column continuous skids are displacing batch systems.
Desk Research
We first built a fact base from open datasets such as US FDA Biologics License Application approvals, European Medicines Agency pipeline trackers, UN Comtrade resin trade codes, and statistics from associations like BioPhorum, American Chemical Society, and EFPIA. Company 10-Ks, investor decks, and peer-reviewed journals on continuous downstream processing helped us benchmark price and productivity ratios. Subscription assets, including D&B Hoovers for company revenues and Dow Jones Factiva for deal activity, supplied additional context. The examples above are indicative; many other public and paid references informed our checks.
A second pass mapped facility capacity additions, resin lifespans, and column replacement frequencies, which anchor our consumables flow model and let us sense-check headline equipment shipments.
Market-Sizing & Forecasting
We applied a top-down demand pool build that starts with annual biologic drug output volumes, insulin production runs, and large-scale food additive batches, which are then linked to average purification yields and resin consumption norms. Select bottom-up cross-checks, such as global shipments of prep HPLC skids and sampled average selling prices, tune totals and expose gaps. Key variables in the regression-based forecast include new biopharma plant capital expenditure, monoclonal antibody approvals, multi-column skid adoption rates, resin replacement cycles, and currency shifts. Where supplier roll-ups lacked clarity, we interpolated using regional capacity utilization and validated adjustments with field experts.
Data Validation & Update Cycle
Before sign-off, results run through variance screens versus import-export tallies, patent activity, and quarterly earnings signals. A senior reviewer challenges anomalies, and we refresh the model every twelve months, triggering interim updates for material events.
Why Our Preparative And Process Chromatography Baseline Commands Reliability
Published figures often diverge because firms apply different scopes, price bases, and refresh cadences.
Key gap drivers include whether consumables are annualized or capitalized, the split between batch and continuous systems, and how aggressively learning-curve price declines are baked in. Mordor Intelligence reports the balanced base case for 2025, whereas others anchor to earlier or narrower datasets or convert currencies at spot rather than yearly averages.
Benchmark comparison
| Market Size | Anonymized source | Primary gap driver |
|---|---|---|
| USD 11.77 B (2025) | Mordor Intelligence | - |
| USD 9.5 B (2022) | Regional Consultancy A | Excludes consumables, uses 2022 exchange rates |
| USD 11.3 B (2023) | Global Consultancy B | Omits continuous multi-column penetration, older base year |
| USD 12.5 B (2024) | Industry Data Service C | Capital equipment only, projects via linear trend |
Taken together, the comparison shows that our disciplined scope choices, mixed-method model, and annual refresh cycle give decision-makers a dependable starting point that is transparent, recent, and traceable to real market fingerprints.


Key Questions Answered in the Report
What is the current value of the preparative and process chromatography market?
The preparative and process chromatography market stands at USD 12.66 billion in 2026 and is forecast to reach USD 18.18 billion by 2031.
Which product segment generates the highest revenue?
Process chromatography systems generate the most revenue with 56.60% market share, driven by large-scale biologics production requirements.
Why is supercritical fluid chromatography growing quickly?
Pharmaceutical producers adopt supercritical fluid technology to cut solvent use and shorten runtimes, supporting an 10.86% CAGR through 2031.
Which region is expanding fastest?
Asia Pacific posts the fastest growth at 8.32% CAGR as countries such as China and India build global-standard GMP facilities.
What are the main restraints on market growth?
High capital costs for large-scale equipment and a shortage of trained chromatography engineers limit expansion, trimming CAGR potential by 2% combined.
How concentrated is the supplier landscape?
The top five companies hold just over 70% of revenue, leading to a moderate concentration score of 7 while leaving room for niche innovators.
Page last updated on:


