Downstream Processing Market Size and Share
Market Overview
| Study Period | 2020 - 2031 |
|---|---|
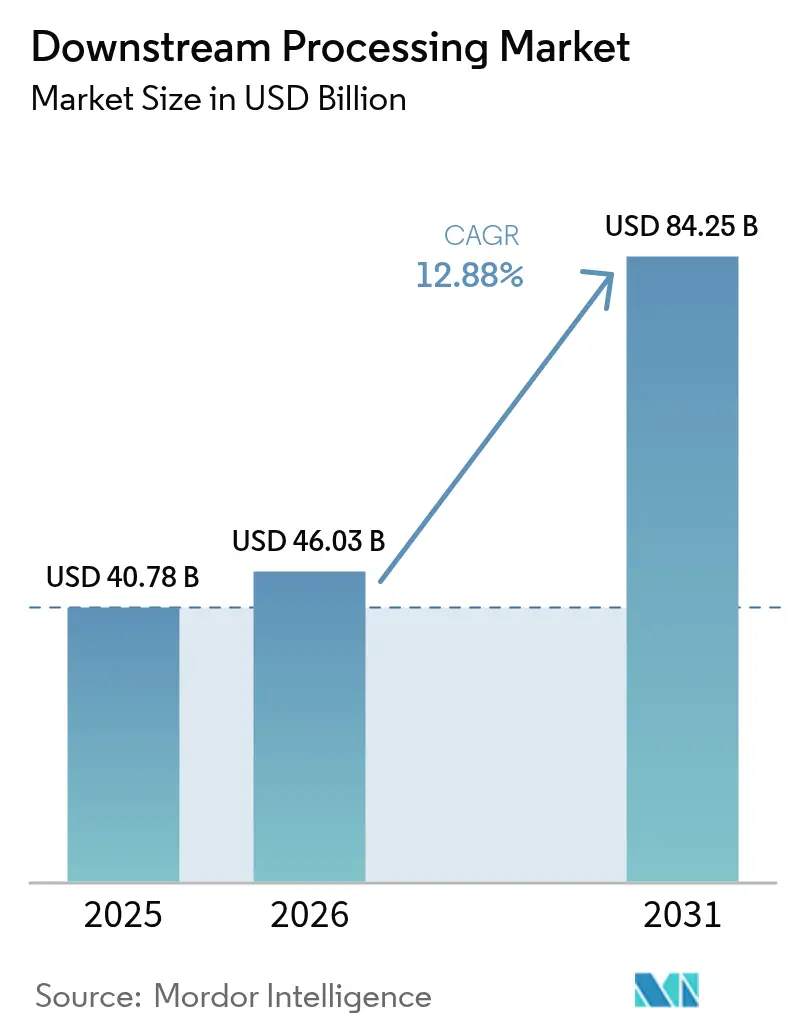
| Market Size (2026) | USD 46.03 Billion |
| Market Size (2031) | USD 84.25 Billion |
| Growth Rate (2026 - 2031) | 12.88% CAGR |
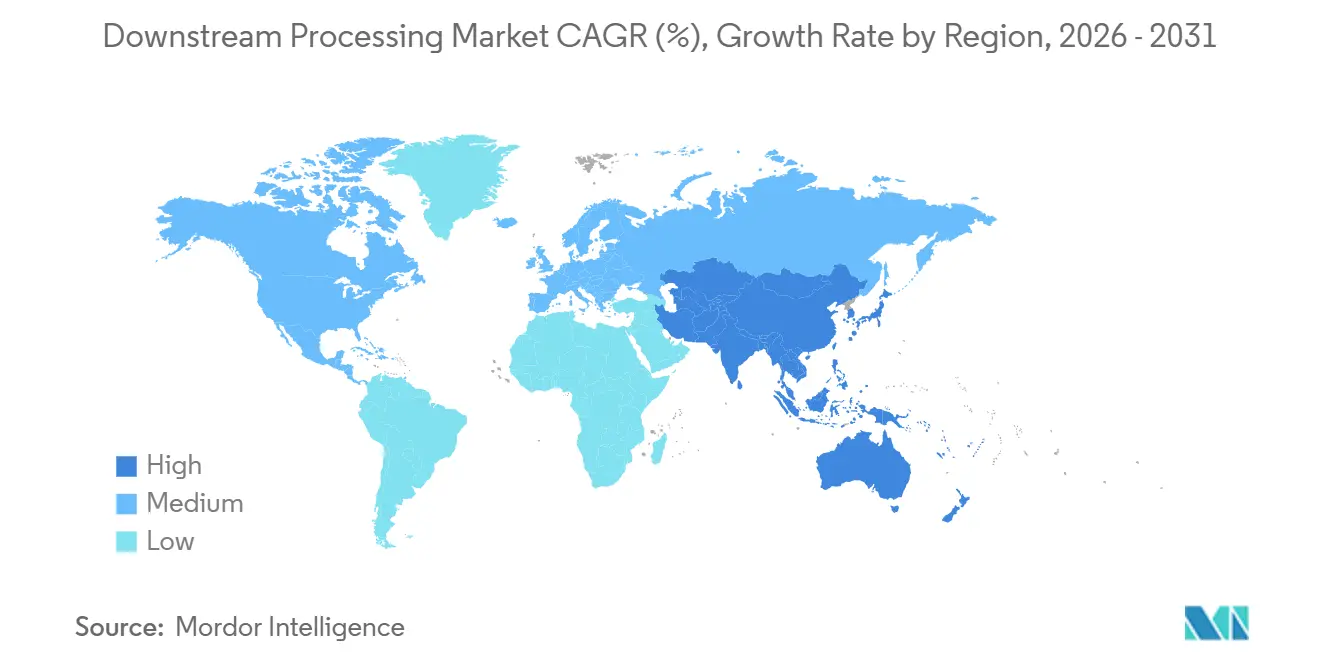
| Fastest Growing Market | Asia Pacific |
| Largest Market | North America |
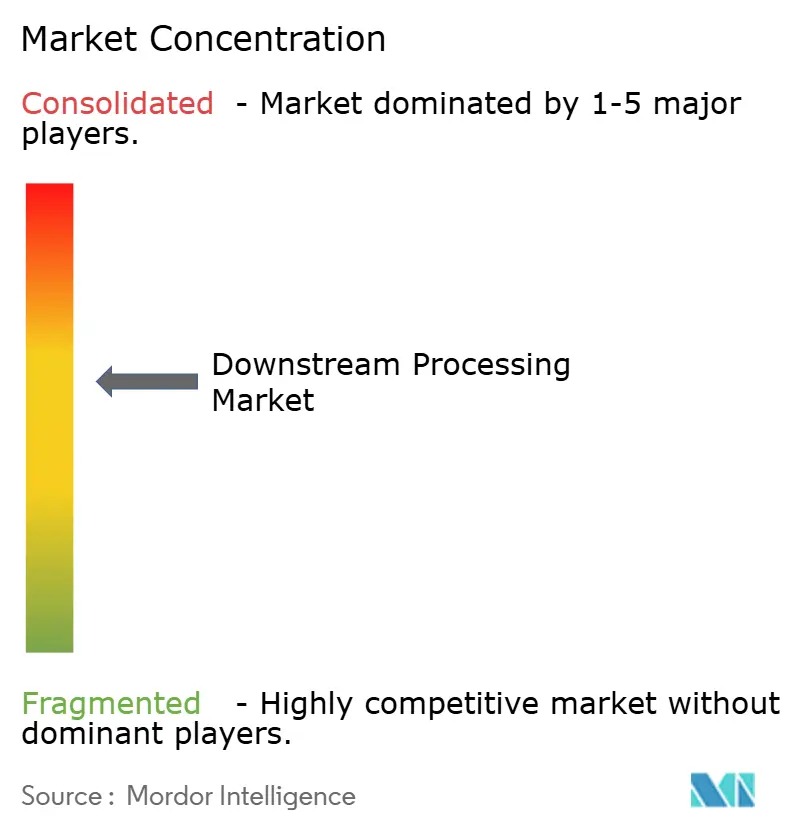
| Market Concentration | Medium |
Major Players *Disclaimer: Major Players sorted in no particular order Image © Mordor Intelligence. Reuse requires attribution under CC BY 4.0. | |
Downstream Processing Market Analysis by Mordor Intelligence
The Downstream Processing Market size is expected to increase from USD 40.78 billion in 2025 to USD 46.03 billion in 2026 and reach USD 84.25 billion by 2031, growing at a CAGR of 12.88% over 2026-2031.
Higher upstream titers for monoclonal antibodies are surpassing the capacity of purification trains, which remain constrained by batch chromatography and outdated single-use filtration formats. This imbalance increases yield losses and extends turnaround times during large-scale production runs. Consequently, companies are increasingly outsourcing to CDMOs. By transferring purification-intensive steps to providers with multi-product FDA and EMA approvals, businesses reduce capital expenditures and shorten scale-up timelines for new modalities. Additionally, cell and gene therapy programs are adding volume pressures. Since viral-vector yields are significantly lower than antibody titers, facilities must process larger culture volumes through the same capture, polishing, and viral-filtration steps. Simultaneously, stricter PFAS regulations are driving the adoption of membrane substitutions and resin reformulations. This trend is raising consumable costs and necessitating validation updates across biologics manufacturing facilities.
Key Report Takeaways
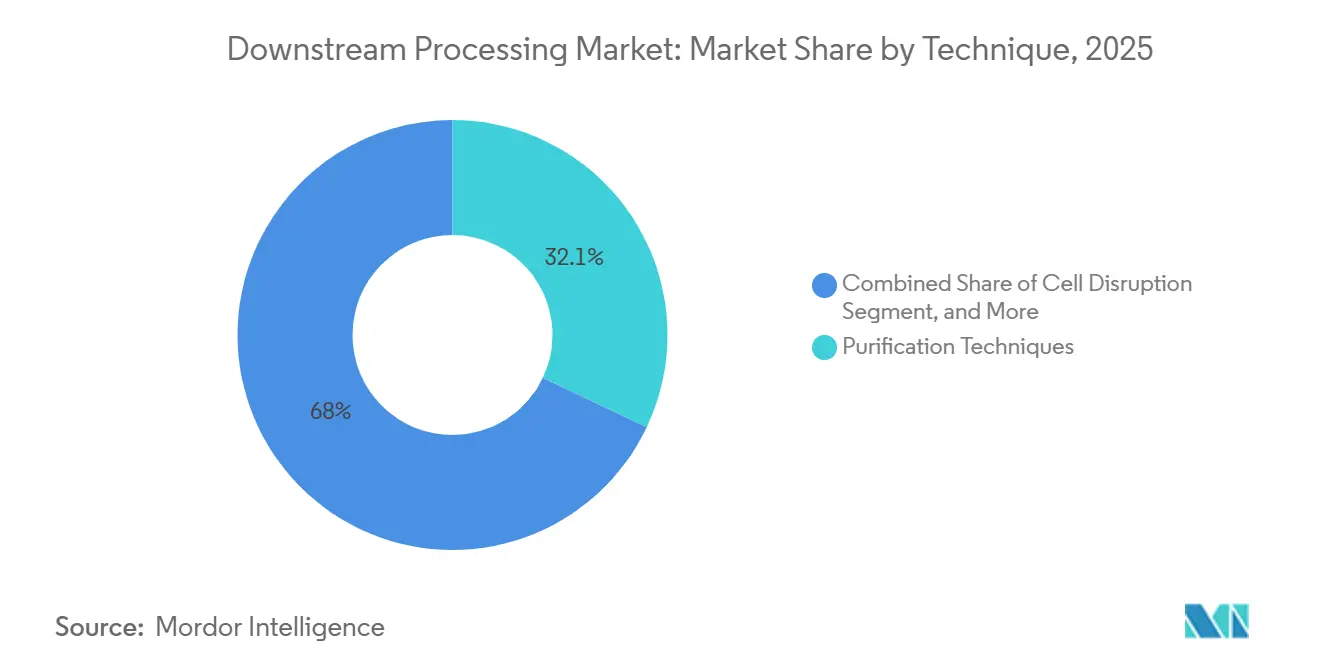
- By technique, purification accounted for 32.05% of the downstream processing market revenue share in 2025, whereas cell disruption is forecast to grow at a 14.88% CAGR to 2031.
- By product, chromatography columns and resins led the downstream processing market with 35.10% share in 2025, while filtration and membrane devices are set to grow at a 14.12% CAGR through 2031.
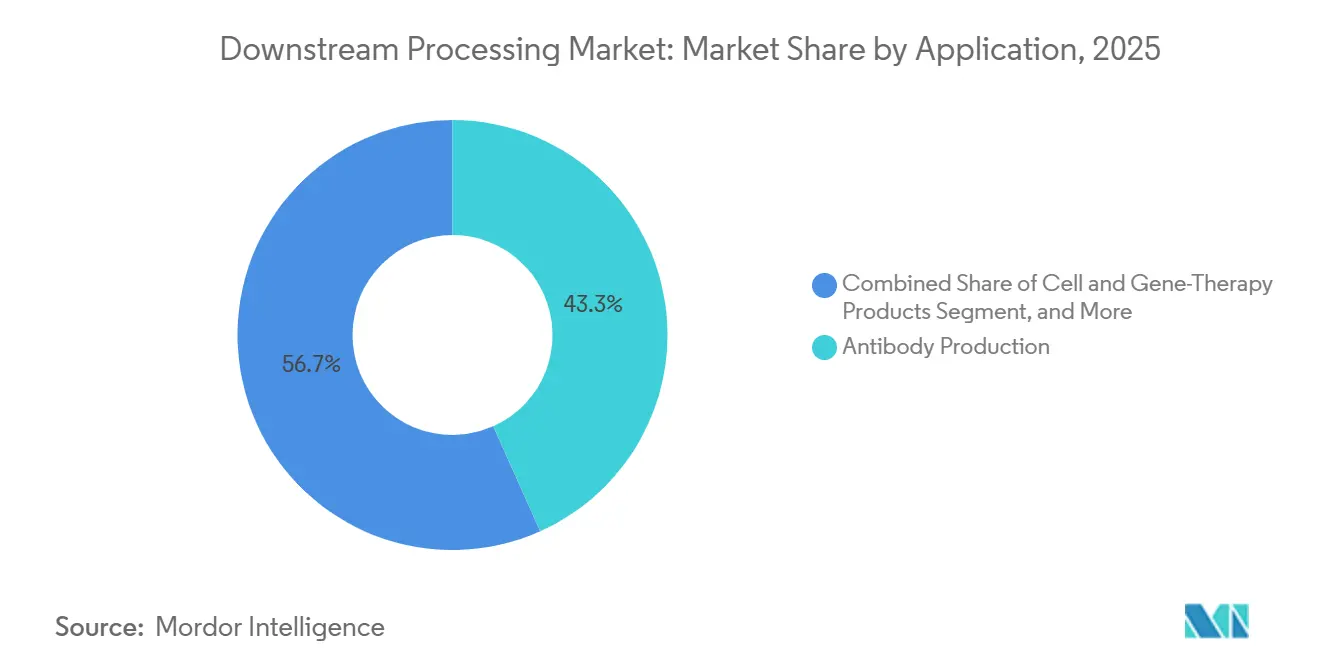
- By application, antibody production accounted for 43.30% of the downstream processing market in 2025, and cell and gene therapy products are poised to expand at a 14.90% CAGR between 2026 and 2031.
- By end user, biopharmaceutical manufacturers captured 48.10% of the downstream processing market in 2025; contract development and manufacturing organizations are predicted to post the highest CAGR of 15.10% through 2031.
- By geography, North America commanded 32.50% of the downstream processing market share in 2025, whereas Asia-Pacific is projected to register a 14.35% CAGR through 2031.
Note: Market size and forecast figures in this report are generated using Mordor Intelligence’s proprietary estimation framework, updated with the latest available data and insights as of 2026.
Global Downstream Processing Market Trends and Insights
Drivers Impact Analysis*
| DRIVER | (~) % IMPACT ON CAGR FORECAST | GEOGRAPHIC RELEVANCE | IMPACT TIMELINE |
|---|---|---|---|
| Rapid expansion of global biologics manufacturing capacity | +2.8% | Global, with concentration in North America, Europe, and Asia-Pacific | Medium term (2-4 years) |
| Rising R&D spending among big pharma & emerging biotech | +2.3% | North America & Europe, spillover to Asia-Pacific | Long term (≥ 4 years) |
| CMO/CDMO outsourcing boom with multi-year capacity deals | +2.5% | Global, particularly North America and Asia-Pacific | Medium term (2-4 years) |
| mRNA & viral-vector vaccine platform scale-up post-COVID | +1.9% | North America & Europe, emerging in Asia-Pacific | Short term (≤ 2 years) |
| Continuous bioprocessing adoption lowering CAPEX/OPEX | +1.7% | North America & Europe, early adoption in Asia-Pacific | Long term (≥ 4 years) |
| Tightening PFAS regulations accelerates membrane substitution | +1.2% | North America & Europe, regulatory influence spreading globally | Medium term (2-4 years) |
| Source: Mordor Intelligence | |||


Rapid Expansion of Global Biologics Manufacturing Capacity
Samsung Biologics completed its fifth plant in April 2025, lifting global capacity to 784,000 L and reinforcing a volume race that lifts demand for large-scale chromatography systems and single-use bioreactors.[1]Eli Lilly, “Lilly Announces New USD 4.5 Billion Site to Drive Innovation in Drug Production,” investor.lilly.com Newly built lines favor continuous modalities that lower buffer consumption by as much as 40% and reduce water-for-injection requirements. Regional governments position biomanufacturing as a strategic growth engine, illustrated by Saudi Arabia’s plan to add USD 34.6 billion to non-oil GDP by 2040.[2]Vision 2030, “National Biotechnology Strategy,” vision2030.gov.sa In November 2024, Lonza completed a USD 1.2 billion acquisition of Roche's 330,000-liter Vacaville site, enhancing its capacity with protein-A chromatography and viral-filtration capabilities while avoiding the extended lead time required for new facility construction. In March 2025, Lotte Biologics committed USD 1 billion to establish a 250,000-liter facility in Songdo, focusing on biosimilar purification at cost levels suitable for emerging markets. In January 2025, Novartis announced a USD 23 billion manufacturing program in the United States, with a significant portion allocated to downstream automation and integrated skids aimed at reducing labor requirements per batch.
Rising R&D Spending Among Big Pharma & Emerging Biotech
In 2025, pharmaceutical R&D investments reached USD 294 billion, with biologics accounting for 62%.[3]U.S. Food and Drug Administration, “CDER and CBER Biologics Approvals,” U.S. Food and Drug Administration, fda.gov This shift toward large molecules and the restructuring of small-molecule portfolios due to patent cliffs is significant. The FDA approved 14 new biologics in 2025, with each launch requiring substantial drug-substance volumes.[4]Nature Editorial Team, “Continuous Bioprocessing,” Nature Biotechnology, nature.com These volumes translate into frequent purification campaigns, driving consistent demand for chromatography resins and viral filters. Higher approval rates validate new capacities and strengthen budget allocations for downstream automation, which reduces per-gram costs and enhances accessibility for mid-tier indications. As development portfolios increasingly focus on antibodies, ADCs, and bispecifics, the complexity of downstream purification has grown. This has led to a rising demand for orthogonal chromatography media and validated single-use assemblies. These trends support sustained order flows for integrated equipment-consumable ecosystems within the downstream processing market.
CMO/CDMO Outsourcing Boom with Multi-Year Capacity Deals
Survey data show CDMOs could operate 54% of global biologics capacity by 2028, altering purchasing cycles for buffers, probes, and membrane adsorbers. Multi-year reserved-capacity contracts de-risk capital for smaller sponsors and accelerate technology transfer. In 2024, Celltrion launched a CDMO division and successfully obtained contracts for the purification of biosimilars adalimumab and trastuzumab, leveraging South Korea's cost-efficient labor market. Fujifilm Diosynth invested USD 850 million in a gene-therapy facility in North Carolina, equipping it with continuous-chromatography trains and acoustic-wave separation technology to optimize AAV purification cycles. Innovators are converting fixed manufacturing costs into variable fees by utilizing CDMO expertise in validation, electronic records compliance, and change control, thereby reducing regulatory risks during product launches. CDMOs are distributing the costs of high-value skids and resins across multiple clients, improving utilization rates, enhancing cost predictability for sponsors, and ensuring reliable capacity in the downstream processing market.
Continuous Bioprocessing Adoption Lowering CAPEX/OPEX
Continuous downstream trains have transformed the biopharmaceutical manufacturing process by consolidating steps such as clarifying, capturing, viral inactivation, polishing, and ultrafiltration into a single integrated system. This approach enables 24/7 operations, significantly reduces facility footprints, and accelerates time-to-market. In February 2024, the FDA issued draft guidance supporting continuous manufacturing for biologics, provided that sponsors demonstrate real-time PAT monitoring and implement robust control strategies to ensure quality. In 2025, Eli Lilly introduced a continuous three-column protein-A system at its Indianapolis facility, achieving improved resin utilization and reduced buffer consumption, which delivered measurable annual cost savings. Sartorius launched a continuous platform that integrates perfusion bioreactors with inline chromatography, targeting lower production costs at the 500-kilogram scale. While adoption remains concentrated among large pharmaceutical companies and leading CDMOs due to the upfront investment and expertise required in multivariate process control, this shift establishes a cost benchmark that could expand the range of biologic indications over time.
Restraint Impact Analysis*
| RESTRAINT | (~) % IMPACT ON CAGR FORECAST | GEOGRAPHIC RELEVANCE | IMPACT TIMELINE |
|---|---|---|---|
| High capital cost of chromatography skids & resins | -1.8% | Global, particularly impacting small and mid-sized biotechs | Short term (≤ 2 years) |
| Purification bottleneck versus upstream titers | -1.4% | Global, most acute in North America and Europe | Medium term (2-4 years) |
| Supply-chain fragility for single-use filters & bags | -0.9% | Global, with acute impact during supply disruptions | Short term (≤ 2 years) |
| Skilled-workforce shortage for automated DSP analytics | -0.7% | North America & Europe, emerging in Asia-Pacific | Long term (≥ 4 years) |
| Source: Mordor Intelligence | |||
High Capital Cost of Chromatography Skids & Resins
In the biotechnology sector, financial investments are substantial. A fully automated continuous-chromatography skid, integrated with inline viral inactivation and buffer-management modules, is priced at USD 4–6 million. This significant cost creates financial challenges for academic spin-outs and early-stage biotech companies. Protein-A resins, critical in bioprocessing, are priced between USD 12,000 and 18,000 per liter. A large monoclonal antibody (mAb) campaign often requires hundreds of liters for both capture and polishing stages, leading to multi-million-dollar consumable expenses, excluding additional costs such as filters and buffers. In price-sensitive markets, downstream capital and consumables frequently account for the majority of bioprocessing cost-of-goods, limiting access for emerging biosimilar developers. To mitigate these costs, vendors are extending resin lifetimes. Newer protein-A media, for instance, offer cycle counts that significantly exceed those of first-generation products, although replacement costs remain a considerable expense over the product lifecycle.
Purification Bottleneck Versus Upstream Titers
By 2026, upstream titers for monoclonal antibodies are expected to exceed 10 grams per liter. However, many downstream processes remain designed for lower-output regimes. This misalignment creates increased volume pressure, longer production cycles, and capacity constraints. These challenges contribute to protein-A column fouling and necessitate mid-cycle regeneration, leading to higher idle times, greater cleaning solution consumption, and slower manufacturing throughput. High-titer eluates can also clog viral filters, doubling membrane area requirements and driving up per-campaign costs, particularly at commercial scales. The production of bispecifics and antibody-drug conjugates introduces additional steps, such as ion-exchange and hydrophobic-interaction chromatography, which extend purification times and occupy suites that could otherwise support additional campaigns. Continuous processing offers a potential solution by maintaining steady-state loading and eliminating batch equilibration. However, the need for full re-validation under regulatory guidance adds time and effort, delaying immediate capacity improvements.
*Our forecasts treat driver/restraint impacts as directional, not additive. The impact forecasts reflect baseline growth, mix effects, and variable interactions.
Segment Analysis
By Technique: Purification Dominates, Disruption Accelerates
Purification techniques accounted for 32.05% of the downstream processing market revenue in 2025, confirming their centrality to biologics quality. Cell disruption registers the fastest 14.88% CAGR as microbial and intracellular expression systems gain adoption. The downstream processing market size for purification surpassed USD 14.75 billion in 2026 and is poised to cross USD 27 billion by 2031, supported by resin capacity expansions and multicolumn innovations. In parallel, homogenisers and microfluidisers remain the workhorses for cell disruption, but low-frequency acoustic methods are attracting pilot-scale trials because they generate less heat.
Continuous chromatography reduces buffer use, aligning with sustainability objectives that influence procurement in Europe. Single-use centrifuges and depth-filtration cassettes improve clarification throughput and minimise contamination risk, a feature valued in multi-product CDMO suites. Integration software that harmonises sensor readings across clarification and capture stages shortens batch release times, giving early adopters a competitive edge.


By Product: Membranes Surge as Chromatography Matures
Chromatography columns and resins commanded a 35.10% revenue share in 2025 and remain the reference standard for antibody capture. Yet filtration and membrane devices exhibit the highest 14.12% CAGR as PFAS-free polymer advances spur replacement cycles. The downstream processing market size for filtration products reached USD 12.2 billion in 2026 and is projected to hit USD 23.6 billion by 2031. Multi-layer depth filters reduce step count by combining clarification and fine filtration in one housing, enhancing facility productivity.
Adaptive control valves and gamma-stable flow paths facilitate modular skid reconfiguration, appealing to CMOs juggling diverse client molecules. Chromatography suppliers respond with high-throughput resin screening kits that cut process development time by 30%. Single-use hardware adoption rises despite debates over disposal costs, as operators value the reduced validation burden.
By Application: Antibody Production Leads, Cell Therapy Surges
Antibody programs maintained a 43.30% share of 2025 revenues, while cell and gene therapies expanded at a 14.90% CAGR, translating into an estimated downstream processing market size of USD 10.3 billion for CGT in 2026. Eight FDA approvals in 2024 validate commercial viability, powering investment in closed-system sterile filtration and viral-vector clarification technologies.
Antibody-drug conjugate pipelines introduce hydrophobic payloads, complicating purification and boosting demand for mixed-mode resins. Vaccine manufacturers leverage mRNA-specific purification resins that tolerate higher alcohol concentrations without ligand leaching. Automation prototypes for autologous cell therapy harvest are entering GMP suites to reduce manual operations, which currently account for 35% of total batch labor cost.
By End User: Biopharma Manufacturers Lead, CDMOs Accelerate
Biopharmaceutical manufacturers accounted for 48.10% of 2025 revenue, yet increasingly rely on CDMO partnerships for capacity and specialised modalities. CDMOs are projected to hold the majority of the downstream processing market share by 2028, with a 15.10% CAGR. Digital twin deployment at service providers standardises run-to-run performance, attracting small biotech clients short on in-house process development resources.
Academic institutes are adopting single-use to shorten tech transfer to CDMOs. Government agencies maintain a niche demand for mRNA and viral vector capacity to support strategic stockpile goals. End users are converging on quality-by-design frameworks, pushing suppliers to embed multivariate analytics into skid controllers to streamline regulatory submissions.
Geography Analysis
North America recorded a 32.50% revenue share in 2025, powered by large-scale investments such as Johnson & Johnson’s USD 2 billion project in North Carolina. Regional producers adopt continuous manufacturing on 75% of new lines and plan to integrate artificial intelligence within 3 years. The downstream processing market benefits from the FDA’s proactive stance on innovative manufacturing guidance, fostering investor confidence in novel purification platforms.
Asia-Pacific is the fastest-growing region, with a 14.35% CAGR, due to large-scale facilities in South Korea, China, Singapore, and India. Samsung Biologics adds 180,000 L capacity while Novartis expands its Singapore site, exemplifying a trend toward mega-facilities supporting global supply. Indian CDMOs position themselves as alternatives following the United States Biosecurity Act. Regional authorities subsidise workforce training to bridge gaps in process-engineering talent and encourage local sourcing of filters and bags.

Competitive Landscape
Thermo Fisher Scientific, Danaher’s Cytiva, Sartorius, and Merck KGaA collectively account for a sizeable portion of global revenue and differentiate through platform breadth. Integrated offerings combine chromatography, filtration, buffer management, and real-time analytics into a single control architecture. Continuous manufacturing skids reduce operating cost by up to 42% at commercial scale, strengthening adoption among antibody producers.
Mid-tier competitors focus on niche strengths such as perfusion filters, electroporation systems, or fiber-based chromatography. Purolite’s USD 200 million resin plant in the United States targets rapid lead-time fulfillment to capture supplier switch-overs driven by cost sensitivity. Regulatory tailwinds reward firms that can certify PFAS-free consumables before enforcement deadlines, giving Sartorius an early-mover advantage with fluoropolymer-free membranes.
Digitalisation accelerates, with vendors embedding machine learning models to predict fouling and automate regeneration schedules. Partnerships between equipment suppliers and CDMOs shorten validation as platforms arrive pre-qualified for multiple molecule classes. Consolidation continues, but competitive intensity remains moderate because technology innovation provides several viable product-differentiation paths.
Downstream Processing Industry Leaders
Thermo Fisher Scientific Inc.
Merck KGaA (Merck Millipore)
Sartorius Stedim Biotech S.A.
Danaher Corporation
GE HealthCare
- *Disclaimer: Major Players sorted in no particular order

Recent Industry Developments
- February 2026: FUJIFILM Biotechnologies announced the expansion of its new manufacturing site in Teesside, UK, to increase localized capacity for medicines and vaccines, with a GBP 400 million (USD 547 million) expansion that adds 19,000 liters of single-use capacity.
- February 2026: Bracco Imaging expanded into the cell-therapy manufacturing space, introducing a bead-free microbubble-based alternative for cell enrichment and activation during upstream processing.
- February 2026: AsymBio, a subsidiary of Asymchem Group, has established integrated technology platforms spanning the full biopharmaceutical development lifecycle and providing end-to-end services from early development to commercial manufacturing.
- February 2026: CD Bioparticles launched a new line of Magnetic Solid-Phase Extraction Particles to simplify complex sample preparation workflows, improving efficiency and reproducibility across biotech, pharmaceutical, clinical, and environmental labs.
- January 2026: Bora Biologics opened an expanded FDA-approved manufacturing facility in San Diego to scale microbial- and mammalian-expressed therapeutics.


Research Methodology Framework and Report Scope
Market Definitions and Key Coverage
Our study defines the downstream processing market as all equipment, consumables, and related services used to recover, purify, concentrate, and formulate biologically derived products such as monoclonal antibodies, vaccines, recombinant proteins, enzymes, and hormones after upstream fermentation or cell culture. Core unit operations span solid-liquid separation, cell disruption, concentration, chromatography-based purification, and final formulation.
Scope exclusion: pilot-scale lab kits intended solely for academic teaching labs are not counted.
Segmentation Overview
- By Technique
- Purification Techniques
- Solid-Liquid Separation
- Clarification / Concentration
- Cell Disruption
- By Product
- Chromatography Columns & Resins
- Filtration & Membrane Devices
- Centrifuges
- Evaporators & Dryers
- Other Products
- By Application
- Antibody Production
- Vaccine Production
- Insulin & Hormone Production
- Cell & Gene-Therapy Products
- Other Applications
- By End User
- Biopharmaceutical & Biosimilar Manufacturers
- Contract Development & Manufacturing Organizations (CDMOs)
- Academic & Research Institutes
- Government & Non-Profit Agencies
- By Geography
- North America
- United States
- Canada
- Mexico
- Europe
- Germany
- United Kingdom
- France
- Italy
- Spain
- Rest of Europe
- Asia-Pacific
- China
- India
- Japan
- Australia
- South Korea
- Rest of Asia-Pacific
- Middle East and Africa
- GCC
- South Africa
- Rest of Middle East and Africa
- South America
- Brazil
- Argentina
- Rest of South America
- North America
Detailed Research Methodology and Data Validation
Primary Research
Mordor analysts interviewed bioprocess engineers at contract development organizations, procurement leads at top-ten vaccine makers, and regional distributors across North America, Europe, and Asia-Pacific. Expert feedback clarified average selling prices for single-use chromatography columns, utilization rates for depth filters, and the timeline for continuous downstream adoption, allowing us to realign preliminary desk figures.
Desk Research
We extracted foundational volume and value signals from public-domain sources such as the FDA's Biologics License Application database, the European Medicines Agency's EPAR files, United Nations Comtrade shipment codes for chromatography columns (HS 902780) and membrane filters (HS 842199), and industry association yearbooks from BioPlan, BPIA, and ISPE. Company 10-Ks, investor decks, and conference abstracts supplied price bands and new-capacity disclosures, which were indexed in D&B Hoovers and Dow Jones Factiva. These references illustrate our information mix; many other documents fed the analytics pipeline.
Market-Sizing & Forecasting
A top-down construct starts with global biologics production volumes (liters), multiplies them by step-wise media-to-product yields and typical consumable usage coefficients to approximate addressable demand pools, which are then priced using validated ASP corridors. Selective bottom-up roll-ups of leading supplier revenues and channel checks benchmark the totals. Key market fingerprints welded into the model include: Biologics clinical pipeline growth, new mammalian cell-culture capacity (L) commissioned per year, average chromatography column re-use cycles, adoption rate of single-use filtration assemblies, and regional vaccine dose output trends.
A multivariate regression with these drivers underpins the 2025-2030 forecast, and scenario analysis stress-tests supply bottlenecks and regulatory shifts. Gaps in bottom-up data, especially for privately held vendors, are bridged with normalized margins derived from public peers before final triangulation.
Data Validation & Update Cycle
Outputs undergo variance checks against independent shipment tallies and quarterly earnings trends. Senior reviewers sign off only after anomalies are reconciled. Reports refresh annually, and material events, such as plant closures and major capacity additions, trigger interim updates. A last-mile analyst sweep ensures clients receive the freshest view.
Why Mordor's Downstream Processing Baseline Commands Reliability
Published figures often differ because firms select distinct product baskets, pricing assumptions, and refresh cadences.
Key gap drivers in this market include whether ancillary buffers and resins are folded into totals, how aggressively single-use penetration is projected, and the currency-conversion dates embedded in each model. Mordor Intelligence reports current-year 2025 revenue at USD 40.78 billion, derived from a transparent blend of biologics output data, validated ASPs, and expert-led sanity checks, whereas other publishers either extrapolate supplier revenues without production context or lock forecasts to early 2024 exchange rates.
Benchmark comparison
| Market Size | Anonymized source | Primary gap driver |
|---|---|---|
| USD 40.78 B (2025) | Mordor Intelligence | - |
| USD 41.81 B (2024) | Global Consultancy A | Relies on unadjusted vendor revenue roll-ups; excludes filtration consumable replenishment cycles |
| USD 31.19 B (2024) | Industry Publication B | Narrows scope to durable hardware, omitting single-use columns and membranes |
| USD 39.10 B (2024) | Market Insights C | Applies static ASPs and annual refresh every second year, inflating CAGR |
In sum, while estimates vary, Mordor's disciplined scope selection, dual-path modeling, and annual refresh cadence provide a balanced, reproducible baseline that decision-makers can trust for strategic planning.


Key Questions Answered in the Report
What is the current size of the downstream processing market in 2026?
The downstream processing market is valued at USD 46.03 billion in 2026 and is forecast to reach USD 84.25 billion by 2031.
Which segment is growing the fastest in downstream processing?
Cell and gene therapy downstream workflows are expanding at 14.90% CAGR through 2031 due to rising FDA approvals and a deep pipeline of investigational therapies.
How do PFAS regulations affect downstream processing suppliers?
Pending restrictions on PVDF and related fluoropolymers are driving investment in new membrane chemistries and creating opportunities for vendors with compliant single-use products.
Which region is expected to see the highest growth rate?
Asia-Pacific is projected to register a 14.35% CAGR to 2031, driven by large plant builds in South Korea, China, Singapore, and India.
What technologies are most likely to reduce downstream processing costs?
Continuous multicolumn chromatography, intensified depth filtration, and digital twins that optimise buffer consumption can cut operating expenses by up to 42% at scale.
Page last updated on:


