Blood Preparation Market Size and Share
Market Overview
| Study Period | 2020 - 2031 |
|---|---|
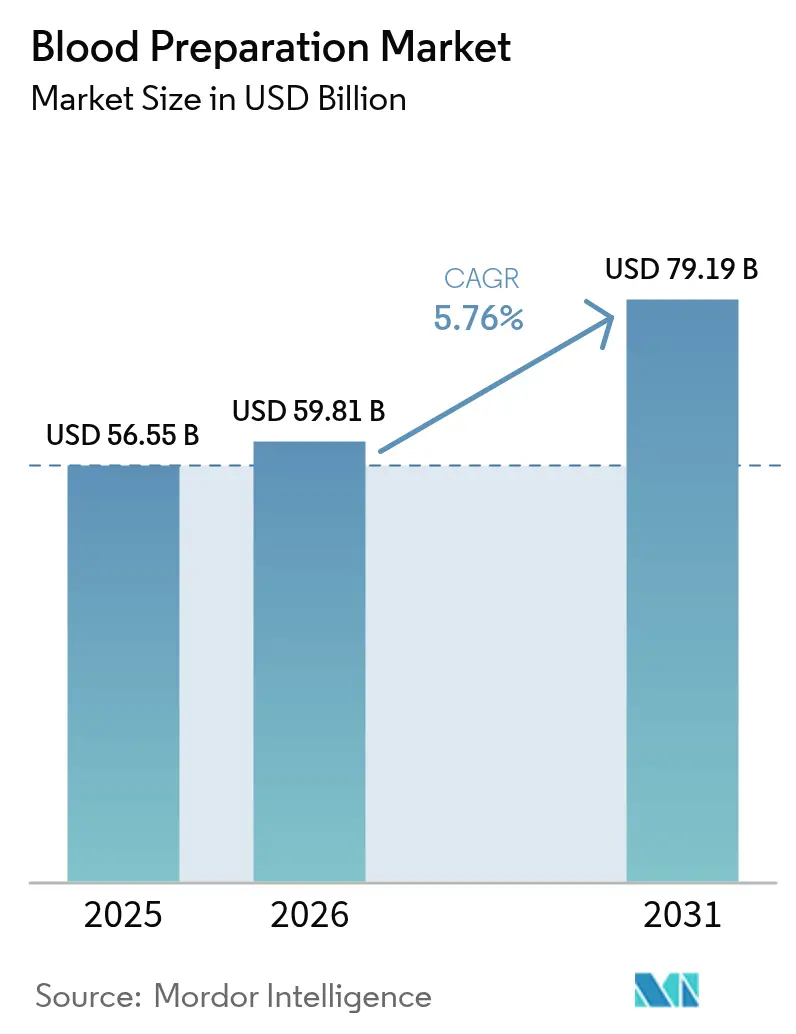
| Market Size (2026) | USD 59.81 Billion |
| Market Size (2031) | USD 79.19 Billion |
| Growth Rate (2026 - 2031) | 5.76% CAGR |
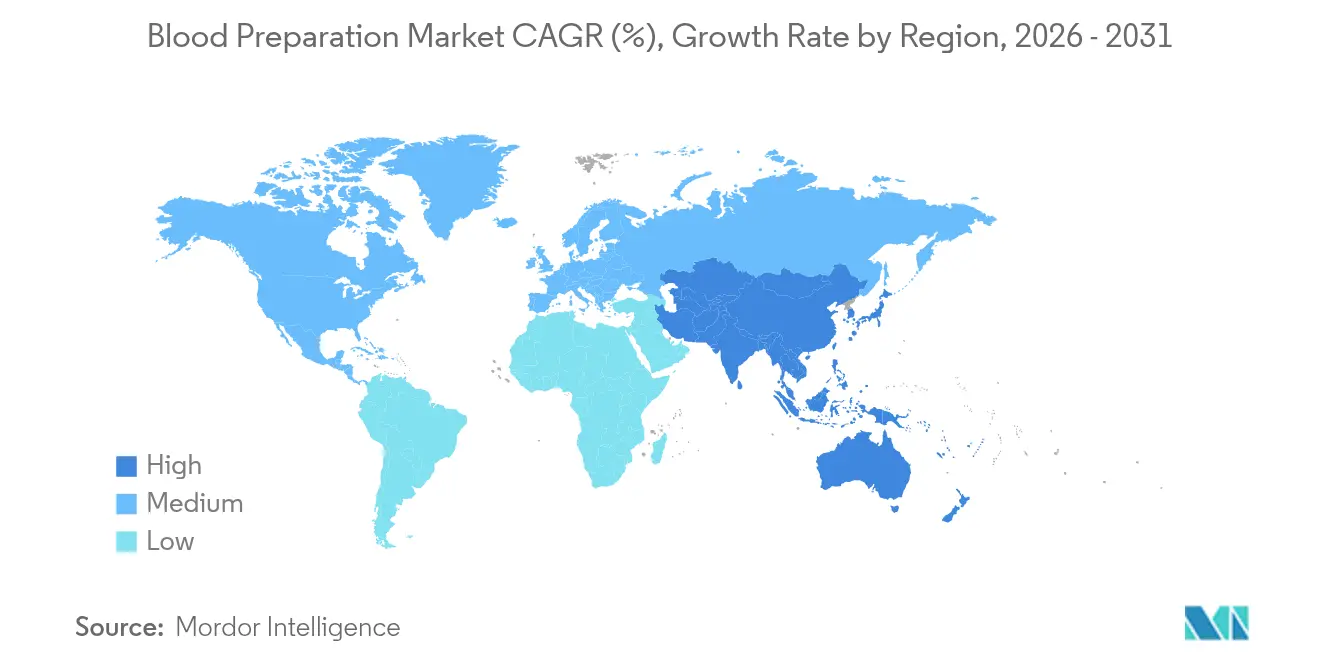
| Fastest Growing Market | Asia-Pacific |
| Largest Market | North America |
| Market Concentration | High |
Major Players *Disclaimer: Major Players sorted in no particular order Image © Mordor Intelligence. Reuse requires attribution under CC BY 4.0. | |
Blood Preparation Market Analysis by Mordor Intelligence
blood preparation market size in 2026 is estimated at USD 59.81 billion, growing from 2025 value of USD 56.55 billion with 2031 projections showing USD 79.19 billion, growing at 5.76% CAGR over 2026-2031. This trajectory is supported by the growing adoption of automated component separation, the spread of pathogen-reduction platforms, and steady growth in surgical volumes that elevate transfusion demand. Parallel expansion in plasma-derived therapeutics, especially immunoglobulins, underscores a move toward precision medicine and chronic-disease management. Consolidation among plasma fractionators is lowering cost per liter and improving supply resilience, while new anticoagulant classes such as factor XI inhibitors are widening clinical use cases. Across regions, robust regulatory frameworks in North America and capacity build-outs in Asia-Pacific create a balanced demand–supply dynamic that sustains long-term growth for the blood preparation market.
Key Report Takeaways
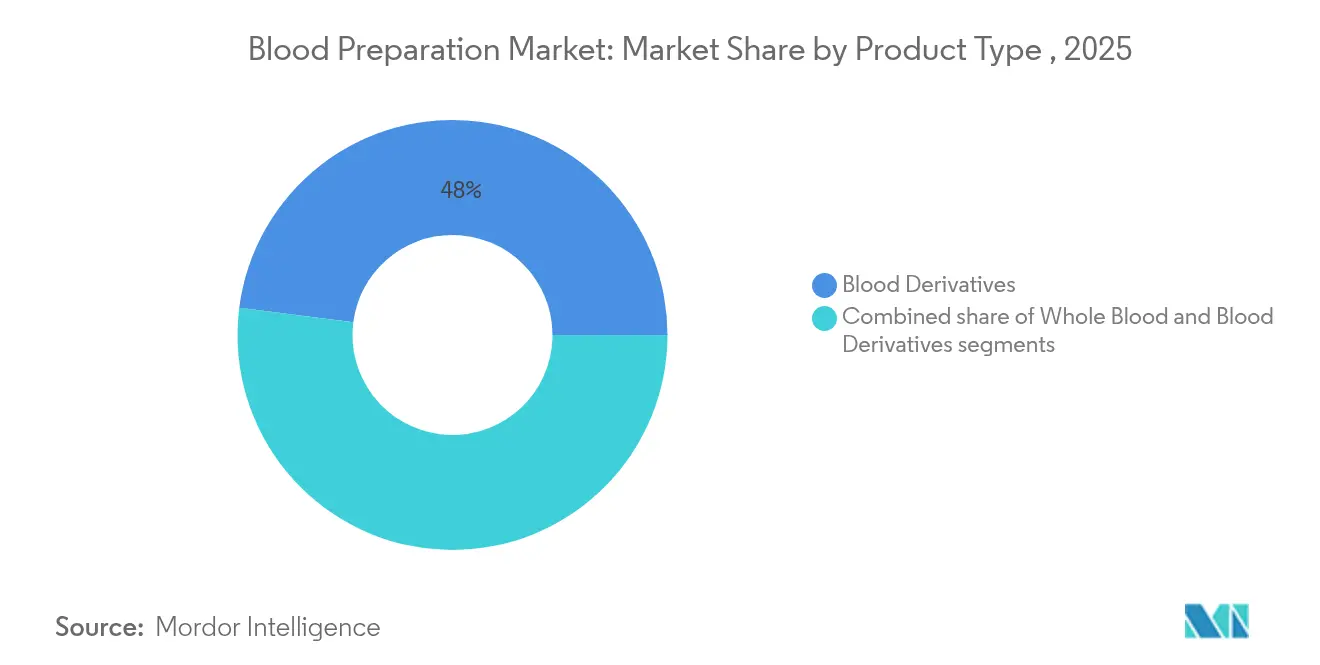
- By product type, blood derivatives led with 47.98% revenue share in 2025, whereas blood components are projected to advance at an 8.12% CAGR through 2031.
- By blood-thinning agent, anticoagulants commanded 60.88% of the blood preparation market share in 2025, while platelet aggregation inhibitors are forecast to grow at 8.29% CAGR to 2031.
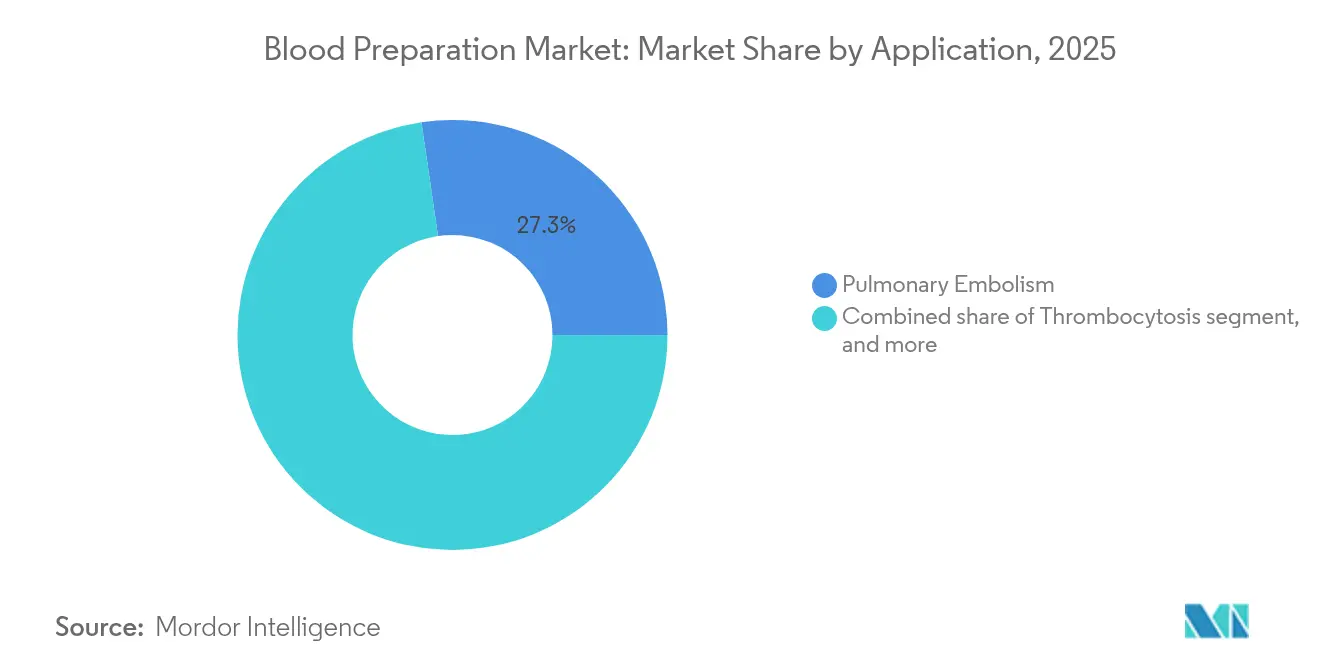
- By application, pulmonary embolism accounted for 27.31% of the blood preparation market size in 2025, while renal impairment shows the quickest expansion at 8.74% CAGR between 2026-2031.
- By end user, hospitals and surgical centers captured 45.22% share of the blood preparation market in 2025; blood and plasma banks exhibit the fastest 9.11% CAGR through 2031.
- By geography, North America dominated with 38.12% share in 2025, whereas Asia-Pacific registers a 7.14% CAGR, the highest regional pace.
Note: Market size and forecast figures in this report are generated using Mordor Intelligence’s proprietary estimation framework, updated with the latest available data and insights as of 2026.
Global Blood Preparation Market Trends and Insights
Driver Impact Analysis*
| Driver | % Impact on CAGR Forecast | Geographic Relevance | Impact Timeline |
|---|---|---|---|
| Increasing Global Surgical Procedures Volume | +1.2% | North America & Europe | Medium term (2-4 years) |
| Growing Prevalence Of Chronic And Hematologic Disorders | +1.5% | APAC emerging markets | Long term (≥4 years) |
| Rising Government Support For Blood Collection Infrastructure | +0.8% | APAC core; spill-over to MEA | Medium term (2-4 years) |
| Advancements In Blood Screening And Processing Technologies | +1.1% | North America & EU; expanding to APAC | Short term (≤2 years) |
| Expansion Of Plasma-Derived Therapeutics Portfolio | +1.3% | Global, strongest in Europe & North America | Long term (≥4 years) |
| Growing Adoption Of Novel Oral Anticoagulants | +1.0% | Global, rapid uptake in developed markets | Medium term (2-4 years) |
| Source: Mordor Intelligence | |||
Increasing Global Surgical Procedures Volume
Elective and trauma-related surgeries are rebounding in 2025, boosting demand for red-cell concentrates and plasma components. Hospitals in the United States increased orthopedic procedure counts by 8% year-on-year, prompting upgrades in component storage and rapid-type testing. Similar momentum is visible in Western Europe, where minimally invasive techniques encourage outpatient surgeries that still require pre-operative blood matching. Automated cross-matching analyzers and digital blood-bank software shorten turnaround times, improving utilization rates for every donated unit. These developments strengthen revenue visibility for the blood preparation market.
Growing Prevalence of Chronic and Hematologic Disorders
Chronic kidney disease, hematologic cancers, and hemophilia continue to rise across Asia-Pacific, expanding recurring demand for plasma-derived immunoglobulins and coagulation factors[1]World Health Organization, “Global Status Report on Blood Safety and Availability 2024,” WHO, who.int. Government reimbursement lists in China and India now include subcutaneous immunoglobulin therapy, accelerating patient access. Multinationals respond by adding fractionation lines and donor centers, while domestic firms partner for technology transfer. The broad disease burden ensures long-term pull for blood derivatives, reinforcing sustainable growth for the blood preparation market.
Rising Government Support for Blood Collection Infrastructure
Indonesia’s first plasma-fractionation plant, designed for 600,000 liters annual capacity by 2026, demonstrates how emerging economies prioritize domestic self-sufficiency. The European Union’s Substances of Human Origin Regulation (2024/1938) mandates harmonized collection standards and projects the need for 2 million new voluntary donors[2]European Parliament, “Regulation (EU) 2024/1938 on Substances of Human Origin,” europarl.europa.eu. National grants in Japan and South Korea subsidize apheresis equipment, widening the donor pool and modernizing collection practices. Such fiscal incentives underpin infrastructure modernization, enlarging the blood preparation market.
Advancements in Blood Screening and Processing Technologies
Terumo Blood and Cell Technologies’ Reveos system slashes manual steps from 26 to 9 and processes four whole-blood units simultaneously, lifting component yield per donation. Cerus Corporation’s INTERCEPT platform achieved 20% revenue growth in 2024 as Canadian Blood Services adopted 100% pathogen-reduction processing. Robotic phlebotomy pilots in Europe reach a 95% first-stick success rate, alleviating staffing constraints and improving donor experience. Collectively these innovations bolster productivity and safety, broadening the clinical appeal of the blood preparation market.
Restraints Impact Analysis*
| Restraints Impact Analysis | (~) % Impact on CAGR Forecast | Geographic Relevance | Impact Timeline |
|---|---|---|---|
| Risk Of Transfusion-Transmitted Infections | -0.7% | Global; acute in developing regions | Long term (≥4 years) |
| High Cost Of Advanced Blood Preparation Technologies | -0.9% | Global; cost-sensitive markets | Medium term (2-4 years) |
| Supply Chain Constraints For Donor Plasma And Heparin | -0.6% | North America, Europe, APAC | Short term (≤2 years) |
| Inadequate Cold Chain And Storage Facilities In Developing Regions | -0.8% | Africa, parts of APAC & Latin America | Medium term (2-4 years) |
| Source: Mordor Intelligence | |||
Risk of Transfusion-Transmitted Infections
Studies in Uganda reported 13.8% prevalence of transfusion-transmitted infections among donors, with HBV and HCV notably high. While pathogen-reduction systems cut malaria transmission risk by 87%, budget limitations hinder adoption where the threat is greatest. International-donor agencies fund pilot programs, yet scalability lags behind infection growth. The persistent gap emphasizes the need for affordable sterilization, tempering absolute growth of the blood preparation market.
High Cost of Advanced Blood Preparation Technologies
Fully automated fractionation lines require multi-million-dollar capital outlays, and lab-grown blood currently costs USD 2,000 per unit. Smaller blood centers struggle to justify upgrades despite long-term efficiency gains. In developing markets, tariff barriers on imported disposables inflate operating expenses. Public–private partnerships and tiered-pricing models are emerging to bridge affordability, but until pricing falls further, cost pressures restrict wider roll-out of next-generation tools within the blood preparation market.
*Our forecasts treat driver/restraint impacts as directional, not additive. The impact forecasts reflect baseline growth, mix effects, and variable interactions.
Segment Analysis
By Product Type: Blood Derivatives Lead Despite Component Innovation
Blood derivatives held 47.98% of 2025 revenue, anchored by strong immunoglobulin and coagulation factor demand. The pulmonary embolism segment accounted for 27.31% share of the blood preparation market size in 2025, supporting derivative consumption in acute settings. CSL Behring logged 20% sales growth for immunoglobulins, aided by a 22% drop in plasma collection cost per liter, illustrating scale economics that favor large fractionators. Automated systems such as Reveos drive 8.12% CAGR for blood components, delivering higher platelet and red-cell yields per unit, lowering wastage, and extending storage times from 42 to 63 days through super-cooling preservation. Increasing hospital adoption of component-specific transfusion protocols sustains this expansion for the blood preparation market.
The derivatives pipeline remains buoyant. Grifols projects USD 1 billion cumulative sales for Yimmugo over seven years post-FDA approval. European governments aim to reach 80% self-sufficiency in albumin by 2030, stimulating domestic contract fractionation programs. Parallel advances in whole-blood robotics and artificial substitutes offer long-range alternatives but will take time to displace established derivatives. Consequently, derivatives retain leadership even as component innovation elevates the efficiency and profitability of the blood preparation market.


By Blood Thinning Agents: Anticoagulant Dominance Faces Innovation Pressure
Anticoagulants represented 60.88% of 2025 revenue, reflecting entrenched clinical guidelines and physician familiarity. Abelacimab, a factor XI inhibitor, reduced bleeding by 67% versus rivaroxaban in atrial-fibrillation trials, propelling platelet-aggregation inhibitor growth at an 8.29% CAGR. Apixaban remained Australia’s most prescribed oral anticoagulant, costing the health system USD 500 million in 2024. The pulmonary embolism segment captured 27.31% share of the blood preparation market, reinforcing anticoagulant volumes across emergency and chronic settings.
Four-factor prothrombin complex concentrate is displacing frozen plasma during cardiac surgery, lowering major bleeding by nearly 50%. Fibrinolytics hold steady demand but face increasing competition from recombinant hemostatic drugs that shorten infusion times. As factor XI agents enter late-stage development, prescribing patterns may pivot, but established anticoagulants will continue to anchor revenue for the blood preparation market during the forecast horizon.
By Application: Pulmonary Embolism Leadership Challenged by Renal Growth
Pulmonary embolism held 27.31% revenue share in 2025, supported by upgraded imaging and risk-stratification tools that encourage earlier intervention. Within this cohort, factor XI inhibitors are expected to capture share because they minimize bleeding risks in high-thrombotic states. Renal impairment therapies expand at 8.74% CAGR, reflecting the growing chronic-kidney-disease patient base in Asia-Pacific and the need for specialized anticoagulation protocols. Precision dosing algorithms based on glomerular-filtration rates are improving safety and reducing readmissions, enhancing adoption across nephrology clinics.
Thrombocytosis management leverages novel aggregation inhibitors, and cancer-associated thrombosis drives additional uptake of low-molecular-weight heparins. Pediatric anticoagulation remains niche but is poised for growth as safety data become more robust. These shifts illustrate how tailored therapies sustain demand diversification within the blood preparation market.
By End User: Hospital Dominance Shifts Toward Specialized Centers
Hospitals and surgical centers secured 45.22% of 2025 revenue, benefiting from integrated blood-management programs that reduced wastage by 12% at leading U.S. academic centers. Nonetheless blood and plasma banks will grow 9.11% CAGR as apheresis automation enables higher throughput without extra donations, enhancing cost efficiency for regional blood systems. Sanquin’s national roll-out of Reveos added capacity equivalent to 90,000 additional platelet pools annually without additional donors.
Ambulatory surgery centers deploy point-of-care hemoglobin testing that shortens pre-op screening to five minutes, supporting decentralized care. Home-health providers increasingly use capillary collection devices that deliver venous-quality samples, broadening access for chronic-disease monitoring. The changing end-user mix highlights the flexibility and reach of the blood preparation market.
Geography Analysis
North America retained 38.12% of 2025 revenue, underpinned by 350 CSL Plasma donor centers and rapid uptake of the Rika collection system, which cuts donation time by 15 minutes. The region’s elaborate regulatory agenda, with five blood-focused guidance documents slated for 2025, accelerates technology approval and adoption. Yet climate disruptions dent supply: the American Red Cross saw a 25% inventory drop in July 2024 during extreme heat and storms.
Asia-Pacific registers the highest 7.14% CAGR. Terumo’s USD 15 million Hangzhou plant enhances local production, while Indonesia’s plasma-fractionation project fast-tracks regional self-sufficiency. Japan’s artificial-blood program at Nara Medical University could revolutionize emergency transfusion with two-year shelf life and universal compatibility. Europe focuses on autonomy under the new SoHO regulation, requiring 2 million extra donors and common quality standards across member states. The United Kingdom is on track for 25% immunoglobulin self-sufficiency by 2025, aided by domestic fractionation contracts gov.uk. Sanquin’s adoption of automated processing in the Netherlands demonstrates how technology reduces dependence on incremental donations. These geographic dynamics collectively reinforce a balanced global outlook for the blood preparation market.

Competitive Landscape
The blood preparation market is consolidated. The combined plasma therapy revenue of CSL, Takeda, and Grifols exceeds USD 30 billion, giving the top tier bargaining power with regulators and payers. CSL raised profit 15% in 2024 by trimming plasma-collection cost per liter by 22% and launching gene therapy HEMGENIX for hemophilia B. Grifols posted EUR 6.592 billion revenue but is evaluating divestitures to streamline debt.
Strategic focus pivots toward vertical integration and technology differentiation. Haemonetics divested its whole-blood segment for USD 67 million to concentrate on higher-margin apheresis and plasma systems. Cerus grew revenue 20% as its INTERCEPT platform became a standard for Canadian Blood Services. Device innovators pursue robotics, while biotech entrants develop lab-grown blood and artificial substitutes that could disrupt incumbent plasma fractions.
White-space opportunities include decentralized testing, emerging-market fractionation, and pathogen-inactivated red-cell products. However the discontinuation of Pfizer’s Beqvez gene therapy after FDA approval underscores market-acceptance challenges for high-price advanced therapies. Overall, firms that marry scale with technological edge are best positioned to gain share in the blood preparation market.
Blood Preparation Industry Leaders
CSL Behring
Takeda Pharmaceutical Co.
Takeda Pharmaceutical Co. Baxter International
Grifols S.A
Octapharma AG
- *Disclaimer: Major Players sorted in no particular order


Recent Industry Developments
- March 2025: Sanofi secured FDA approval for Qfitlia (fitusiran), reducing annualized bleeding episodes by 71-73% in hemophilia A and B with six injections per year.
- March 2025: DHL Group acquired CRYOPDP, enhancing cold-chain capacity for blood products and cell therapies across 15 countries.
- February 2025: Pfizer halted Beqvez commercialization due to limited uptake despite FDA approval, illustrating adoption hurdles for premium gene therapies.
- February 2025: Terumo Blood and Cell Technologies launched Reveos in the United States with Blood Centers of America, automating four-unit whole-blood separation in one spin.
- January 2025: Haemonetics Corporation closed the sale of its whole-blood assets to GVS for USD 67.8 million to sharpen focus on apheresis and plasma technologies.


Research Methodology Framework and Report Scope
Market Definitions and Key Coverage
Mordor Intelligence defines the blood preparation market as every step from voluntary collection through fractionation, storage, and hospital delivery of whole blood, blood components, and plasma-derived products that are transfused or used as therapeutic agents in humans.
Scope exclusion: veterinary blood products and standalone anticoagulant drug revenues remain outside this study.
Segmentation Overview
- By Product Type
- Whole Blood
- Blood Components
- Red Blood Cells
- Platelets
- Plasma
- Blood Derivatives
- Immunoglobulins
- Coagulation Factors VIII & IX
- Albumin
- By Blood Thinning Agents
- Anticoagulants
- Fibrinolytics
- Platelet Aggregation Inhibitors
- By Application
- Thrombocytosis
- Pulmonary Embolism
- Renal Impairment
- Other Applications
- By End User
- Hospitals & Surgical Centers
- Blood & Plasma Banks
- Other End Users
- Geography
- North America
- United States
- Canada
- Mexico
- Europe
- Germany
- United Kingdom
- France
- Italy
- Spain
- Rest of Europe
- Asia-Pacific
- China
- Japan
- India
- Australia
- South Korea
- Rest of Asia-Pacific
- Middle East & Africa
- GCC
- South Africa
- Rest of Middle East & Africa
- South America
- Brazil
- Argentina
- Rest of South America
- North America
Detailed Research Methodology and Data Validation
Primary Research
Mordor analysts interviewed senior transfusion medicine clinicians, blood-bank directors, plasma fractionation engineers, and procurement officers across North America, Europe, Asia-Pacific, and Latin America. Insights from these conversations filled data gaps on collection yields, discard rates, and emerging point-of-care technologies, letting us adjust secondary numbers before finalizing assumptions.
Desk Research
We began with widely trusted, freely accessible sources such as the WHO Global Database on Blood Safety, the American Association of Blood Banks fact sheets, Eurostat surgical discharge files, and the US CDC National Blood Collection and Utilization Survey. National regulatory portals, for example, the US FDA biologics approvals list and India's NBTC hemovigilance bulletins, supplied donation and fractionation capacity data. Company 10-Ks, investor decks, and Dow Jones Factiva news helped our team track plant expansions, ASP moves, and pathogen-reduction roll-outs. D&B Hoovers financial pulls confirmed revenue splits for key plasma fractionators. This list is illustrative, and many other sources fed the desk study.
Market-Sizing & Forecasting
A top-down model that reconstructs global transfusion demand from surgical volumes, accident statistics, and prevalence-to-treated patient pools is the spine of our estimate, and it is cross-checked through selective bottom-up supplier roll-ups. Key inputs include average units collected per thousand population, plasma fractionation yield per liter, per-capita elective surgery growth, chronic disease prevalence, and median anticoagulant usage per thrombosis case. Multivariate regression links these drivers to historical revenue, while scenario analysis tests currency swings and donation rate shocks. Where supplier data were partially missing, weighted regional averages from primary interviews plugged the gaps.
Data Validation & Update Cycle
Outputs pass a two-step analyst peer review, anomaly flags trigger re-contact with experts, and statistical variance thresholds must clear before sign-off. Reports refresh annually and are updated mid-cycle if policy changes or technology disruptions materially move the baseline.
Why Mordor's Blood Preparation Baseline Commands Reliability
Published market values often differ. Divergences usually arise from unequal scope choices, mixed base years, or hurried refresh cadences.
Key gap drivers for this market include whether platelet-rich plasma kits are bundled, how outpatient anticoagulant sales are treated, and if donated-unit counts are converted at collection or at hospital issue price. Our study standardizes on 2024 collection costs, excludes standalone drugs, and rolls forward exchange rates quarterly, which explains why our 2025 figure sits above some peers yet below very aggressive long-range projections.
Benchmark comparison
| Market Size | Anonymized source | Primary gap driver |
|---|---|---|
| USD 56.55 B (2025) | Mordor Intelligence | - |
| USD 47.82 B (2023) | Global Consultancy A | Older base year and excludes plasma-derived immunoglobulins |
| USD 51.10 B (2024) | Industry Publication B | Includes retail anticoagulant drugs and counts veterinary demand |
In short, the disciplined scoping choices, frequent refresh cycle, and dual-path validation give clients a balanced, transparent baseline that aligns closely with real collection activity and transfusion needs worldwide.


Key Questions Answered in the Report
What is the current value of the blood preparation market?
The blood preparation market size stood at USD 59.81 billion in 2026 and is projected to reach USD 79.19 billion by 2031 at a 5.76% CAGR.
Which segment is growing fastest within the blood preparation market?
Blood components are expanding most rapidly, posting an 8.12% CAGR through 2031 due to wider adoption of automated separation systems.
Who holds the largest share of the blood preparation market by geography?
North America leads with 38.12% market share in 2025, driven by extensive plasma-collection infrastructure and supportive regulation.
How are factor XI inhibitors influencing anticoagulant therapy?
Factor XI inhibitors such as abelacimab reduce major bleeding up to 67% compared with older anticoagulants, fueling 8.29% CAGR for platelet aggregation inhibitors.
What technologies are modernizing blood preparation processes?
Automation platforms like Terumo’s Reveos, pathogen-reduction systems from Cerus, and robotic phlebotomy devices are shortening processing times, improving safety, and lowering costs for blood centers.
Why is Asia-Pacific considered the most attractive growth region?
A 7.14% CAGR is supported by healthcare modernization, new fractionation plants, and localization investments by multinational firms, enhancing supply security and access to plasma-derived therapies.
Page last updated on:


