
Preclinical CRO Market Size and Share
Market Overview
| Study Period | 2020 - 2031 |
|---|---|
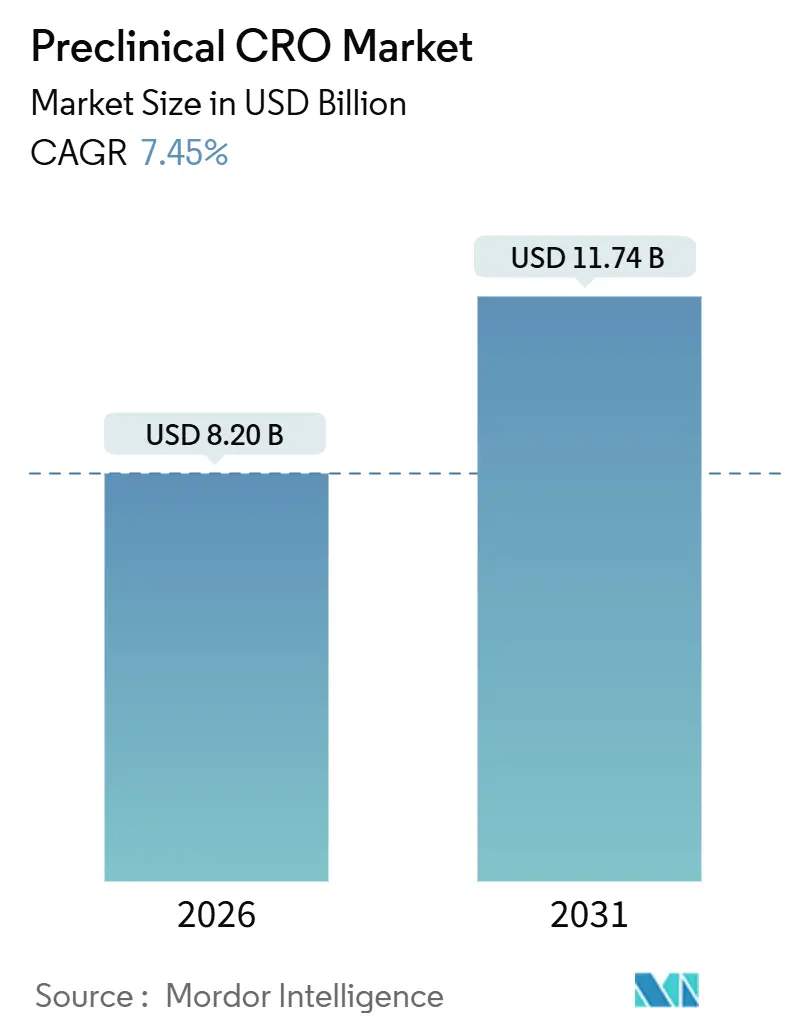
| Market Size (2026) | USD 8.20 Billion |
| Market Size (2031) | USD 11.74 Billion |
| Growth Rate (2026 - 2031) | 7.45 % |
| Fastest Growing Market | Asia-Pacific |
| Largest Market | North America |
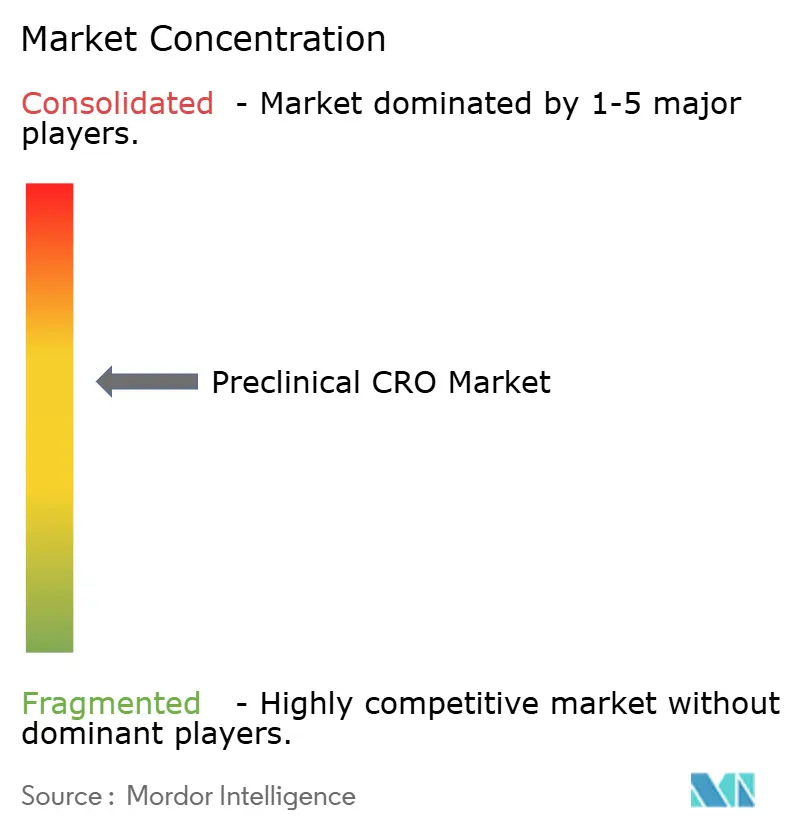
| Market Concentration | Medium |
Major Players *Disclaimer: Major Players sorted in no particular order Image © Mordor Intelligence. Reuse requires attribution under CC BY 4.0. | |
Preclinical CRO Market Analysis by Mordor Intelligence
The Preclinical CRO Market size is estimated at USD 8.20 billion in 2026, and is expected to reach USD 11.74 billion by 2031, at a CAGR of 7.45% during the forecast period (2026-2031).
The rise of asset-light R&D models, the U.S. FDA Modernization Act 2.0, and accelerating adoption of AI-enabled in-silico platforms are reshaping sponsor strategies and allowing CRO partners to compress timelines and reduce development risk. ICH M3(R2) updates, coupled with cardiovascular liability concerns for novel modalities, continue to elevate the profile of safety pharmacology, while patient-derived organoids are challenging patient-derived xenograft (PDX) dominance by delivering faster, more predictive oncology data. Asia-Pacific enjoys a double-digit tailwind, driven by cost advantages in China and India, whereas North America retains its anchor position due to regulatory proximity, established GLP infrastructure, and rapid study-start capability. Competitive intensity is rising as mid-tier CROs leverage AI-guided study design, while consolidation among top players consolidates GLP capacity and broadens geographic footprints.
Key Report Takeaways
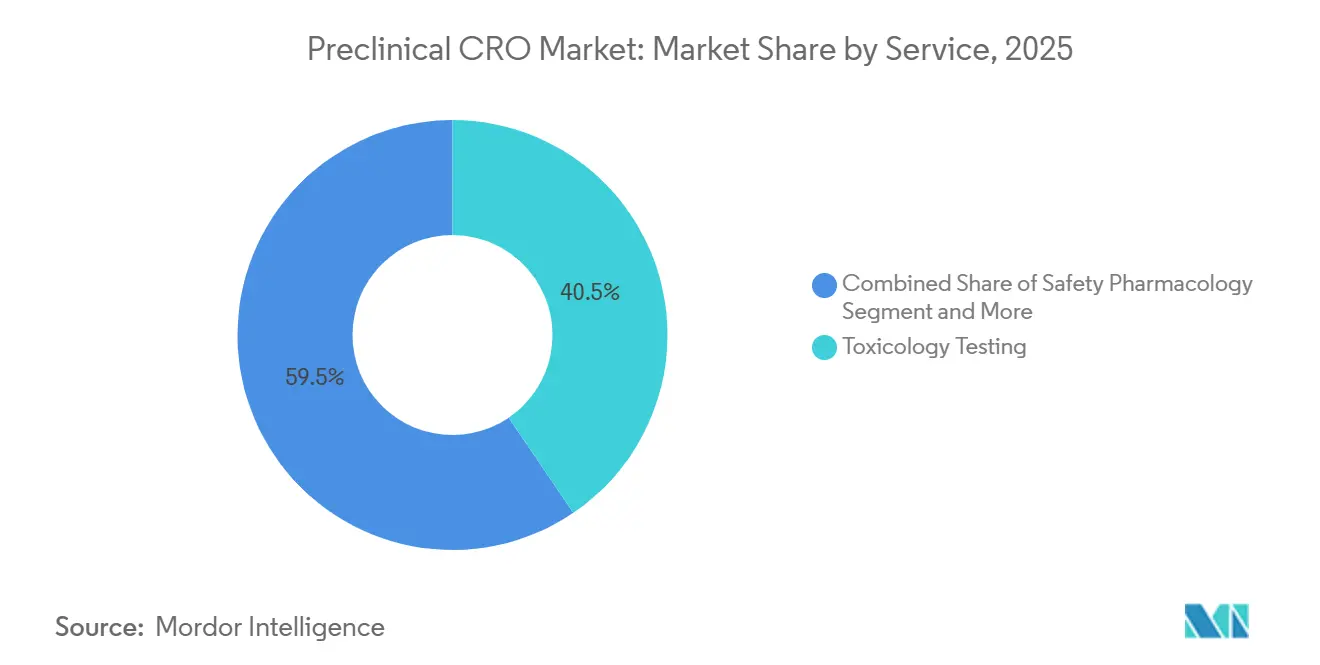
- By service, toxicology commanded a 40.55% preclinical CRO market share in 2025, while safety pharmacology expanded at a 12.25% CAGR through 2031.
- By model type, patient-derived xenografts led with 53.53% revenue share in 2025, but patient-derived organoids are forecast to advance at a 13.85% CAGR to 2031.
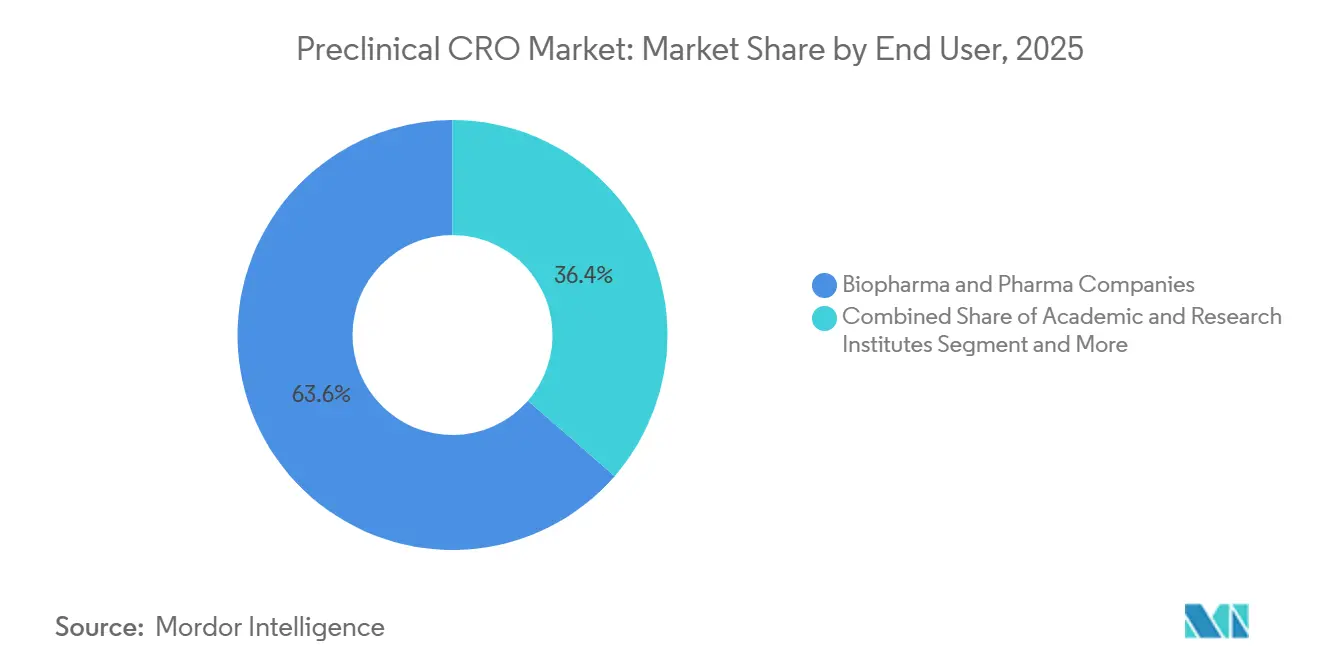
- By end user, biopharma captured 63.63% of 2025 spending, whereas academic and research institutes are growing at an 11.87% CAGR through 2031.
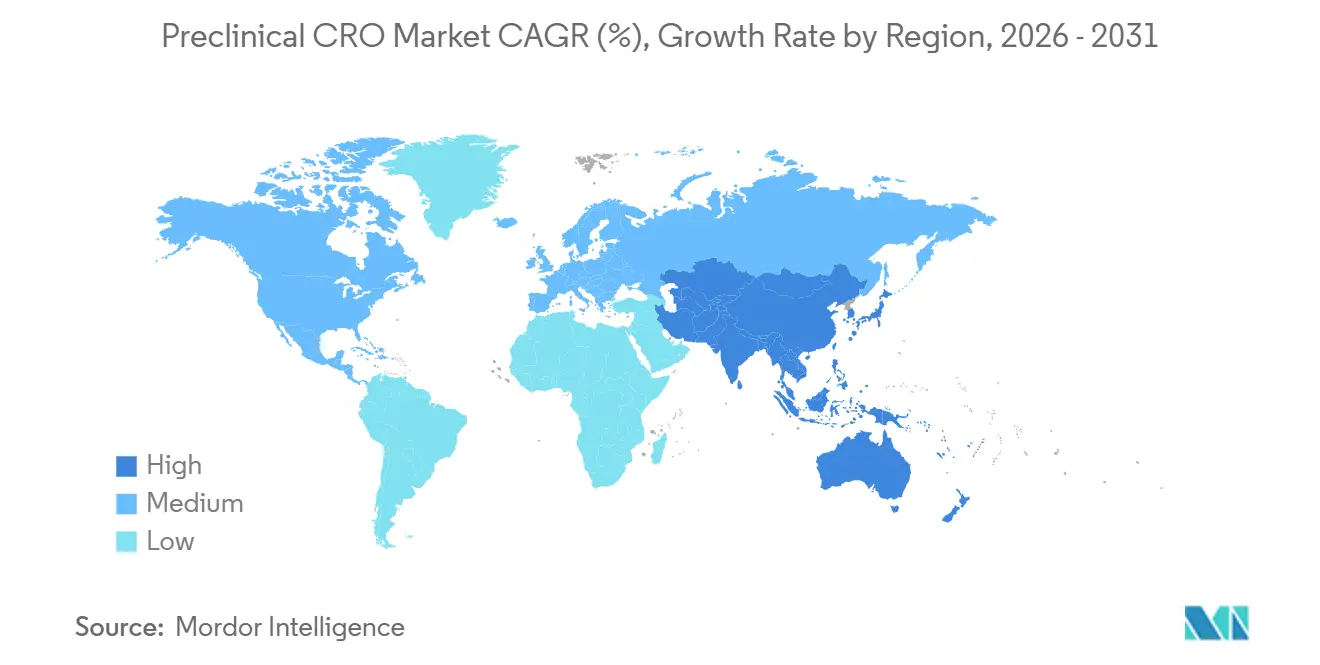
- By geography, North America held 45.13% of 2025 revenue, and Asia-Pacific is poised to grow at a 10.81% CAGR through 2031.
Note: Market size and forecast figures in this report are generated using Mordor Intelligence’s proprietary estimation framework, updated with the latest available data and insights as of January 2026.
Market Trends and Insights
Drivers Impact Analysis of Preclinical CRO Market*
| Driver | (~) % Impact on CAGR Forecast | Geographic Relevance | Impact Timeline |
|---|---|---|---|
| Increasing R&D expenditure in drug discovery | +1.8% | Global, with concentration in North America and Europe | Medium term (2-4 years) |
| Expansion of preclinical pipelines | +1.5% | Global, APAC spill-over from Western biotech hubs | Long term (≥ 4 years) |
| Cost & time efficiency from outsourcing | +1.3% | North America & EU core, emerging adoption in APAC | Short term (≤ 2 years) |
| Adoption of AI-enabled in-silico models | +1.2% | North America, EU, early gains in China and India | Medium term (2-4 years) |
| Demand for CRO capabilities in advanced therapies | +1.4% | North America & EU dominance, emerging in China and South Korea | Medium term (2-4 years) |
| Source: Mordor Intelligence | |||


Increasing R&D Expenditure in Drug Discovery
Pharmaceutical R&D budgets soared in 2025, with Pfizer committing USD 10.7-11.7 billion yet shuttering internal toxicology labs to redirect spending toward digital pathology capabilities[1]Pfizer, “2025 Form 10-K,” pfizer.com. CROs absorbed 35-40% of toxicology workflows as oncology and rare-disease sponsors pursued episodic preclinical packages rather than maintaining fixed in-house capacity. NIH extramural funding reached USD 22.3 billion, with 18% earmarked for IND-enabling research that necessitates GLP-compliant endpoints from external partners. Small biotechs filed 62% of U.S. INDs in 2024, further insulating the preclinical CRO market from downturns in large-pharma pipelines. The resulting demand shift has strengthened CRO bargaining power on pricing and schedule priority.
Expansion of Preclinical Pipelines
More than 8,200 active preclinical programs were in play during 2025, including 1,450 cell and gene therapy candidates, up 22% from 2023. EMA’s revised ATMP guideline now mandates two-species vector shedding studies, effectively doubling workloads for gene-therapy CRO groups. GLP-1 receptor agonists and APOE4-targeted drugs added 340 new pipeline entries, each requiring multi-species toxicology and CNS penetration assays. Chinese sponsors alone initiated 1,100 programs and are partnering with Western CROs to secure dual-market data packages, creating back-to-back study requests for the same compound series. The broadened pipeline has compressed GLP capacity, prompting CROs to fast-track facility expansions.
Cost and Time Efficiency from Outsourcing
Outsourcing a 13-week GLP toxicology study costs USD 450,000-650,000, whereas maintaining a fully accredited vivarium can exceed USD 3-5 million per year, a break-even threshold viable only for sponsors running at least 8-10 studies annually. Virtual biotechs, representing 48% of recent IND submissions, rely exclusively on CRO networks and increasingly prefer integrated “IND-Ready” bundles that consolidate DMPK, toxicology, and bioanalysis under a single contract. CROs have introduced milestone-linked pricing that defers 20-30% of study fees until successful IND acceptance, conserving sponsor liquidity while aligning incentives. Parallel rodent and non-human-primate studies across multi-site facilities now trim IND timelines to 11-12 months, well below legacy in-house cycles.
Adoption of AI-Enabled In-Silico Models
Insilico Medicine’s rentosertib advanced to Phase 2a in 2025 using computational toxicology and organ-on-chip platforms for lead optimization, exemplifying a paradigm where AI guides preclinical decisions. FDA’s 2024 Alternative Methods Roadmap endorses validated QSAR and PBPK models, and Crown Bioscience’s HuPrime AI reduces required PDX cohorts by 60%, saving 40% in direct costs. EMA bioanalytical guidance now permits PBPK simulations in lieu of certain bridging studies, channeling budgets from animal DMPK to computational biology. Sponsors routinely run in-silico screens before committing to GLP studies, concentrating deferred capital on higher-probability assets.
Restraints Impact Analysis of Preclinical CRO Market*
| Restraint | (~) % Impact on CAGR Forecast | Geographic Relevance | Impact Timeline |
|---|---|---|---|
| Lack of standardization & data interoperability | -0.6% | Global, acute in North America and EU multi-CRO programs | Short term (≤ 2 years) |
| Stringent regulatory & animal-welfare compliance | -0.5% | EU and North America core, emerging in APAC | Medium term (2-4 years) |
| Shortage of skilled in-vivo pharmacology talent | -0.4% | Global, most severe in North America and Western Europe | Long term (≥ 4 years) |
| Source: Mordor Intelligence | |||
Lack of Standardization and Data Interoperability
SEND validation errors affected 38% of 2024 IND submissions, forcing resubmissions and adding 30-60 days to FDA review times. Proprietary LIMS platforms hinder data merging across CRO partners, imposing 15-20% budget overruns on sponsors who must reconcile histopathology and clinical pathology datasets manually. Only 12 of the top 20 CROs joined Pistoia Alliance’s FAIR Preclinical Data initiative by mid-2026, prolonging metadata fragmentation. Consolidation to preferred-provider panels has therefore intensified as sponsors aim to contain integration overhead.
Stringent Regulatory and Animal-Welfare Compliance
EU Directive 2010/63/EU adds 8-12 weeks to animal-study approvals and lifts per-study administrative costs by 12-15% versus comparable U.S. projects. AAALAC accreditation now incorporates unannounced inspections, raising annual compliance costs to USD 1.2-1.8 million for Western CROs. Talent shortages exacerbate delays; fewer than 50 new board-certified toxicologic pathologists emerge globally each year, falling short of retirements by a 3:2 ratio and forcing outsourcing of histopathology reads. Sponsors often accept higher Western CRO costs to minimize regulatory risk, perpetuating cost differentials with Asia-Pacific providers.
*Our forecasts treat driver/restraint impacts as directional, not additive. The impact forecasts reflect baseline growth, mix effects, and variable interactions.
Preclinical CRO Market Segment Analysis
By Service:
Toxicology Anchors, Safety Pharmacology AcceleratesToxicology testing delivered a 40.55% preclinical CRO market share in 2025, reflecting its obligatory role in IND-enabling packages under ICH M3(R2)[2]International Council for Harmonisation, “ICH M3(R2),” ich.org. Repeat-dose studies in two species remain standard, even as organ-on-chip tools displace some exploratory work. Safety pharmacology, however, is racing ahead at a 12.25% CAGR, buoyed by rising cardiovascular liability concerns and a surge in hERG channel and QT interval investigations. The preclinical CRO market size for safety pharmacology is forecast to double by 2031 as more sponsors run conscious telemetered dog studies for kinase inhibitors. Bioanalysis and DMPK remain pivotal for complex modalities such as antibody-drug conjugates, where intact antibody and payload quantification demand specialized LC-MS/MS expertise. Integrated “IND-Ready” bundles continue to gain traction, embedding formulation and DMPK services into fixed-price toxicology packages that simplify procurement for biopharma sponsors.
The rise of organ-on-chip platforms introduces hybrid workflows: sponsors screen multiple leads on microphysiological systems, advance the most promising into GLP studies, and reduce late attrition. The FDA-qualified Liver-Chip now replaces some exploratory hepatotoxicity studies, yet full animal packages remain mandatory for global filings, limiting immediate substitution potential. Genotoxicity work is partially shifting to in-silico QSAR, but regulators still insist on confirmatory Ames and micronucleus tests, preserving a stable revenue floor for wet-lab assays.


By Model Type:
PDX Dominates, PDO DisruptsPDX models produced 53.53% of 2025 model-type revenue, anchored by their high predictive value for targeted oncology therapies. The preclinical CRO market size for PDX studies is projected to climb steadily as immuno-oncology pipelines advance. PDO platforms, expanding at a 13.85% CAGR, can generate efficacy data in eight weeks versus six months for PDX, enabling sponsors to evaluate 3-4 compounds in the time historically needed for one. Cost gaps are narrowing, with PDO assays priced at USD 15,000-25,000 per sample compared to USD 30,000-50,000 for PDX engraftment. Sponsors increasingly triangulate findings by running both models in parallel, enhancing confidence in clinical go-forward decisions.
Growth in AI-guided prediction is strengthening model selection. Platforms such as HuPrime AI predict PDX response based on tumor genomics, reducing the number of animals required and trimming overhead. Regulatory validation of Simcyp PBPK for pediatric dosing further bolsters computational models, although immune-mediated toxicities still necessitate non-human-primate studies, sustaining baseline demand for traditional in-vivo work.
By End User:
Biopharma Leads, Academia Gains VelocityBiopharma sponsors captured 63.63% of 2025 spending, leveraging outsourcing to preserve capital for discovery programs and limit fixed infrastructure[3]Pharmaceutical Research and Manufacturers of America, “2025 Industry Profile,” phrma.org . Academic and research institutes, however, are growing at an 11.87% CAGR on the back of NIH mandates that require GLP toxicology data for IND-enabling grants. The preclinical CRO market size tied to academic users is therefore widening faster than for traditional pharma, aided by turnkey packages that pair study design with regulatory consulting. Public-private consortia, such as BARDA’s USD 450 million pandemic-countermeasure fund, are routing 70% of resources to CROs, spurring demand for accelerated toxicology under compressed timelines.
Virtual biotechs, a subset of the biopharma category, now account for nearly half of U.S. IND submissions. With no internal vivaria, these firms commission soup-to-nuts CRO engagements that include protocol development, dose escalation, safety pharmacology, and SEND submission. Their growth adds structural resilience to the preclinical CRO market, even when big-pharma pipelines cycle down.
Geography Analysis
North America, Europe and APAC Preclinical CRO Market
North America accounted for 45.13% of 2025 revenue, buoyed by FDA proximity, AAALAC-certified infrastructure, and the ability to initiate studies within four to six weeks of contract signature. The region’s dominance is reinforced by rapid ethical review processes compared with Europe, where stricter animal-use audits delay starts. Nonetheless, preclinical CRO market size in Asia-Pacific is forecast to climb at a 10.81% CAGR through 2031, reflecting China’s duty-free import policies and India’s alignment with ICH guidelines. WuXi AppTec expanded its Suzhou campus by 12,000 square meters in 2025, a move that allows more than 600 IND-ready studies annually for a global clientele.
EMEA and South America Preclinical CRO Market
Europe remains indispensable for large-animal cardiovascular pharmacology. Labcorp’s acquisition of a U.K. facility added capacity for conscious telemetered dog studies, which often become rate-limiting for kinase inhibitor programs. South America and the Middle East & Africa sit at earlier adoption stages; however, Brazil’s AAALAC-accredited São Paulo site, opened in 2025, signals nascent regional momentum.
APAC, North America and Europe Preclinical CRO Market
Cross-border demand is reshaping site strategy. Many Western sponsors run exploratory work in Asia-Pacific for cost reasons but conduct pivotal GLP studies in North America or Europe to ease audits. This dual-sourcing model puts pressure on CROs to maintain consistent data standards across regions.
Mordor Intelligence provides coverage of the preclinical cro market across other key regional markets. Detailed country-level analysis extends to India incorporating local coverage and market participation, as required.

Regulatory Landscape
Global preclinical outsourcing operates under internationally recognized nonclinical requirements, led by ICH guidance such as ICH M3(R2) for the timing and content of nonclinical safety studies and ICH S6(R1) for biologics-specific expectations, alongside jurisdictional Good Laboratory Practice (GLP) rules that govern study conduct and data integrity. In the United States, FDA GLP expectations for electronic systems emphasize audit trails, raw data accessibility, and inspection-ready documentation, which increases compliance and validation burdens for CROs running IND-enabling packages.
Regulators are also formalizing pathways for New Approach Methodologies (NAMs) to complement, and in defined contexts reduce, reliance on animal studies. A 2025 FDA-NIH workshop highlighted an emerging harmonization framework for NAM validation across agencies including the EMA, PMDA (Japan), BfR (Germany), and TGA (Australia), supporting multi-region acceptance when methods are qualified and appropriately justified. This shift expands the scope CROs must manage, spanning GLP animal studies, validated computational approaches (for example, PBPK/QSAR where accepted), and defensible bridging strategies across regions.
Competitive Landscape
The top players, Charles River Laboratories, Labcorp Drug Development, WuXi AppTec, Eurofins, and others, controlled a significant share of global revenue in 2025, giving the preclinical CRO market a moderate concentration profile. Charles River’s USD 1.9 billion purchase of Explora BioLabs in 2024 added European large-animal surgery capacity, directly contesting Labcorp’s cardiovascular niche. Mid-tier firms differentiate through AI infrastructure; Syngene’s BioInformatics Hub optimizes dose escalation and reduces animal use by 25%, delivering clear 3Rs advantages to risk-averse sponsors.
Organ-on-chip vendors blur the line between technology and service. Emulate Bio’s FDA-qualified Liver-Chip now competes for exploratory hepatotoxicity budgets, creating a disruptive flank that traditional CROs must address. Asia-Pacific players continue to offer 30-40% cost savings, yet only 22 of China’s 80+ CROs hold AAALAC accreditation, limiting access to Western regulatory filings. Preferred-provider panels and rigorous data-quality audits favor incumbents with global GLP footprints, while niche specialists capture price premiums for advanced-therapy assays such as AAV biodistribution and tumorigenicity testing.
Preclinical CRO Industry Leaders
Labcorp Drug Development
Eurofins Scientific
WuXi App Tec
SGS SA
Charles River Laboratories
- *Disclaimer: Major Players sorted in no particular order
Preclinical CRO Market Companies Covered in this Report
- Altasciences Company Inc.
- BioDuro-Sundia
- Charles River
- Crown Bioscience
- Envigo (part of Inotiv)
- Eurofins
- ICON
- Inotiv Inc.
- ITR Laboratories Canada Inc.
- LabCorp
- MedPace
- NorthEast BioAnalytical Laboratories LLC
- Parexel International
- PharmaLegacy Laboratories
- Pharmaron
- SGS
- Syngene International
- Thermo Fisher Scientific Inc. (PPD)
- WuXi App Tec

Market Opportunities and Future Outlook
Opportunities center on sponsors seeking compliant, integrated IND-enabling packages that combine GLP toxicology, DMPK and bioanalysis, safety pharmacology, and submission-ready datasets, especially as virtual and small biotech models increase outsourcing intensity. The continued push toward NAMs creates white-space for CROs that can operationalize organ-on-chip and in-silico capabilities alongside traditional in vivo work within regulator-facing quality systems. The FDA Modernization Act 2.0 and the FDA Alternative Methods Roadmap have moved NAM evaluation from exploratory pilots toward structured adoption, which reinforces demand for method qualification, validation support, and hybrid study designs.
Data standardization and interoperability remain a practical bottleneck and a commercial differentiator for platform CROs. With SEND validation errors affecting a meaningful share of submissions and only a portion of large CROs participating in industry data initiatives by mid-2026, sponsors are consolidating work toward providers that can maintain harmonized LIMS workflows, quality-controlled SEND delivery, and audit-ready electronic records across multi-site programs. Recent collaborations also point to demand for AI-enabled decision support embedded into nonclinical services. The June 2026 Charles River and Lilly TuneLab work to integrate AI/ML optimization with nonclinical testing expertise supports faster down-selection and supports a service premium for CROs that can combine model development, translational endpoints, and GLP execution.
Recent Industry Developments in Preclinical CRO Market
- April 2026: SureNano Science announced planning of FDA IND-enabling GLP toxicology and pharmacology studies for lead candidate GEP-44 in collaboration with Labcorp. The initiative advances an IND-enabling program and expands Labcorp's collaboration footprint in GLP studies.
- June 2025: Labcorp Drug Development (via collaboration with Predictive Oncology) developed functional 3D organoid models for human and rat liver toxicity, exclusively developed by Predictive Oncology. The capacity addition strengthens Labcorp's safety pharmacology offerings and reduces reliance on traditional animal models, boosting liver tox capabilities.
- February 2025: NAMSA finalized acquisition of WuXi AppTec’s US medical device testing operations. The consolidation expands NAMSA's GLP device testing footprint in the US and accelerates cross-domain CRO offerings.


Preclinical CRO Market Report Scope and Research Methodology
Market Definition and Coverage
For this report, the preclinical CRO market is defined as third party service revenue earned from outsourced preclinical research work that supports early drug development before human trials, including planning, execution, and reporting of regulated and nonregulated studies.
Scope exclusions: In-house preclinical lab work done fully within sponsor organizations and pure clinical phase CRO services are excluded from this market value.
Segments Covered in This Report
- By Service
- Toxicology Testing
- Bioanalysis & DMPK Studies
- Safety Pharmacology
- Other Services
- By Model Type
- Patient-Derived Organoid (PDO) Models
- Patient-Derived Xenograft (PDX) Models
- In-silico / AI-Driven Models
- By End User
- Biopharma & Pharma Companies
- Academic & Research Institutes
- Other End Users
- By Geography
- North America
- United States
- Canada
- Mexico
- Europe
- Germany
- United Kingdom
- France
- Italy
- Spain
- Rest of Europe
- Asia-Pacific
- China
- Japan
- India
- South Korea
- Australia
- Rest of Asia-Pacific
- Middle East & Africa
- GCC
- South Africa
- Rest of Middle East & Africa
- South America
- Brazil
- Argentina
- Rest of South America
- North America
Data Sources, Market Sizing, and Validation
Desk Research
Desk work started with building a fact base for demand drivers and the study pipeline that feeds preclinical outsourcing. We referenced public sources such as ClinicalTrials.gov and the WHO International Clinical Trials Registry Platform to understand trial activity signals upstream, and we also checked NIH and OECD releases for R&D spending context that can shift budgets over time.
To keep the model grounded in operating constraints, we reviewed regulatory and quality expectations from the US FDA and the European Medicines Agency, along with animal research oversight information from AAALAC International. Company annual reports, investor presentations, and reputable press coverage were then used to map service mixes and client commentary, supported by selective pulls from paid subscriptions for company financials, patent databases, and shipment-level trade signals where relevant. These are illustrative examples rather than a complete list, since we also relied on other public documents for data collection, cross-checking, and clarification.
Primary Interviews and Surveys
Primary work focused on validating what portion of preclinical activity is being outsourced, how pricing is changing by study type, and where capacity constraints show up first. We spoke with a mix of CRO-side leaders and operational managers, plus sponsor-side users across pharma, biotech, and medical device teams, which helped close gaps that public documents do not resolve.
For a global market like this, inputs were tested across major regions so assumptions reflected local regulation, study mix, and procurement behavior, not a single-country pattern.
Distribution of primary research fieldwork respondents
| Company type | Respondent position | Region |
|---|---|---|
| Top tier: 34% | CXOs: 12% | APAC: 46% |
| Mid tier: 45% | Functional/Unit leaders: 38% | EMEA: 35% |
| Smaller Players: 21% | Managers: 50% | Americas: 19% |
Market-Sizing & Forecasting
Sizing begins with a top-down build that reconstructs the addressable outsourced preclinical demand pool using drug development activity and sponsor spending signals, then translates that into serviceable revenue by applying outsourcing intensity and typical study cost patterns. Since preclinical work is not a single unit, we used a practical mix of indicators such as preclinical tox and safety study volumes, GLP inspection and compliance readiness requirements, the share of biologics programs (which shifts assay and model needs), average study duration that affects lab utilization, and regional R&D funding momentum.
Those totals were then corroborated with selective bottom-up approximations, mainly through sampled revenue logic by service bundles (for example, toxicology plus bioanalysis), channel checks on typical price bands, and sanity checks against publicly discussed capacity utilization and program starts. Where bottom-up visibility was incomplete, we used conservative ranges and then tightened them through expert re-contacts and cross-region comparisons.
For forecasting, scenario analysis was used to reflect different sponsor funding conditions and program continuation rates, followed by a smoothing step so the curve stays consistent with the observed outsourcing cycle. Final growth paths were reviewed with interviewees to confirm that assumptions on pricing progression, study mix shift, and regional demand are realistic for the forecast window.
Data Validation & Update Cycle
Validation is done through a set of checks that look for internal inconsistencies and real-world mismatches before results are finalized. Model outputs are compared against independent market signals such as sponsor R&D trends, pipeline activity markers, and reported outsourcing commentary, and then outliers are investigated until a clear reason is documented.
A multi-step analyst review follows so inputs, conversions, and assumptions are challenged from more than one angle, and re-contact triggers are used when a key variable moves outside the expected range. Reports are refreshed annually, with interim updates for material events that can shift budgets, pricing, or capacity, and a fresh pre-delivery pass is completed so clients receive the latest view.
Mordor Intelligence's Precilinical Cro Market Size Compared Against Other Published Estimates
Published market sizes for preclinical CRO services can vary a lot, even when the topic name looks the same. The differences usually come from what is counted as preclinical work, how multi-service contracts are treated, and whether pricing is assumed to rise steadily or move in steps.
Demand signals such as upstream trial pipeline activity, sponsor R&D spending direction, and compliance-driven study requirements are the evidence checks that keep Mordor Intelligence's estimate tied to outsourced preclinical service revenue, rather than broader drug development services. Another common gap is scope, where some publications blend in adjacent clinical CRO revenues or include internal sponsor lab activity, and a second gap is base-year normalization, where different currency timing and inflation handling can shift the stated starting point.
Benchmark comparison
| Source | Market Size | Gaps in Research Methodology |
|---|---|---|
| Mordor Intelligence | USD 8.20 B (2026) | |
| Global Consultancy A | USD 14.55 B (2026) | Often reflects a broader service boundary that can roll up more upstream discovery support and adjacent development services, and may apply higher blended pricing across service bundles without the same level of cross-checking against outsourcing intensity. |
| Trade Journal B | USD 6.84 B (2026) | Frequently uses a narrower revenue capture that can miss smaller contract work and non-GLP activity, and it may lean on a single growth track from a short base period which can understate step changes in outsourcing and price revisions. |
The spread in the table is mainly explained by how tightly the service boundary is drawn, and by how pricing and outsourcing intensity are converted into revenue by year. By keeping assumptions traceable to observable demand indicators and stress-testing them through interviews, the final number stays practical to replicate and easier to defend in planning discussions across regions and study types.


Key Questions Answered in the Report
What is the projected value of the preclinical CRO market in 2031?
The preclinical CRO market is forecast to reach USD 11.74 billion by 2031 based on a 7.45% CAGR.
Which service category is growing fastest in outsourced preclinical studies?
Safety pharmacology leads growth, advancing at a 12.25% CAGR due to heightened cardiovascular liability scrutiny.
Why are patient-derived organoids gaining traction over PDX models?
PDOs offer 78% predictive accuracy, deliver results in eight weeks, and cost less than PDX studies, enabling faster go-no-go decisions.
How are regulatory changes influencing CRO demand in Asia-Pacific?
China's duty-free animal import policy and India's ICH alignment cut costs and approval timelines, driving a 10.81% regional CAGR.
What role does AI play in modern preclinical CRO services?
AI improves candidate screening, optimizes dose escalation, reduces animal use, and supports PBPK simulations that regulators increasingly accept.
Page last updated on:


 Your data is secure and never sold or shared.


