Polyvinyl Alcohol Market Size and Share
Market Overview
| Study Period | 2021 - 2031 |
|---|---|
| Market Volume (2026) | 1.46 Million tons |
| Market Volume (2031) | 1.67 Million tons |
| Growth Rate (2026 - 2031) | 2.72% CAGR |
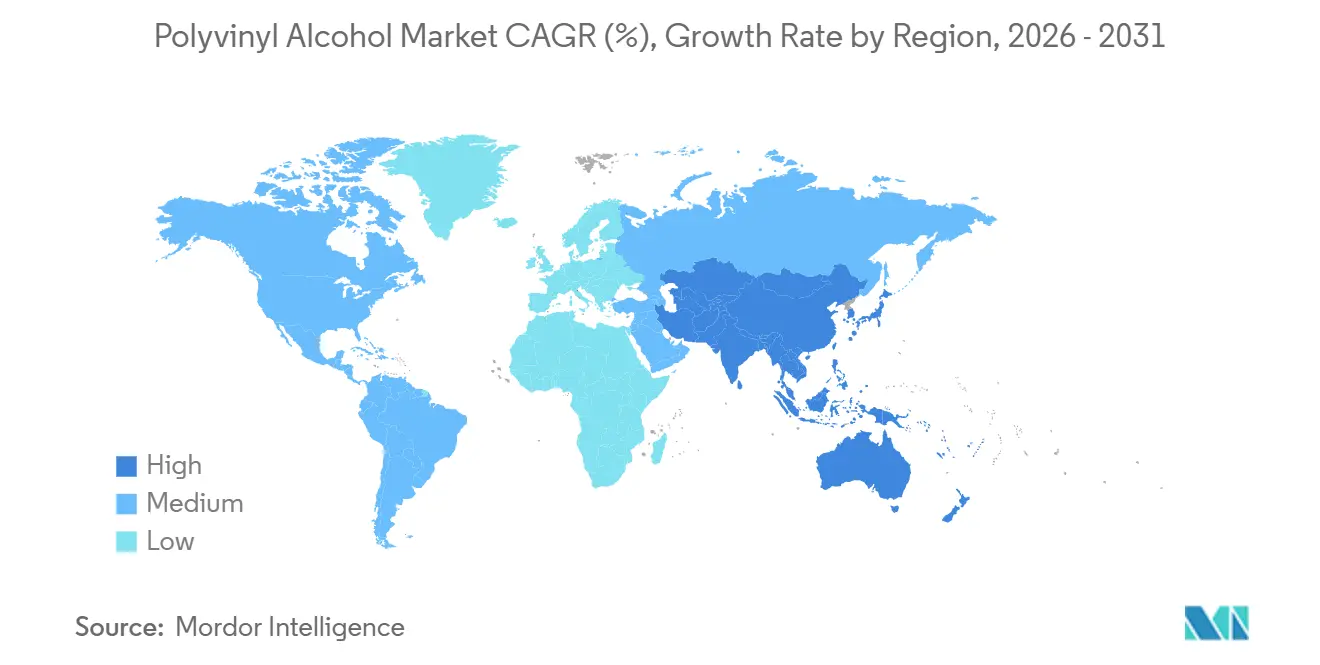
| Fastest Growing Market | Asia Pacific |
| Largest Market | Asia Pacific |
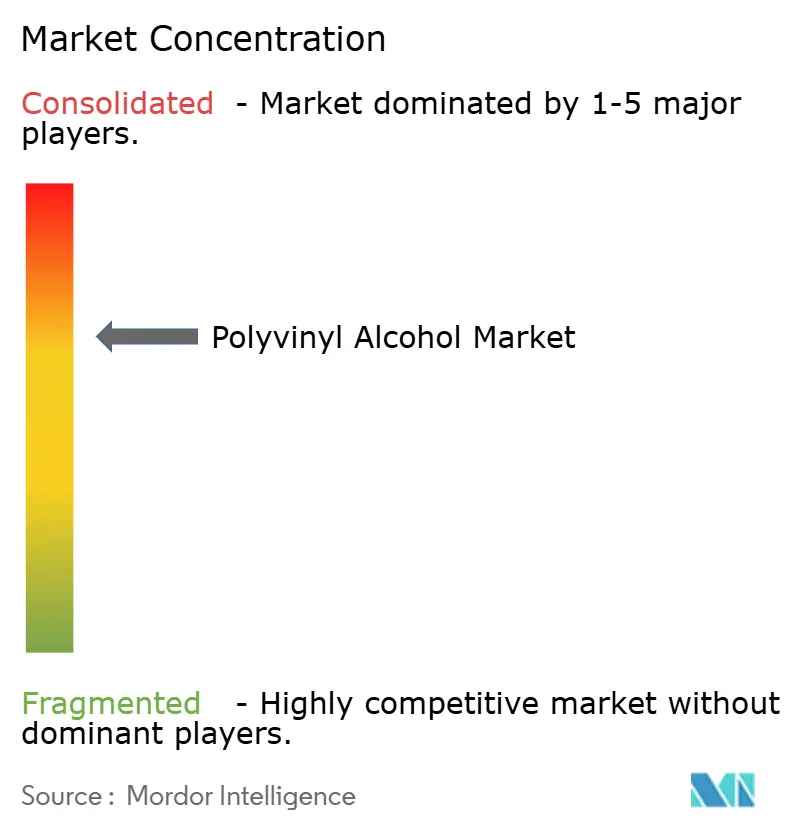
| Market Concentration | Medium |
Major Players *Disclaimer: Major Players sorted in no particular order Image © Mordor Intelligence. Reuse requires attribution under CC BY 4.0. | |

Polyvinyl Alcohol Market Analysis by Mordor Intelligence
The Polyvinyl Alcohol Market size is projected to expand from 1.42 million tons in 2025 and 1.46 million tons in 2026 to 1.67 million tons by 2031, registering a CAGR of 2.72% between 2026 to 2031. Current demand is anchored in food-contact films, construction sealants, and detergent pods, while feedstock-price swings moderate headline growth. Brand owners in North America and Europe reward biodegradable film innovations, whereas Asia-Pacific benefits from integrated coal-to-acetylene production routes that compress costs. Emerging uses in drug-eluting stents, 3D-bioprinting, and seed coatings widen the application canvas and support value-added pricing. Competitive strategies revolve around capacity additions for specialty grades, vertical integration to hedge vinyl-acetate-monomer volatility, and patent activity targeting hybrid PVA-cellulose composites.
Key Report Takeaways
- By grade, partially hydrolyzed captured 37.51% of the polyvinyl alcohol market share in 2025, advancing at a 3.01% CAGR through 2031.
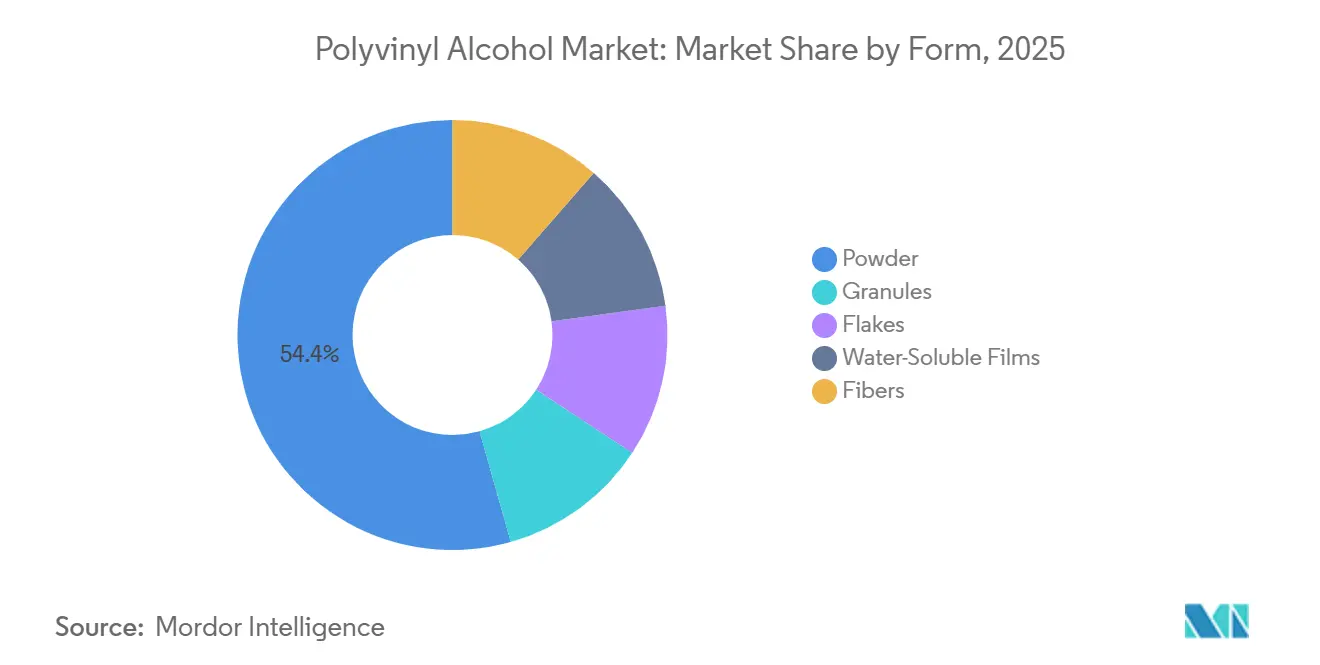
- By form, powder held 54.36% of 2025 volume, while water-soluble films recorded the fastest forecast pace at 3.41% CAGR through 2031.
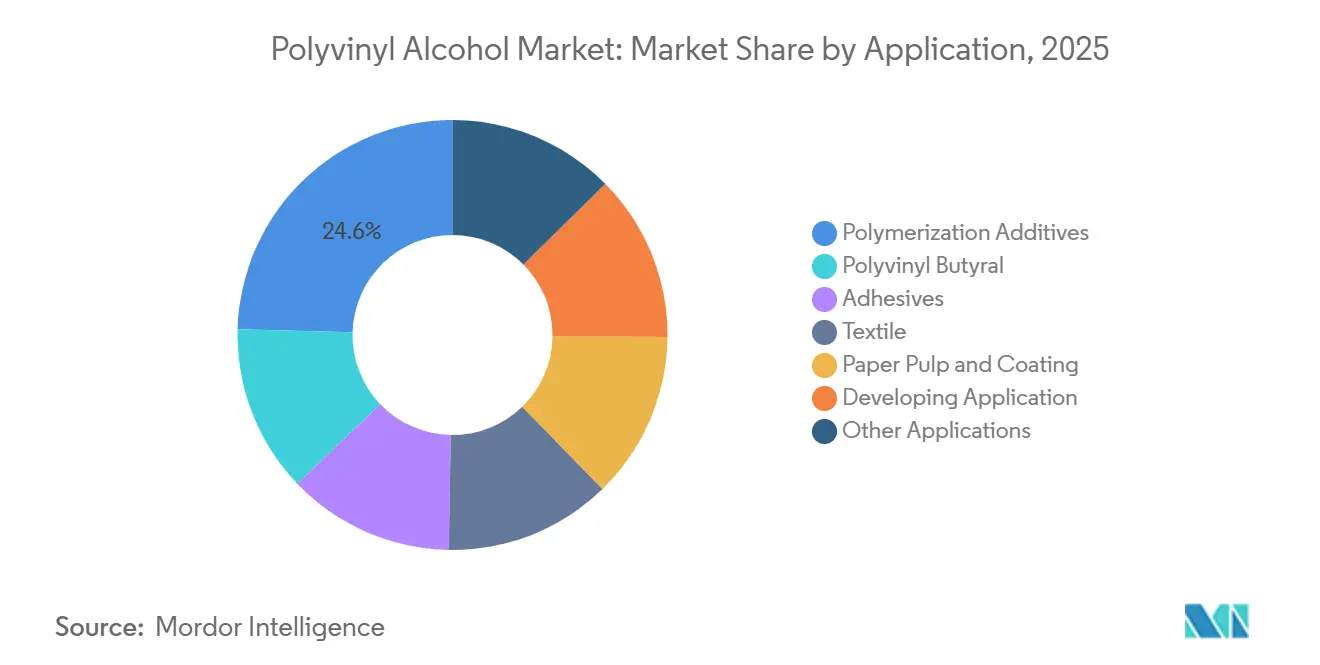
- By application, polymerization additives led with 24.58% in 2025, while the developing application is projected to expand at a 4.52% CAGR to 2031.
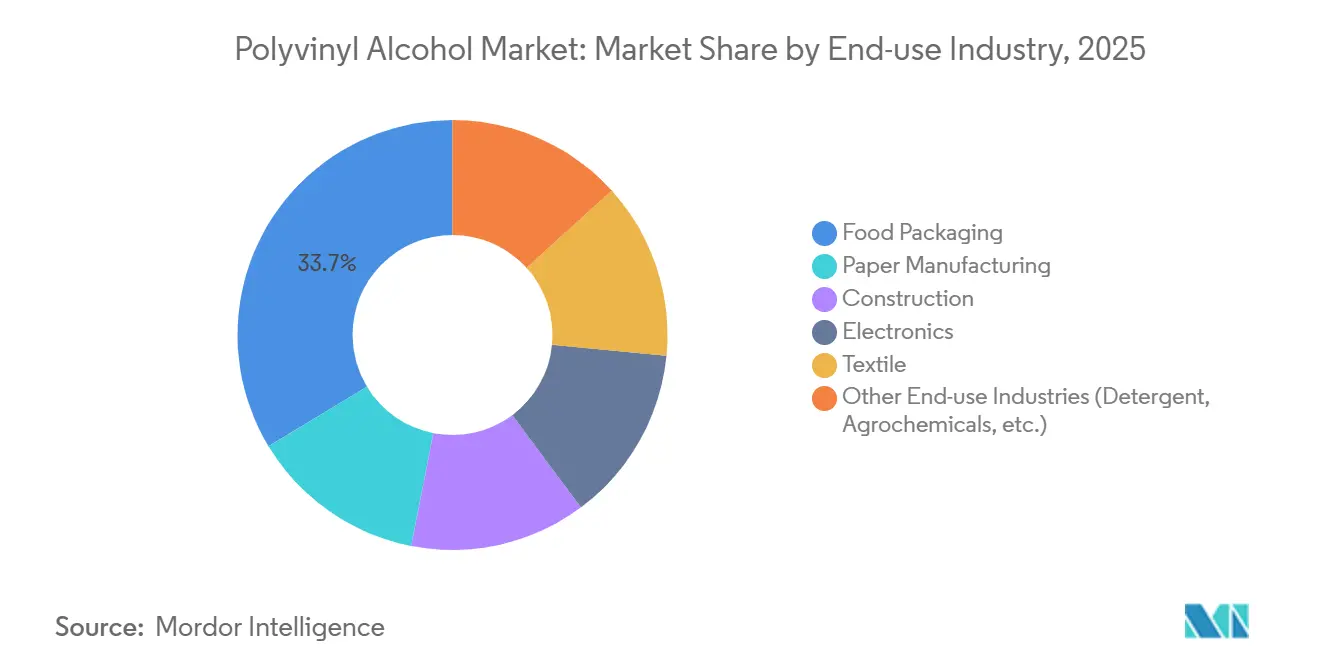
- By end-use industry, food packaging led with 33.67% contribution in 2025 and is projected to expand at 3.04% CAGR to 2031.
- By geography, Asia-Pacific dominated with 47.72% volume in 2025 and is set to grow at a 2.92% CAGR through 2031.
Note: Market size and forecast figures in this report are generated using Mordor Intelligence’s proprietary estimation framework, updated with the latest available data and insights as of January 2026.
Global Polyvinyl Alcohol Market Trends and Insights
Drivers Impact Analysis*
| Driver | (~) % Impact on CAGR Forecast | Geographic Relevance | Impact Timeline |
|---|---|---|---|
| Growing Demand from Food-Packaging Industry | +0.8% | Global, with concentration in North America, EU, and APAC urban centers | Medium term (2-4 years) |
| Increasing Usage in Construction Sealants and Mortar | +0.5% | APAC core (China, India), spill-over to Middle East infrastructure projects | Long term (≥ 4 years) |
| Surging Adoption in Detergent Pods and Water-Soluble Films | +0.7% | North America and EU, emerging in Latin America | Short term (≤ 2 years) |
| Expansion of PVA-Based Emulsion Polymers for Water-Borne Coatings | +0.4% | Global, regulatory-driven in EU and California | Medium term (2-4 years) |
| Emergence of PVA-Based Biodegradable Agricultural Films | +0.3% | APAC (India, Vietnam, Thailand), pilot programs in Mediterranean EU | Long term (≥ 4 years) |
| Source: Mordor Intelligence | |||
Growing Demand from Food-Packaging Industry
Single-serve convenience formats reshaped purchasing choices. Dishwasher-tablet wraps, coffee pods, and sauce sachets jointly held 33.67% of end-use volume in 2025. Updated U.S. FDA food-contact protocols in 2024 fast-tracked approvals for PVA films with antimicrobial nanoparticles, lifting agency submissions by 22% in 2025. Japan’s health ministry halved approval lead times, spurring domestic uptake in bento-box liners and noodle-packet films [1]Ministry of Health, Labour and Welfare Japan, “Packaging Film Approval Streamlining,” mhlw.go.jp . German and Dutch grocers reported a 12-15% consumer premium for dissolve-in-sink packaging, validating price-elastic demand.
Increasing Usage in Construction Sealants and Mortar
Partially hydrolyzed PVA improves rheology and crack resistance in tile adhesives and self-leveling compounds. China’s 2024 low-VOC mandate for public infrastructure lifted construction-grade PVA offtake 9% in 2025. India’s affordable-housing drive adopted PVA fibers to cut rebar costs, while Middle Eastern mega-projects specified PVA-modified sealants able to absorb daily thermal swings from 50 °C to 15 °C.
Surging Adoption in Detergent Pods and Water-Soluble Films
Water-soluble PVA films enable pre-measured doses that avoid overdosing. Procter & Gamble disclosed a 34% U.S. share for Tide Pods in 2025 and is piloting similar films for softeners. Europe’s 2025 Packaging Waste Regulation exempts compliant PVA films from producer fees, saving EUR 120 million annually for early adopters. Unilever converted 40% of its European detergents portfolio, removing 2,800 tons of plastic waste.
Expansion of PVA-Based Emulsion Polymers for Water-Borne Coatings
Tighter VOC caps forced paint makers toward water-borne latexes. California’s South Coast AQMD halved VOC limits in 2024; formulators compensated by raising PVA solids to maintain film integrity. The EU Industrial Emissions update in 2025 drove PPG and Axalta to debut low-foaming PVA basecoats for automotive refinish lines.
Restraints Impact Analysis*
| Restraint | (~) % Impact on CAGR Forecast | Geographic Relevance | Impact Timeline |
|---|---|---|---|
| Volatile Vinyl-Acetate-Monomer (VAM) Prices Squeezing Margins | -0.6% | Global, acute in regions without integrated VAM-PVA production (Europe, North America) | Short term (≤ 2 years) |
| Availability of Bio-Based and Petro-Based Substitutes (PLA, EVOH) | -0.4% | EU and North America, brand-driven in premium packaging | Medium term (2-4 years) |
| Limited Recycling Infrastructure for PVA Films in Emerging Economies | -0.2% | Southeast Asia, sub-Saharan Africa, rural Latin America | Long term (≥ 4 years) |
| Source: Mordor Intelligence | |||
Volatile Vinyl-Acetate-Monomer Prices Squeezing Margins
Spot VAM swung 18% in 2025, narrowing non-integrated producers’ gross margins by 12-15% and prompting temporary shutdowns. Integrated Chinese firms enjoyed a USD 180 per-ton cost edge, boosting exports 23%.
Availability of Bio-Based and Petro-Based Substitutes (PLA, EVOH)
Retailers mandate bio-content thresholds that favor PLA, while EVOH outperforms on oxygen-barrier metrics. Kuraray’s EVAL holds 40% share in barrier films, yet PVA keeps an edge in water-soluble and cold-water roles.
*Our forecasts treat driver/restraint impacts as directional, not additive. The impact forecasts reflect baseline growth, mix effects, and variable interactions.
Segment Analysis
By Grade: Hydrolysis Levels Dictate Solubility Profiles
Partially hydrolyzed captured 37.51% of 2025 volume, expanding at 3.01% through 2031 as textile mills favored its dual cold- and hot-water solubility. Fully hydrolyzed variants underpin detergent-pod films; Kuraray’s POVAL 205 with 98.5% hydrolysis became the reference grade in 2025. Specialty innovations include super-low-foaming types for high-speed inkjet coating and thermally reversible gels for reusable cold packs. Collectively, advanced grades increase average selling prices and stabilize margins.
Manufacturers tailor viscosity, molecular weight, and functional groups. Mitsubishi Chemical launched a PVA with surface tension of 28 dynes/cm in 2025 for defect-free optical-film coating. Sekisui’s thermally reversible gels liquefy above 60 °C then resolidify, finding new use in data-center thermal buffers. These developments maintain customer lock-in and underpin the polyvinyl alcohol market’s shift toward value-added niches.


By Form: Water-Soluble Films Outpace Traditional Formats
Powder retained 54.36% share in 2025, driven by on-site dissolution needs in adhesives and textiles. Water-soluble films, however, will post a 3.41% CAGR to 2031 as pod and agrochemical-sachet demand widens. Japan VAM & Poval’s 2025 tri-layer film dissolved 30% faster in cold water, cutting cycle times for detergent plants. Granules serve dust-free construction job sites, while fibers reinforce concrete and asphalt; Kuraray’s Kuralon fiber replaced steel in Japan’s maglev tunnel shotcrete, lowering weight 40%.
Film producers manage plasticizer ratios for balance between tensile strength and dissolution. Flake forms, produced via drum drying, cater to automated dosing in paper mills. Physical format choice therefore dictates reachable applications and pricing power within the polyvinyl alcohol market.
By Application: Developing Segments Offer Highest Growth
Developing Application will grow at 4.52%, the highest among segments. Abbott’s PVA-coated coronary stent achieved 94% 12-month patency in 2025 trials. Organovo sourced ultra-pure PVA for sacrificial bioprint supports that dissolve post-processing, freeing delicate tissue scaffolds. Polymerization additives, 24.58% share in 2025, continue to stabilize vinyl-acetate emulsions essential in low-VOC paints.
Polyvinyl butyral interlayers in laminated glass consume moderate demand; automotive lightweighting sustains demand. Adhesives and textile sizing face slower growth due to digitalization and synthetic-fiber penetration, yet they remain volume mainstays. The application mix underscores the polyvinyl alcohol market’s resilience through diversification.
By End-use Industry: Food Packaging Leads Volume and Growth
Food packaging led with 33.67% of volume in 2025, advancing at 3.04% to 2031. Finish brand’s PVA-wrapped dishwasher tablet gained substantial European share within six months. Keurig’s compostable coffee pod pilot registered 95% consumer acceptance. Construction captured moderate demand, driven by Asia-Pacific infrastructure, while electronics tied to display-panel output. Other end-use industries including agrochemicals and detergents filled the rest.
The diverse end-use footprint buffers cyclical swings; regulatory tailwinds in packaging and construction offset maturing segments in paper and textiles, sustaining the polyvinyl alcohol market trajectory.
Geography Analysis
Asia-Pacific dominated with 47.72% volume in 2025 and is forecast to expand at 2.92% CAGR. China’s 850,000-ton integrated capacity enjoys USD 180/t cost advantages vs. ethylene routes, allowing aggressive commodity pricing. India’s 2025 offtake jumped due to housing construction and textile sizing. Japan exported high-viscosity grades for optical films. Southeast Asia posted detergent-pod demand growth as multinationals localized production.
In North America, streamlined FDA clearances accelerated film approvals, and Procter & Gamble’s pod shift added demand. Canada piloted PVA seed coatings with 10% germination uplift in saline soils. Mexico enjoyed moderate growth in PVA-modified mortars tied to near-shoring construction.
Europe is prioritizing biodegradable films under its 2025 waste regulation, driving import growth from Japan[2]European Commission, “Extended Producer Responsibility Exemptions,” europa.eu. South America and the Middle East and Africa commanded demand as infrastructure and agricultural trials multiply. Petrobras tested PVA drilling-fluid additives, while Saudi Arabia’s NEOM project specified PVA sealants for glass façades, underscoring emerging regional niches.

Competitive Landscape
Top five producers - Kuraray, SEKISUI CHEMICAL CO., LTD., Anhui Wanwei, Sinopec Sichuan Vinylon, Chang Chun - control roughly 72% of capacity, evidencing moderate concentration. Kuraray’s 2025 patent for PVA-cellulose nanocrystal composites lifts tensile strength 40% without losing solubility, targeting rigid packaging that PET currently owns. Mitsubishi Chemical’s captive VAM integration buffered earnings amid 2025 feedstock spikes.
Chinese entrants leverage coal-acetylene integration to win price-sensitive adhesive and textile deals. Dow’s 2025 Vietnamese circular-recycling venture demonstrates cost-saving hydrolysis for film waste. Specialty suppliers such as Polysciences serve high-purity niches at USD 180/kg, capturing healthcare customers where batch consistency is critical.
Technology bifurcation is visible: leaders adopt continuous reactors that cut energy 15%, while laggards still run batch lines. ISO 50001 certifications increasingly sway multinationals’ procurement. Overall, premium margins accrue to integrated or specialty-grade innovators, while commoditized supply faces persistent pressure across the polyvinyl alcohol market.
Polyvinyl Alcohol Industry Leaders
SEKISUI CHEMICAL CO., LTD.
KURARAY CO., LTD.
Chang Chun Group
Anhui Wanwei Updated High Tech Material Industry Co Ltd
Sinopec Sichuan Vinylon Works
- *Disclaimer: Major Players sorted in no particular order

Recent Industry Developments
- April 2025: Mitsubishi Chemical Group Corporation obtained ISCC PLUS certification for its polyvinyl alcohol products manufactured at the Okayama plant. This certification ensured the proper management of recycled and biomass raw materials throughout the supply chain, including the manufacturing process.
- January 2025: Researchers at NITK, India, developed a pH-sensitive hydrogel designed for treating slow-healing wounds. The hydrogel, composed of poly-aspartic acid, polyvinyl alcohol, and sole fish collagen, was crosslinked and infused with silver nanowires. It exhibited a pH-responsive swelling ratio, ranging from 731% at pH 3 to 1,405% at pH 10.


Research Methodology Framework and Report Scope
Market Definitions and Key Coverage
Our study treats the polyvinyl alcohol market as the traded supply of new, industrial-grade PVA resin, fully, partially, and sub-partially hydrolyzed, sold in powder, granule, or film form to converters and formulators across packaging, construction, textile, adhesive, paper, and electronic applications. Demand created by in-house captive production is not included, which keeps double counting out of the baseline.
Scope exclusion: specialty blends where PVA is only a minor additive (≤5 % by weight) are kept outside the sizing.
Segmentation Overview
- By Grade
- Partially Hydrolyzed
- Fully Hydrolyzed
- Sub-Partially Hydrolyzed
- Low-Foaming Grades
- Other Grades (Tactified Grades, Fine Particle Grades)
- By Form
- Powder
- Granules
- Flakes
- Water-Soluble Films
- Fibers
- By Application
- Polymerization Additives
- Polyvinyl Butyral
- Adhesives
- Textile
- Paper Pulp and Coating
- Developing Application
- Other Applications
- By End-use Industry
- Food Packaging
- Paper Manufacturing
- Construction
- Electronics
- Textile
- Other End-use Industries (Detergent, Agrochemicals, etc.)
- By Geography
- Asia-Pacific
- China
- India
- Japan
- South Korea
- Malaysia
- Thailand
- Indonesia
- Vietnam
- Rest of Asia-Pacific
- North America
- United States
- Canada
- Mexico
- Europe
- Germany
- United Kingdom
- Italy
- France
- Spain
- NORDIC Countries
- Rest of Europe
- South America
- Brazil
- Argentina
- Colombia
- Rest of South America
- Middle-East and Africa
- Saudi Arabia
- Qatar
- United Arab Emirates
- Egypt
- South Africa
- Rest of Middle-East and Africa
- Asia-Pacific
Detailed Research Methodology and Data Validation
Primary Research
Mordor analysts interviewed sales managers at resin makers, procurement leads at detergent-pod converters, Asian export brokers, and packaging regulators across North America, Europe, and ASEAN. Their perspectives validated trade statistics, refined average selling prices, and aligned assumption ranges on detergent-pod penetration and VAM cost pass-through.
Desk Research
We began with harmonized statistics from tier-1 outlets such as UN Comtrade (trade flows), FAOSTAT (food packaging drivers), Eurostat Industrial Production, and US GS construction put-in-place series. Trade association portals, including the Japan Poval Industry Association and American Chemistry Council, offered resin grade splits, while patent libraries on Questel illustrated emerging film chemistries. Company 10-Ks, investor decks, and curated news via Dow Jones Factiva supplied capacity changes and price-revision clues. These sources form the factual spine; yet they are illustrative only and far from exhaustive, as many more references informed our evidence set.
Market-Sizing & Forecasting
A top-down construct converts national import-export-production balances into apparent demand, which is then pressure tested with selective bottom-up checks, sampled supplier roll-ups and channel ASP × volume screens, to fine-tune totals. Key variables include vinyl acetate monomer price swings, food-grade packaging film output, textile warp-sizing yardage, detergent-pod unit shipments, construction polymer additive consumption, and regional disposable income indices; each feeds a multivariate regression that projects consumption to 2030. Where supplier splits were incomplete, we bridged gaps with weighted regional per-capita usage benchmarks and confirmed them in follow-up calls.
Data Validation & Update Cycle
Outputs run through variance filters versus historical ratios and independent indicators before senior review. We refresh every twelve months and trigger interim updates if feedstock spikes, major capacity additions, or regulatory shifts move the market; a last-minute sweep ensures clients receive the freshest view.
Why Our Polyvinyl Alcohol Baseline Earns Trust
Published numbers rarely match because firms choose different functional scopes, metrics, and refresh cadences. According to Mordor Intelligence, our disciplined selection of variables, annual audits, and clear separation of captive versus merchant volumes deliver a dependable anchor.
Key gap drivers stem from others valuing sales in dollars while we ground the core year in physical demand (1.42 million tons, 2025), differences in how detergent film revenues are bundled, and varying assumptions on VAM cost escalation and currency conversion timing.
Benchmark comparison
| Market Size | Anonymized source | Primary gap driver |
|---|---|---|
| 1.42 million tons (2025) | Mordor Intelligence | |
| USD 3.7 billion (2023) | Global Consultancy A | mixes captive use, applies uniform ASP uplift, three-year update cycle |
| USD 0.99 billion (2023) | Regional Consultancy A | excludes construction additives, converts at constant 2022 FX, limited primary validation |
| USD 1.32 billion (2024) | Trade Journal B | bundles PVA films and blends, projects with single macro variable, scope caps small-volume regions |
In short, the balanced, transparent path we follow, rooted in traceable datasets and live expert feedback, gives decision-makers a baseline they can reproduce, question, and confidently apply.


Key Questions Answered in the Report
How large is the polyvinyl alcohol market in 2026?
The polyvinyl alcohol market size reached 1.46 million tons in 2026 and is forecast to reach 1.67 million tons by 2031.
Which region leads global demand?
Asia-Pacific commands 47.72% of volume in 2025 thanks to China’s integrated production corridors and Japan’s specialty-grade exports.
What is the fastest-growing application for PVA?
Developing Application advances at 4.52% CAGR through 2031 on the back of stents, bioprinting, and binder roles.
How are feedstock swings influencing margins?
Vinyl-acetate-monomer prices moved 18% in 2025, compressing non-integrated producers’ margins by up to 15%, while integrated players stayed insulated.
Page last updated on:


