Polyurea Market Size and Share
Market Overview
| Study Period | 2021 - 2031 |
|---|---|
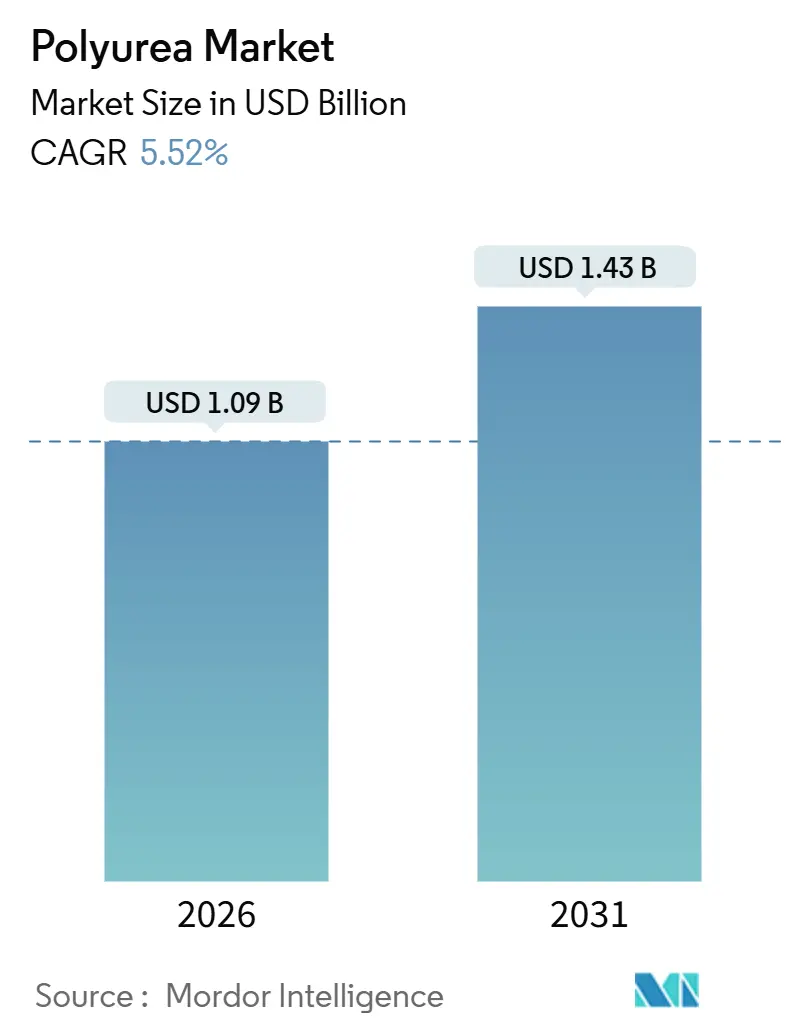
| Market Size (2026) | USD 1.09 Billion |
| Market Size (2031) | USD 1.43 Billion |
| Growth Rate (2026 - 2031) | 5.52% CAGR |
| Fastest Growing Market | Asia Pacific |
| Largest Market | North America |
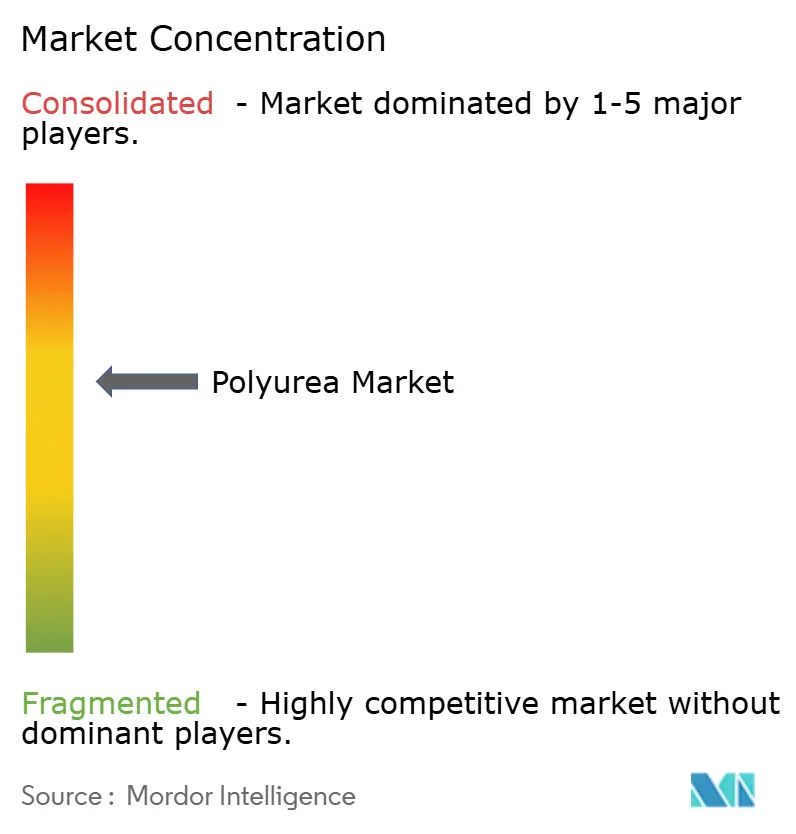
| Market Concentration | Medium |
Major Players *Disclaimer: Major Players sorted in no particular order Image © Mordor Intelligence. Reuse requires attribution under CC BY 4.0. | |
Polyurea Market Analysis by Mordor Intelligence
The Polyurea Market size is estimated at USD 1.09 billion in 2026, and is expected to reach USD 1.43 billion by 2031, at a CAGR of 5.52% during the forecast period (2026-2031). The polyurea market is gaining momentum because asset owners now value rapid return-to-service more than lowest upfront cost, a shift that favors sub-second-gel polyurea over epoxy and traditional polyurethane systems. Oil and gas midstream operators are channeling refurbishment budgets toward corrosion-control programs as pipelines installed during the 1970s and 1980s approach end-of-design life. Automotive OEMs are adding polyurea to electric-vehicle battery packs to block thermal-runaway propagation and moisture ingress, while infrastructure owners specify the technology to keep bridges, water-treatment assets, and metro corridors in service during rehabilitation. Supply-side initiatives such as BASF’s 2025 capacity expansion in China and PPG’s roll-out of energy-curable backers confirm that producers view the polyurea market as a structurally growing space poised to replace slower-curing chemistries.
Key Report Takeaways
- By chemical structure, aromatic polyurea captured 66.89% polyurea market share in 2025 and aliphatic polyurea is forecast to progress at a 6.12% CAGR through 2031.
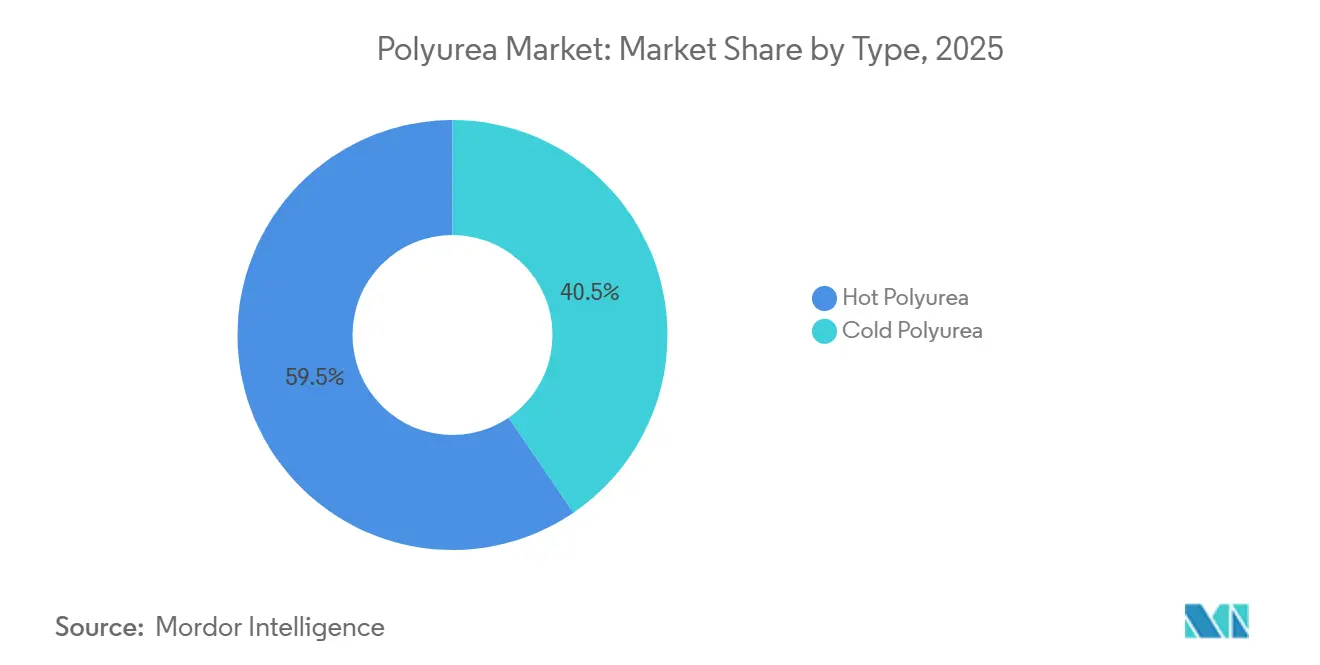
- By type, hot polyurea controlled 59.51% of the polyurea market size in 2025, while cold systems are advancing at a 6.67% CAGR to 2031.
- By product form, coatings led with 64.71% of the polyurea market size in 2025; sealants are the fastest-growing form at 7.12% CAGR.
- By end-use industry, construction dominated with 40.32% of 2025 revenue and energy and power is on track for a 7.21% CAGR through 2031.
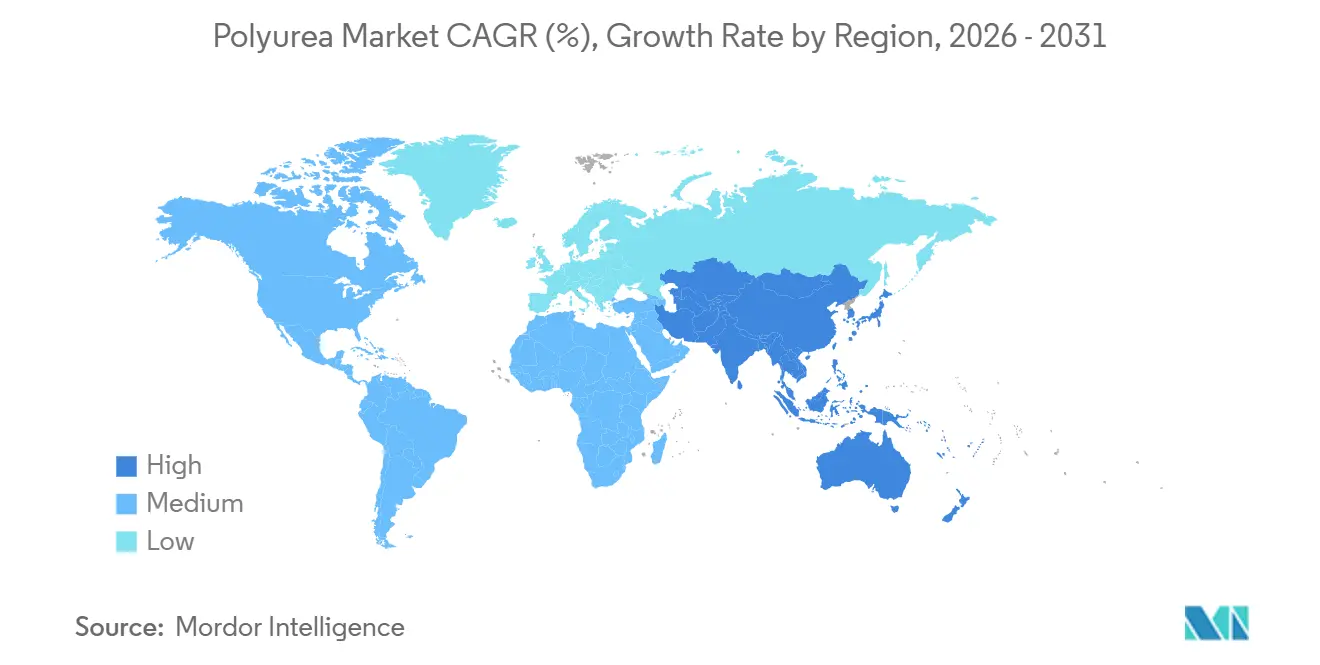
- By geography, North America accounted for 40.92% of the 2025 value, whereas the Asia-Pacific is expanding at a 7.93% CAGR through 2031.
Note: Market size and forecast figures in this report are generated using Mordor Intelligence’s proprietary estimation framework, updated with the latest available data and insights as of January 2026.
Global Polyurea Market Trends and Insights
Driver Impact Analysis*
| Drivers | (~) % Impact on CAGR Forecast | Geographic Relevance | Impact Timeline |
|---|---|---|---|
| Growing demand from infrastructure rehabilitation | +1.2% | North America, Europe, Asia-Pacific | Medium term (2-4 years) |
| Surge in corrosion-control spending by oil and gas midstream operators | +0.9% | North America, Middle East, Asia-Pacific | Medium term (2-4 years) |
| Rapid adoption in EV battery-pack protection | +1.4% | Asia-Pacific, Europe, North America | Short term (≤ 2 years) |
| Mainstream shift from epoxy/polyurethane to fast-return polyurea coatings | +1.1% | Global | Medium term (2-4 years) |
| Regulatory push for VOC-free protective coatings | +0.7% | North America, Europe | Long term (≥ 4 years) |
| Source: Mordor Intelligence | |||
Growing Demand from Infrastructure Rehabilitation
Aging civil infrastructure drives owners to polyurea because projects can reopen within hours, not days. Dubai’s 2025 Hatta Dam pipeline restoration lined 24 kilometers of tunnels with polyurea and maintained service continuity. Thames Water in the United Kingdom used chemistry to waterproof valve chambers in dense urban corridors and limit excavations.[1]Teknos, “Case Study: Hatta Dam Pipeline Rehabilitation,” teknos.com The United States still faces a USD 2.6 trillion funding gap for bridges, culverts, and tunnels; polyurea extends asset life by two to three decades without lane closures, reducing indirect costs that often exceed material premiums threefold. The formulation’s tolerance for damp surfaces and low-temperature cures widens the seasonal work window, which is critical in cold-climate markets. As cities earmark stimulus funds for fast-track bridge deck overlays, polyurea is positioned as the only membrane that meets overnight-reopening requirements.
Surge in Corrosion-Control Spending by Oil and Gas Midstream Operators
Midstream pipeline networks installed between 1970 and 1985 are reaching critical maintenance thresholds. Polyurea membranes eliminate pinholes and prevent cathodic disbondment more reliably than fusion-bonded epoxy wraps, especially on girth welds and complex geometries. TIB Chemicals’ PROTEGOL polyurethane pipeline coatings demonstrated field success on North American retrofits and underscored polyurea’s chemical compatibility with sour gas. Operators now bundle inline inspection, grit blasting, and polyurea over-sprays into single mobilizations to reduce downtime. API 1169 inspection standards increasingly reference seamless membranes for external protection, a wording that implicitly favors polyurea systems. Because polyurea cures within seconds at ambient pipe temperature, crews can backfill trenches on the same shift, cutting restoration expenses by 20% relative to epoxy.
Rapid Adoption in EV Battery-Pack Protection
Electric-vehicle assembly plants have integrated polyurea into battery enclosures to meet flammability and impact-absorption targets without extending cycle time. Huntsman’s POLYRESYST S4010C, launched in February 2025, meets UL 94 V-0 and adds less than five minutes to takt. Covestro’s Baydur PUL 4201 enables sub-5-minute demolding cycles and bonds to aluminum, composite, or thermoplastic housings with no primer. OEMs report 10% weight savings versus steel skid plates, while elongation surpasses 250%, which improves drop-test performance. As global EV production targets 30 million units by 2030, battery manufacturers view polyurea as a low-cost insurance policy against warranty claims linked to coolant leaks or thermal events. Government safety agencies in China, Korea, and the European Union are drafting protocols that will formalize such protective measures, further institutionalizing demand.
Mainstream Shift from Epoxy/Polyurethane to Fast-Return Polyurea Coatings
Manufacturing plants frequently shut down production areas for less than one shift when recoating surfaces. Polyurea floors accept foot traffic within one hour and vehicular loads inside four hours, compressing shutdown windows by up to 90%. Food processors, pharmaceutical cleanrooms, and semiconductor fabs—where downtime costs can top USD 150,000 per hour—recoup polyurea’s 20-30% material premium in a single maintenance event. The chemistry cures at 95% relative humidity and sub-freezing temperatures, mitigating expensive dehumidification. Contractors also cite lower odor and zero-VOC benefits, enabling adjacent line operations to continue. Consequently, construction end-users, who already account for 40.32% of polyurea market demand, are substituting epoxy with polyurea for parking decks, cold-storage floors, and secondary containment basins.
Restraint Impact Analysis*
| Restraints | (~) % Impact on CAGR Forecast | Geographic Relevance | Impact Timeline |
|---|---|---|---|
| Volatility in isocyanate and amine feedstock prices | -0.8% | Global | Short term (≤ 2 years) |
| Short pot-life raises applicator skill and equipment cost | -0.5% | Global | Medium term (2-4 years) |
| Emerging PFAS-like substance bans impacting certain chain extenders | -0.3% | North America, Europe | Long term (≥ 4 years) |
| Source: Mordor Intelligence | |||
Volatility in Isocyanate and Amine Feedstock Prices
BASF announced a USD 0.10/lb price hike for North America in July 2024 to offset inflation and logistics pressures[2]BASF, “North America Polyurethane Systems Price Adjustment,” basf.com. Smaller formulators without integrated feedstock assets either pass costs to customers or forfeit margin, slowing adoption in residential waterproofing, where acrylic membranes remain stable. Contracting firms ask for 60-day price holds that many suppliers cannot honor, complicating tender processes. Volatility has also squeezed working capital because contractors must pre-buy raw materials to lock pricing, tying up cash on the application side as well.
Short Pot-Life Raises Applicator Skill and Equipment Cost
Two-component polyurea gels in 5-15 seconds, so plural-component rigs operate at 2,000 psi and cost USD 15,000-50,000. Poor mixing produces pinholes or delamination, incurring expensive rework. Rhino Linings, Nukote, and SPI Coatings conduct certification courses, but Southeast Asia and Latin America still lack an applicator base. Cold-pour variants extend pot life to 10-20 minutes yet give up seamless finish and shore hardness. Emerging markets with low wage rates accept longer cures from epoxy, slowing polyurea penetration. Equipment financiers offer leasing solutions, but interest rates above 9% in several developing countries deter uptake.
*Our forecasts treat driver/restraint impacts as directional, not additive. The impact forecasts reflect baseline growth, mix effects, and variable interactions.
Segment Analysis
By Chemical Structure: Aromatic Dominance with Aliphatic Gaining UV-Stable Applications
Aromatic grades delivered 66.89% polyurea market share in 2025 and benefitted from raw-material savings of 20-30% versus aliphatic analogs. Aromatic formulations line tanks, secondary containments, and buried concrete because UV exposure is limited. Their lower cost keeps total installed pricing competitive, which is essential for large-surface municipal projects in North America and Europe. However, ultraviolet light yellows and chalks aromatics, so asset owners must overspray topcoats or accept aesthetic degradation on facades.
Aliphatic polyurea is growing at a 6.12% CAGR thanks to parking decks, bridges, and external building skins that require color stability. PPG’s July 2024 DuraNEXT launch added UV-curable clearcoats that maintain gloss on coil-coated metal, confirming demand for exterior-grade clusters. Hybrid aromatic-aliphatic blends deliver adequate color retention at a 10-15% cost premium, offering a middle path for bridge owners who want a decade-long repaint window. Cost declines for aliphatic isocyanates are projected as new Asian capacity comes online, gradually narrowing the price gap that underpins aromatic leadership.
By Type: Hot Spray Systems Lead, Cold Pour Expands in Niche Segments
Hot polyurea systems held 59.51% of the polyurea market size in 2025 because high-pressure rigs can apply more than 1,000 ft² per hour with seamless results. Offshore wind blade erosion shields, bridge-deck membranes, and bulk tank linings specify hot-spray because membrane cohesion must be absolute. Component temperatures run at 65-75 °C to cut viscosity and atomize heavy pre-polymers that deliver tensile strengths above 25 MPa.
Cold-pour systems are posting a 6.67% CAGR on the promise of ease of use. Contractors without plural-component equipment can hand-trowel or low-pressure-spray EV battery packs, secondary containments, or HVAC ducts. Huntsman’s POLYRESYST S4010C cold-cure provides sub-5-minute demolding, enabling inline automotive coating. The downside remains surface finish and slightly lower mechanical properties, yet incremental research and development is closing the gap. Lower rig investment is especially attractive in India, Indonesia, and Brazil, where infrastructure budgets reward technologies that fit within modest capex envelopes.


By Product Form: Coatings Dominate, Sealants Surge in High-Movement Joints
Coatings accounted for 64.71% of the 2025 volume because polyurea’s abrasion resistance, chemical tolerance, and zero-VOC profile make it the default protective membrane across civil works. BASF’s Elastocoat surfaces container ships and wastewater basins, proving versatility across marine and municipal domains. Linings remain vital for interior pipe and tank surfaces, but grow slowly given cyclical capital spending in chemical processing.
Sealants are rising at 7.12% CAGR due to ±50% joint-movement capability, outclassing polyurethane at ±25% and silicone at ±35%. Bridge expansion joints in seismic zones, curtain-wall perimeters on super-tall structures, and airport runways now specify polyurea to safeguard life-cycle costs. Cartridge-dispensed formats bring polyurea technology to general contractors, widening market reach beyond specialized applicators. Integration of color packs and low-odor packages is removing the last usability hurdles, broadening uptake in vertical facade joints and high-traffic plazas.
By End-Use Industry: Construction Leads, Energy and Power Accelerates
Construction delivered 40.32% polyurea market share in 2025 because bridge decks, parking structures, and concrete floors demand membranes that cure in sub-freezing conditions and resist salt, abrasion, and vehicular loads. Dubai’s Hatta Dam project validated tunnel overlays that kept water flowing during lining. Automotive end-use continues to climb on EV battery protection and underbody coatings, integrating directly into robotic paint shops without new booths.
Energy and power is the fastest-growing vertical at 7.21% CAGR as offshore wind farms coat blades against rain erosion and UV degradation, and solar farms seal panel frames against moisture ingress. Rain-impact erosion extends blade life by five-plus years, avoiding USD 300,000 replacement components. Polyurea also lines lithium-ion storage containers, providing dielectric barriers that double as fire-retardant layers. With global renewables capacity heading toward 11,000 GW by 2030, this vertical will outpace construction on a proportional basis even if absolute size remains lower until the next decade.


Geography Analysis
North America controlled 40.92% of the 2025 value, supported by mature applicator networks and high labor costs that tilt cost-of-downtime equations in favor of rapid-cure chemistries. The Infrastructure Investment and Jobs Act directs USD 110 billion toward bridge and highway repair, ensuring steady demand for deck overlays and expansion-joint sealants. Canada’s municipal infrastructure bank also funds culvert relining, while Mexico’s industrial-park boom pushes demand for chemical-resistant floors in electronics and automotive corridors. BASF, Covestro, Huntsman, and PPG run integrated resin facilities across Texas, Louisiana, and Ontario, allowing just-in-time shipment of pre-polymers and curatives, which reduces lead times to three days for most projects.
Asia-Pacific is generating the fastest revenue expansion at a 7.93% CAGR through 2031. China’s Belt and Road corridor, India’s dedicated freight rail system, and Korea’s USD 20 billion EV battery supply-chain buildout are channeling large coating budgets. BASF’s 2025 move to raise Caojing resin capacity to 18,800 tons per year underpins regional supply. Government-sponsored metro expansions in Delhi, Chennai, and Guangzhou have specified polyurea for tunnel waterproofing owing to rainfall-induced ground settlement events. Southeast Asian contractors remain equipment-price sensitive, so cold-pour variants see heightened uptake. Regional specialty suppliers are partnering with Japanese trading houses to train applicators and accelerate specification writing.
Europe maintains a mature yet profitable market, rooted in VOC caps and refurbishment cycles for legacy infrastructure. Germany’s autobahn bridge retrofits and the Nordic region’s climate-adaptation programs employ polyurea for frost-resistant deck coatings. Maritime refurbishment in Spain and Italy is steady as shipyards invest in quicker turnaround for cruise vessels that lost revenue during pandemic shutdowns. Middle East states are adopting polyurea for desalination plant linings and tank farms; Saudi Arabia’s Aramco and ADNOC in the UAE are already piloting spray systems. South America shows localized demand tied to Chilean copper-mine expansion and Brazilian offshore developments.

Competitive Landscape
The polyurea market is moderately consolidated, with the top five players accounting for a significant market share, though dozens of regional formulators fill niche gaps. BASF, Covestro, Huntsman, and PPG leverage integrated isocyanate production and global logistics to buffer feedstock price swings. BASF’s turnkey Elastocoat lines offer warranties supported by in-house MDI and polyol manufacturing, an advantage small-volume blenders cannot replicate. Huntsman collaborates with Graco on smart-spray guns that embed RFID cartridges to calibrate mix ratios, curbing rework costs.
Technology innovation now centers on robotic spray arms that use lidar to map surface topography and adjust spray paths in real time, trimming wasted material. Self-healing polyurea under study at the University of Stuttgart embeds micro-capsules that release amine curatives under stress, extending membrane life in seismic zones. Hybrid polyurea-polyurethane films balance cost and elongation, aiming at parking decks where owners accept a small cure-time trade-off for lower installed cost. Suppliers slow to deliver PFAS-free chain extenders risk premature obsolescence in North America and Europe as regulators ratchet restrictions between 2026 and 2028.
Polyurea Industry Leaders
PPG Industries Inc.
The Sherwin-Williams Company
BASF SE
Huntsman International LLC
Rhino Linings Corporation
- *Disclaimer: Major Players sorted in no particular order

Recent Industry Developments
- February 2025: Huntsman launched POLYRESYST S4010C, a flame-retardant polyurea tailored to EV battery-pack protection and enabling sub-5-minute demolding cycles.
- July 2024: PPG introduced DuraNEXT energy-curable primers, basecoats, and clearcoats for coil-coated metal, offering sub-1-second cures and solvent-free formulations.


Research Methodology Framework and Report Scope
Market Definitions and Key Coverage
Our study defines the global polyurea market as all pure or hybrid polyurea formulations sold as two-component spray, pour, or hand-mix systems that cure through an isocyanate-amine reaction to deliver tough, elastomeric coatings, linings, and sealants used across construction, industrial, transportation, energy, and specialty infrastructure. Revenues are tracked at the first point of sale from formulators to distributors, applicators, or end-users.
Scope exclusion: The model omits polyurea-thickened greases, polyaspartic blends sold as distinct chemistries, captive in-house consumption, and application equipment.
Segmentation Overview
- By Chemical Structure
- Aromatic
- Aliphatic
- By Type
- Hot Polyurea
- Cold Polyurea
- By Product Form
- Coatings
- Linings
- Sealants
- By End-use Industry
- Construction
- Paints and Coatings
- Automotive
- Industrial
- Maritime
- Other End User Industries (Energy and Power, etc.)
- By Geography
- Asia-Pacific
- China
- Japan
- India
- South Korea
- Rest of Asia-Pacific
- North America
- United States
- Canada
- Mexico
- Europe
- Germany
- United Kingdom
- France
- Italy
- Rest of Europe
- South America
- Brazil
- Argentina
- Rest of South America
- Middle-East and Africa
- Saudi Arabia
- South Africa
- Rest of Middle-East and Africa
- Asia-Pacific
Detailed Research Methodology and Data Validation
Primary Research
Mordor analysts interviewed raw-material suppliers, contract applicators, and infrastructure owners in North America, Europe, China, India, and the GCC. These dialogues clarified typical applied film thickness, job-site yield losses, and regional price corridors, allowing us to verify secondary ratios and refine cost pass-through assumptions.
Desk Research
We began with open statistics from bodies such as the US Census Bureau, Eurostat's Prodcom, India's MOSPI, UN Comtrade, and the American Coatings Association, which map resin flows, construction coatings demand, and trade volumes. Engineering papers indexed on ScienceDirect and patents fetched through Questel helped us link formulation shifts to performance gains. Company 10-Ks, investor decks, and tender portals like Tenders Info added project-level spending clues, while D&B Hoovers supplied revenue splits for leading formulators. This set is illustrative; dozens of additional public records enriched our desk review.
Market-Sizing & Forecasting
A top-down construction and industry spend rebuild anchored the 2025 baseline: national infrastructure capex, industrial maintenance outlays, and vehicle build forecasts yield a demand pool, which is then filtered through polyurea penetration rates and average selling prices. Select bottom-up cross-checks, supplier shipment roll-ups and sprayer installed-base audits, catch blind spots before totals are locked. Key variables include bridge rehabilitation mileage, oil and gas pipeline replacement footage, ASTM D16 VOC limits, aromatic isocyanate price indices, and sprayer productivity benchmarks. A multivariate regression ties these drivers to historic consumption, while scenario analysis tests upside from stricter VOC rules or delayed spending cycles.
Data Validation & Update Cycle
Outputs pass three-layer review: automated variance scans, senior analyst peer checks, and a final sign-off call. Models refresh each year; interim updates trigger when raw-material prices swing greater than 10 percent, major infrastructure bills pass, or leading suppliers issue earnings surprises.
Why Our Polyurea Baseline Commands Confidence
Published figures often diverge because providers slice the market differently, refresh at uneven intervals, or rely on unvetted cost curves. By selecting only end-use-ready formulations, aligning currencies to constant 2024 dollars, and updating annually, Mordor delivers a balanced, decision-ready view.
Key gap drivers include variation in scope (some trackers limit coverage to coatings only), older base years rolled forward without price normalization, and untested volume assumptions for emerging regions.
Benchmark comparison
| Market Size | Anonymized source | Primary gap driver |
|---|---|---|
| USD 1.08 B (2025) | Mordor Intelligence | - |
| USD 0.94 B (2024) | Global Consultancy A | Excludes sealants and linings; older currency base |
| USD 0.91 B (2024) | Industry Data Publisher B | Uses conservative penetration for rehab spending |
| USD 1.30 B (2024) | Market Insights Firm C | Counts polyurea-thickened greases inside market |
These comparisons show how scope rigor, timely refreshes, and cross-validated variables make Mordor's baseline the most dependable starting point for strategy and investment planning.


Key Questions Answered in the Report
What is the current value of the polyurea market?
The polyurea market size is estimated at USD 1.09 billion in 2026.
How fast is global demand for polyurea growing?
The market is forecast to post a 5.52% CAGR and reach USD 1.43 billion by 2031.
Which end-use industry is expanding the quickest for polyurea?
Energy and power lead with a 7.21% CAGR through 2031, driven by offshore wind and solar applications.
Why are hot-spray polyurea systems dominant?
Hot-spray rigs apply seamless membranes at high speed and captured a 59.51% share in 2025.
What factor most limits polyurea adoption in emerging markets?
High equipment cost and short pot-life that demand skilled applicators still curb penetration.
Which region is expected to register the highest growth through 2031?
Asia-Pacific is advancing at a 7.93% CAGR, underpinned by large infrastructure programs in China and India.
Page last updated on:


