Polyurea Coatings Market Size and Share
Market Overview
| Study Period | 2020 - 2031 |
|---|---|
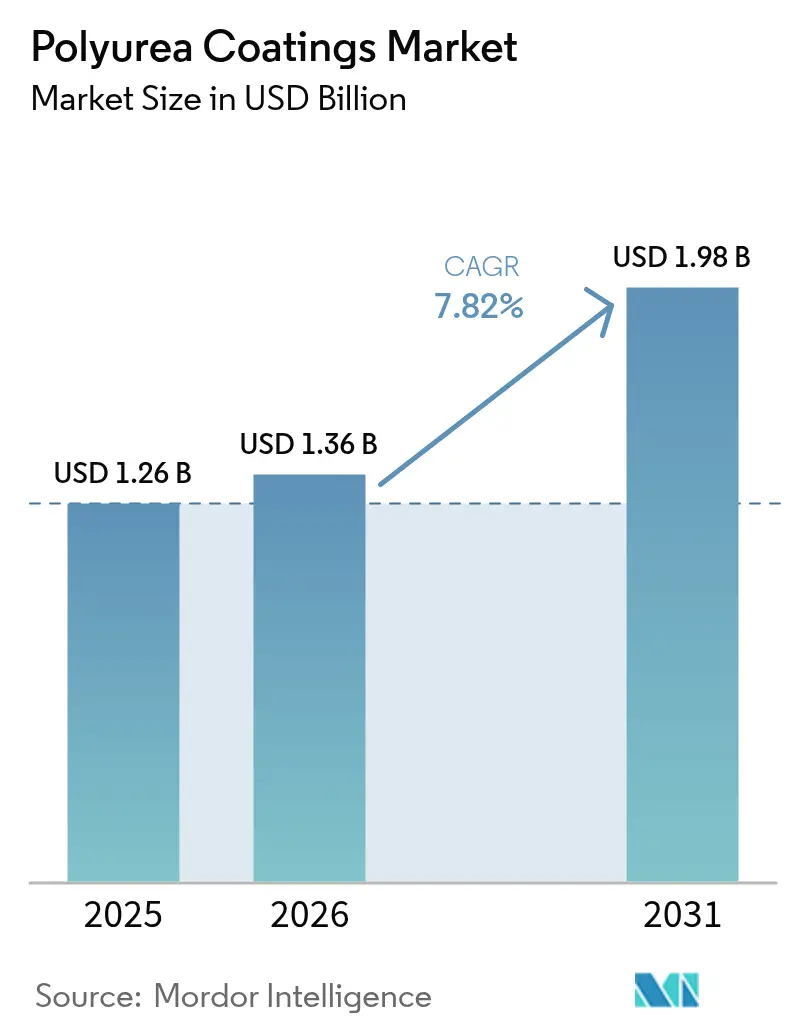
| Market Size (2026) | USD 1.36 Billion |
| Market Size (2031) | USD 1.98 Billion |
| Growth Rate (2026 - 2031) | 7.82% CAGR |
| Fastest Growing Market | Asia Pacific |
| Largest Market | Asia Pacific |
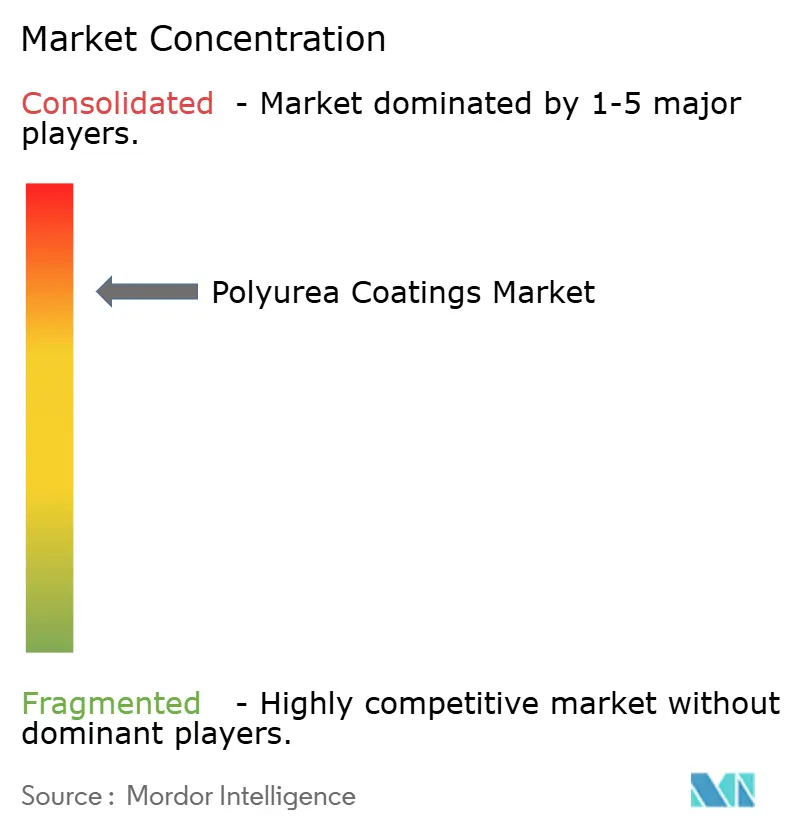
| Market Concentration | High |
Major Players *Disclaimer: Major Players sorted in no particular order Image © Mordor Intelligence. Reuse requires attribution under CC BY 4.0. | |
Polyurea Coatings Market Analysis by Mordor Intelligence
Polyurea Coatings Market size in 2026 is estimated at USD 1.36 billion, growing from 2025 value of USD 1.26 billion with 2031 projections showing USD 1.98 billion, growing at 7.82% CAGR over 2026-2031. Infrastructure upgrades, industrial-flooring refurbishments, and transportation OEM specifications are widening the application base, while equipment innovations and hybrid formulations are lowering adoption barriers. Competitive dynamics are shifting as leading producers rationalize portfolios and channel investment toward sustainability, positioning advanced polyurea systems as preferred substitutes for epoxy and polyurethane in high-performance settings.
Key Report Takeaways
- By type, pure formulations captured 66.12% of the polyurea coatings market share in 2025, while hybrid variants are forecast to grow at 9.07% CAGR through 2031.
- By technology, spraying led with 69.68% revenue share in 2025, whereas hand-mixing is progressing at 9.46% CAGR to 2031.
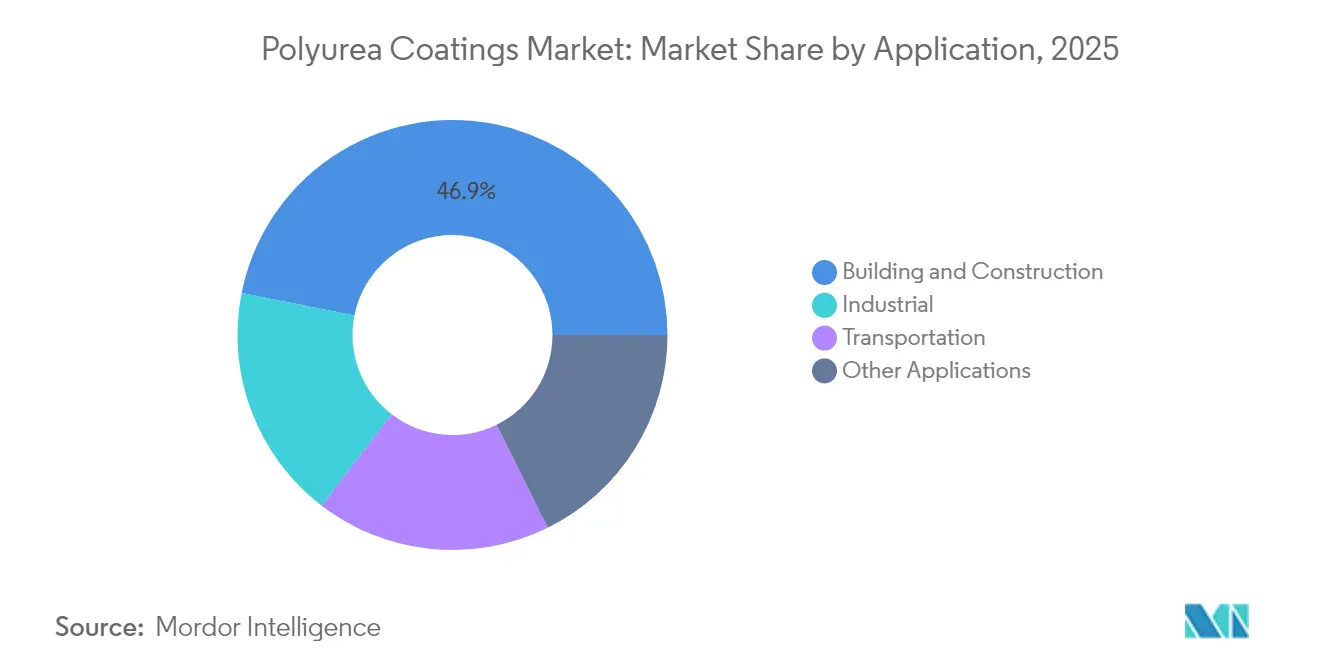
- By application, building and construction accounted for 46.88% of the polyurea coatings market size in 2025, and transportation applications are rising at a 9.18% CAGR through 2031.
- By geography, Asia Pacific commanded 40.85% of the polyurea coatings market share in 2025 and is expanding at 9.31% CAGR to 2031.
Note: Market size and forecast figures in this report are generated using Mordor Intelligence’s proprietary estimation framework, updated with the latest available data and insights as of 2026.
Global Polyurea Coatings Market Trends and Insights
Driver Impact Analysis*
| Drivers | (~) % Impact on CAGR Forecast | Geographic Relevance | Impact Timeline |
|---|---|---|---|
| Expanding building and construction activities | +2.5% | Global, with APAC core and spillover to MEA | Medium term (2-4 years) |
| Stricter VOC and HAP emission regulations | +1.8% | North America and EU, expanding to APAC | Long term (≥ 4 years) |
| Shift from epoxy/PU to higher performance polyurea systems | +1.2% | Global, led by developed markets | Medium term (2-4 years) |
| Industrial flooring upgrades in food and beverage and pharma | +0.9% | North America, EU, and developed APAC markets | Short term (≤ 2 years) |
| Rapid-cure aliphatic polyurea for emergency infrastructure repairs | +0.6% | Global, with focus on aging infrastructure regions | Long term (≥ 4 years) |
| Source: Mordor Intelligence | |||
Expanding Construction Activity
Real-estate spending, infrastructure megaprojects, and urbanization are accelerating polyurea consumption as contractors prioritize coatings that cure within minutes and tolerate wide temperature ranges. Roof restoration, podium waterproofing, and joint sealing benefit from 400% elongation that mitigates crack propagation in seismic and thermal-cycling zones. Prefabricated modules now receive factory-applied polyurea layers, arriving on-site fully cured and reducing labor requirements. Asia Pacific dominates volume because China’s transport corridors and India’s smart-city schemes specify durable membranes, while Middle East mixed-use complexes adopt polyurea for rapid turnaround on tight construction schedules.
Stricter VOC and HAP Emission Regulations
The US National VOC Emission Standards cap industrial-maintenance coatings at 450 g/L, with California enforcing 100–250 g/L, pressuring formulators toward 100%-solids polyurea technologies. EPA’s proposed amendments to polyether-polyol NESHAP are poised to trim hazardous air pollutants by 157 tons annually, tightening upstream supply quality. Similar directives in the EU and South Korea create region-specific compliance hurdles that reward suppliers with robust regulatory affairs capacity. Large enterprises are leveraging green-energy transitions, such as BASF’s full renewable-electricity adoption at key North American sites, to present lower-carbon footprints and win VOC-constrained bids.
Shift from Epoxy/PU to Higher-Performance Polyurea Systems
Asset owners are phasing out epoxy and polyurethane where rapid return-to-service, chemical resistance, or elongation is critical. Automotive OEMs employing 142 million lb of polyurethane in 2023 are testing aliphatic polyurea for underbody exposure and color retention. Wastewater utilities specify pure polyurea linings that bridge active cracks and resist hydrogen-sulfide attack, extending concrete life by multiples[1]Association for Materials Protection and Performance, “Polyurea for Wastewater Infrastructure,” ampp.org. Material-science advances such as optimized 7:3 TDI/MDI blends delivering 52.9 MPa tensile strength are cementing polyurea’s performance edge.
Rapid-Cure Aliphatic Polyurea for Emergency Infrastructure Repairs
Departments of transportation deploy aliphatic formulations for bridge-deck overlays that reopen lanes within hours, preserving traffic flow. Winter work becomes viable because polyurea sprays at –40°F and remains UV-stable in exposed settings. These attributes underpin contingency-repair strategies for pipelines, spill-containment berms, and airport runways pending full reconstruction.
Restraint Impact Analysis*
| Restraints | (~) % Impact on CAGR Forecast | Geographic Relevance | Impact Timeline |
|---|---|---|---|
| High raw-material cost volatility | -1.5% | Global, with acute impact in price-sensitive markets | Short term (≤ 2 years) |
| Requirement for specialized plural-component spray equipment and skills | -0.8% | Developing markets and small contractor segments | Medium term (2-4 years) |
| Poor Color Stability on Exposure to UV Light | -0.7% | Global, particularly in architectural and transportation applications | Long term (≥ 4 years) |
| Source: Mordor Intelligence | |||
High Raw-Material Cost Volatility
Isocyanate and polyamine feedstocks track oil-price swings, compressing margins when supply tightens. Bio-based polyTHF and recycled-PET polyols promise eventual relief, yet currently command premiums that smaller contractors cannot absorb. Emerging markets such as Indonesia are particularly sensitive to price spikes that stall project awards.
Requirement for Specialized Plural-Component Spray Equipment and Skills
Plural-component rigs exceeding USD 50,000 and requiring precise ratio control limit market access for small applicators. Maintenance and training further raise the entry bar. OEM and association training programs are easing the learning curve, but equipment complexity remains a drag on growth in contractor-dominated regions.
*Our forecasts treat driver/restraint impacts as directional, not additive. The impact forecasts reflect baseline growth, mix effects, and variable interactions.
Segment Analysis
By Type: Performance Leadership of Pure Formulations
Pure systems dominated 2025 revenue, claiming 66.12% of demand on the strength of rapid gel times and best-in-class tensile properties. Asset owners in wastewater, chemical processing, and marine sectors increasingly specify pure polyurea to secure 400% elongation and multi-decade service life. Research optimizing isocyanate ratios continues to push performance ceilings, reinforcing customer preference for pure grades in mission-critical environments.
Hybrid grades, while lagging in mechanical attributes, offer compelling economics by incorporating polyol segments and are therefore penetrating residential waterproofing and light industrial flooring at 9.07% CAGR. Suppliers emphasize balanced formulations that meet ASTM C836 waterproofing standards while trimming raw-material spend. This pragmatic approach broadens addressable demand among cost-constrained users without cannibalizing pure-system strongholds.


By Technology: Spray Dominance with Emerging Hand-Mixing Alternatives
Spray application controlled 69.68% revenue in 2025, owing to unmatched productivity on tanks, bridge decks, and large roofs where uniform 1-to-3 mm membranes are essential. Recent plural-pump designs handle 1:1 to 6:1 ratios at 100% solids, permitting jobsite tuning for viscosity and cure speed.
Conversely, hand-mixing’s 9.46% CAGR stems from demand in confined spaces, remote sites, and small-budget projects. Manufacturers introduced cartridge or pail kits that combine extended pot life with safer exotherm control, letting general-contractor crews apply polyurea using rollers or notched squeegees. While thickness uniformity may vary, the approach democratizes access and seeds future conversion to spray once volume scales.
By Application: Construction Dominance and Accelerating Transportation Uptake
Construction uses captured 46.88% of the 2025 spend as building envelopes, plaza decks, and sub-grade structures employed polyurea to combat water ingress and shorten project cycles. Strict building codes in seismic and hurricane regions now recognize the value of high-elongation membranes that sustain structural movement without cracking.
Transportation, rising at 9.18% CAGR, reflects automotive OEM deployment of aliphatic coatings for underbody abrasion, railcar refurbishment programs, and marine hull protection in saltwater theatres. The adoption curve accelerates as OEMs seek thin-film, solvent-free technologies that align with life-cycle-assessment targets and expedite production-line throughput.
Geography Analysis
Asia Pacific held a 40.85% share in 2025 and records the fastest 9.31% CAGR to 2031. China’s Belt-and-Road corridors and India’s metro-rail extensions specify polyurea for waterproofing tunnels and viaducts, while Japan deploys the material for marine terminals vulnerable to salt-fog corrosion. Indonesia’s coatings market advancing at 6.47% annually underscores regional momentum.
North America shows a mature yet resilient appetite anchored in bridge-deck rehabilitation, industrial flooring, and stringent VOC legislation. California’s 100–250 g/L VOC limits and upcoming aerosol-coatings compliance deadline of January 2027 intensify migration toward 100%-solids systems.
Europe balances stable renovation cycles with advanced environmental compliance demands. Asset owners invest in polyurea overlays for parking structures and potable-water reservoirs to extend service life under EN 1504 guidelines. South America, and the Middle East and Africa collectively advance from a low base; government-led housing and desalination projects create opportunities, but limited contractor training and volatile foreign-exchange conditions temper immediate scaling.


Competitive Landscape
Market structure is consolidated in nature. Front-runner strategies revolve around vertical integration and end-use specialization. Sherwin-Williams’ purchase of Dur-A-Flex strengthens resinous-floor offerings for food and pharma clients. Innovation pipelines are pivoting toward bio-based, self-healing, and low-temperature-cure platforms. Collaborations with raw-material suppliers ensure backward integration and secure supply of next-generation isocyanates and chain extenders. Distributors such as Univar capture value by bundling technical support, logistics, and regulatory guidance, enabling smaller formulators to reach global OEMs.
Polyurea Coatings Industry Leaders
BASF
Huntsman International LLC
PPG Industries, Inc.
Sika AG
The Sherwin-Williams Company
- *Disclaimer: Major Players sorted in no particular order

Recent Industry Developments
- June 2023: Rhino Linings launched HiChem 11-70, a 1:1-ratio polyurea coating, offering high chemical resistance for immersion duties.
- May 2023: DELTA Coatings International broke ground on a Dubai Industrial City headquarters and plant that will triple capacity for next-generation polyurea systems.


Global Polyurea Coatings Market Report Scope
Polyurea is a chemical that is created by combining a diisocyanate and a diamine. The polymerization mixture is similar to the polymerization of polyurethane, and the resulting reaction is called "urea." This is how it is referred to as a polyurea. The polyurea coatings market is segmented by type, technology, application, and region. By type, the market is segmented into pure and hybrid. By technology, the market is segmented into spraying, pouring, and hand mixing. By application, the market is segmented into building and construction, industrial, transportation, and other applications. The report also covers the market size of and forecasts for the polyurea coatings market in 15 countries across major regions. For each segment, the market sizing and forecasts have been done on the basis of revenue (USD million).
| Pure |
| Hybrid |
| Spraying |
| Pouring |
| Hand Mixing |
| Building and Construction |
| Industrial |
| Transportation |
| Other Applications |
| Asia-Pacific | China |
| India | |
| Japan | |
| South Korea | |
| Rest of Asia-Pacific | |
| North America | United States |
| Canada | |
| Mexico | |
| Europe | Germany |
| United Kingdom | |
| France | |
| Italy | |
| Rest of Europe | |
| South America | Brazil |
| Argentina | |
| Rest of South America | |
| Middle-East and Africa | Saudi Arabia |
| United Arab Emirates | |
| South Africa | |
| Egypt | |
| Rest of Middle-East and Africa |
| By Type | Pure | |
| Hybrid | ||
| By Technology | Spraying | |
| Pouring | ||
| Hand Mixing | ||
| By Application | Building and Construction | |
| Industrial | ||
| Transportation | ||
| Other Applications | ||
| By Geography | Asia-Pacific | China |
| India | ||
| Japan | ||
| South Korea | ||
| Rest of Asia-Pacific | ||
| North America | United States | |
| Canada | ||
| Mexico | ||
| Europe | Germany | |
| United Kingdom | ||
| France | ||
| Italy | ||
| Rest of Europe | ||
| South America | Brazil | |
| Argentina | ||
| Rest of South America | ||
| Middle-East and Africa | Saudi Arabia | |
| United Arab Emirates | ||
| South Africa | ||
| Egypt | ||
| Rest of Middle-East and Africa | ||


Key Questions Answered in the Report
What is the current polyurea coatings market size and growth outlook?
The polyurea coatings market is worth USD 1.36 billion in 2026 and is projected to expand at an 7.82% CAGR to reach USD 1.98 billion by 2031.
Why are companies switching from epoxy or polyurethane to polyurea systems?
Polyurea cures in minutes, resists chemicals, and stretches up to 400%, cutting downtime and extending asset life in demanding environments.
Which region leads demand for polyurea coatings?
Asia Pacific holds 40.85% of global revenue and is growing the fastest at 9.31% CAGR thanks to large-scale infrastructure and construction investment in China and India.
How do VOC regulations influence the polyurea coatings industry?
Strict federal and state VOC limits favor 100% solids polyurea, giving compliant suppliers a competitive edge and accelerating market penetration in North America and the EU.
What key factors are driving market growth through 2031?
Rapid urbanization, stricter emission rules, industrial-flooring upgrades in food and pharma plants, and the need for speedy infrastructure repairs are boosting demand.
Page last updated on:


