Polytetrafluoroethylene (PTFE) Market Size and Share
Market Overview
| Study Period | 2021 - 2031 |
|---|---|
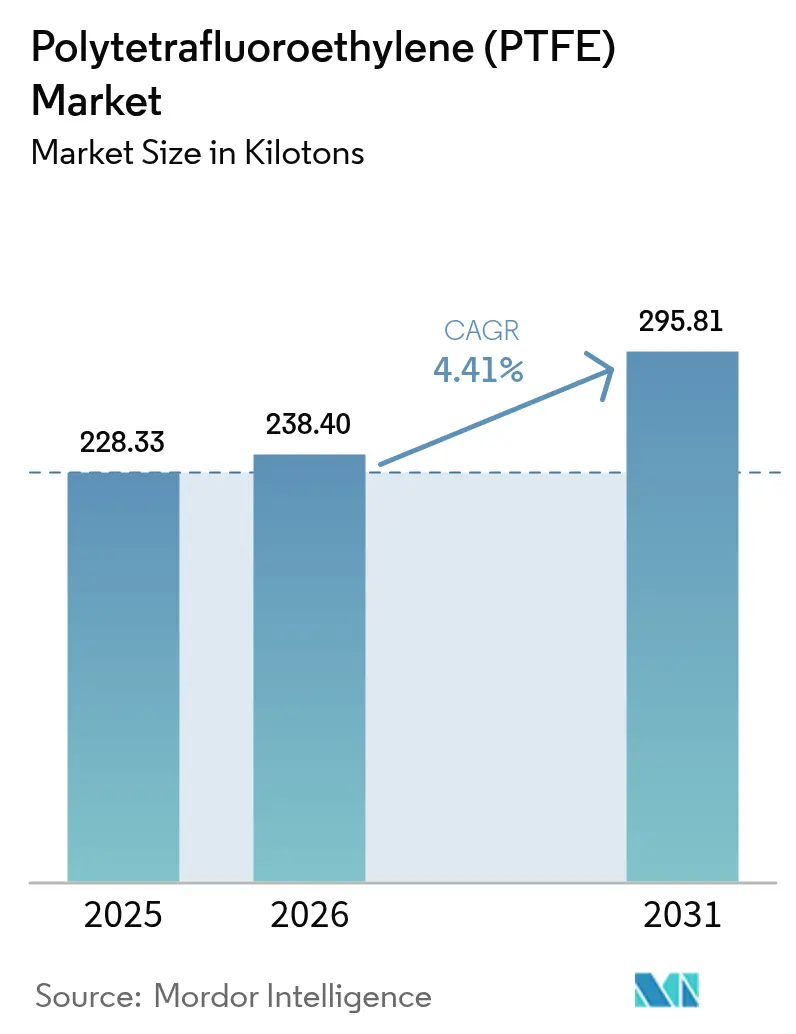
| Market Volume (2026) | 238.40 kilotons |
| Market Volume (2031) | 295.81 kilotons |
| Growth Rate (2026 - 2031) | 4.41% CAGR |
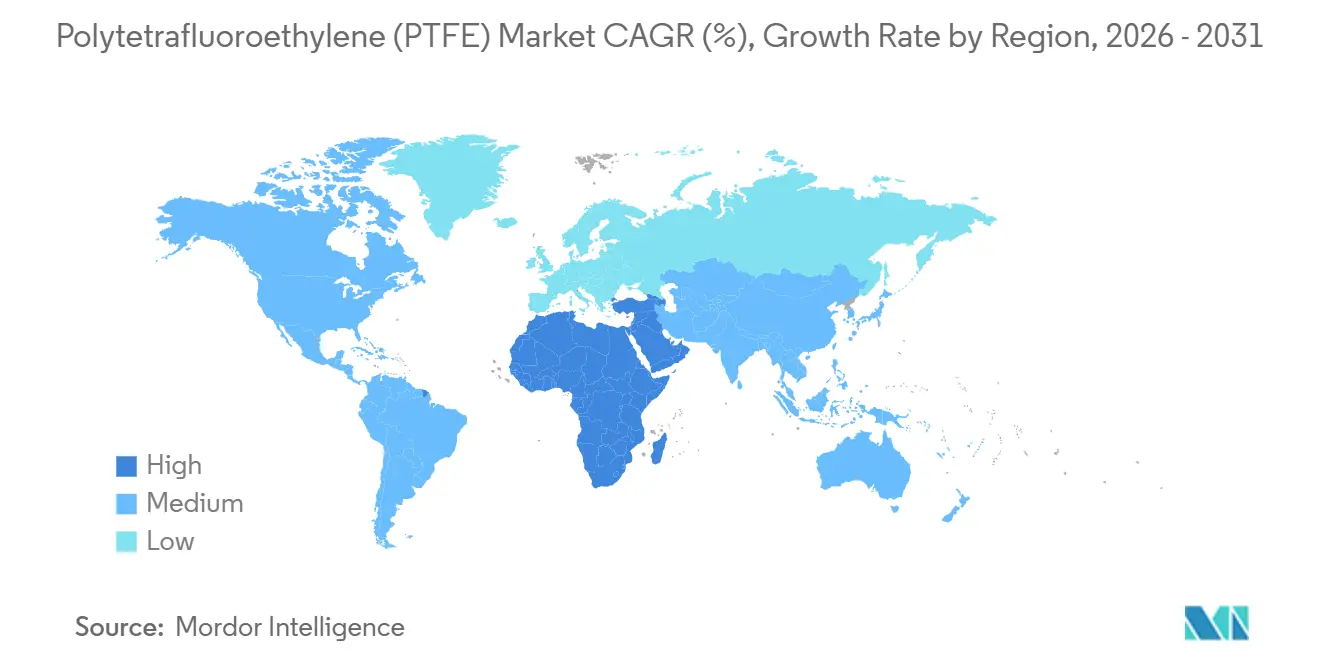
| Fastest Growing Market | Middle East and Africa |
| Largest Market | Asia Pacific |
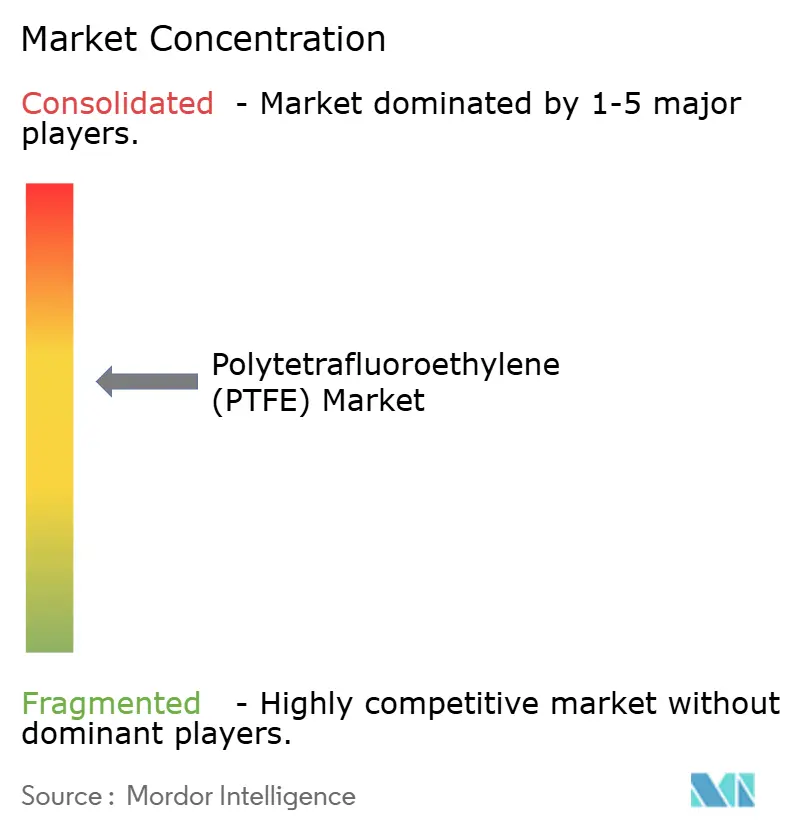
| Market Concentration | Medium |
Major Players *Disclaimer: Major Players sorted in no particular order Image © Mordor Intelligence. Reuse requires attribution under CC BY 4.0. | |
Polytetrafluoroethylene (PTFE) Market Analysis by Mordor Intelligence
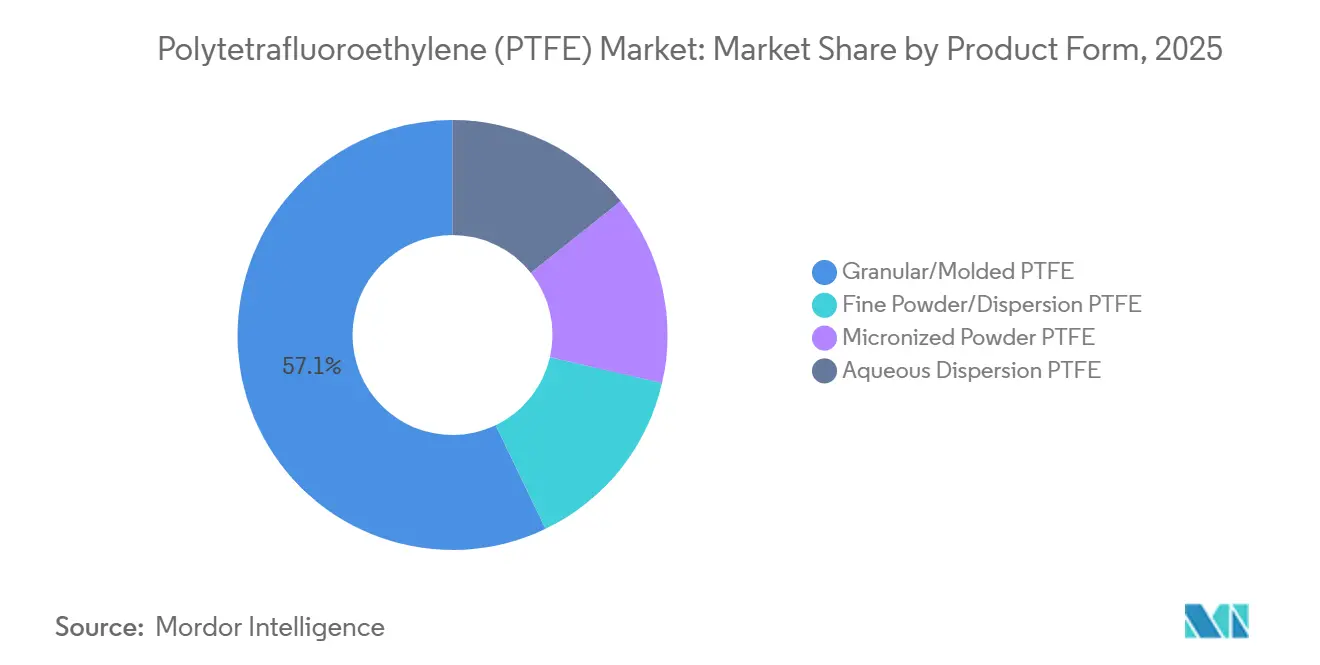
The Polytetrafluoroethylene Market size is expected to grow from 228.33 kilotons in 2025 to 238.40 kilotons in 2026 and is forecast to reach 295.81 kilotons by 2031 at 4.41% CAGR over 2026-2031. Granular and molded grades anchored 57.12% of 2025 volume, reflecting entrenched demand in chemical-processing seals, gaskets, and pump components. Micronized powder is set to record the fastest product-form advance at 5.89% CAGR, propelled by 3D-printing filaments and specialty lubricants. Electrical and electronics applications will outpace all end-use sectors at 5.96% CAGR as solid-state battery separators and high-voltage EV cable insulation add new tonnage. Sovereign fluorspar policies in China, which supplies 60% of global output, are raising landed costs for North American and European converters by 12–18%, compressing margins for smaller compounders.
Key Report Takeaways
- By product form, granular and molded grades led with 57.12% of the Polytetrafluoroethylene (PTFE) market share in 2025, whereas micronized powder is projected to expand at a 5.89% CAGR during the forecast period (2026-2031).
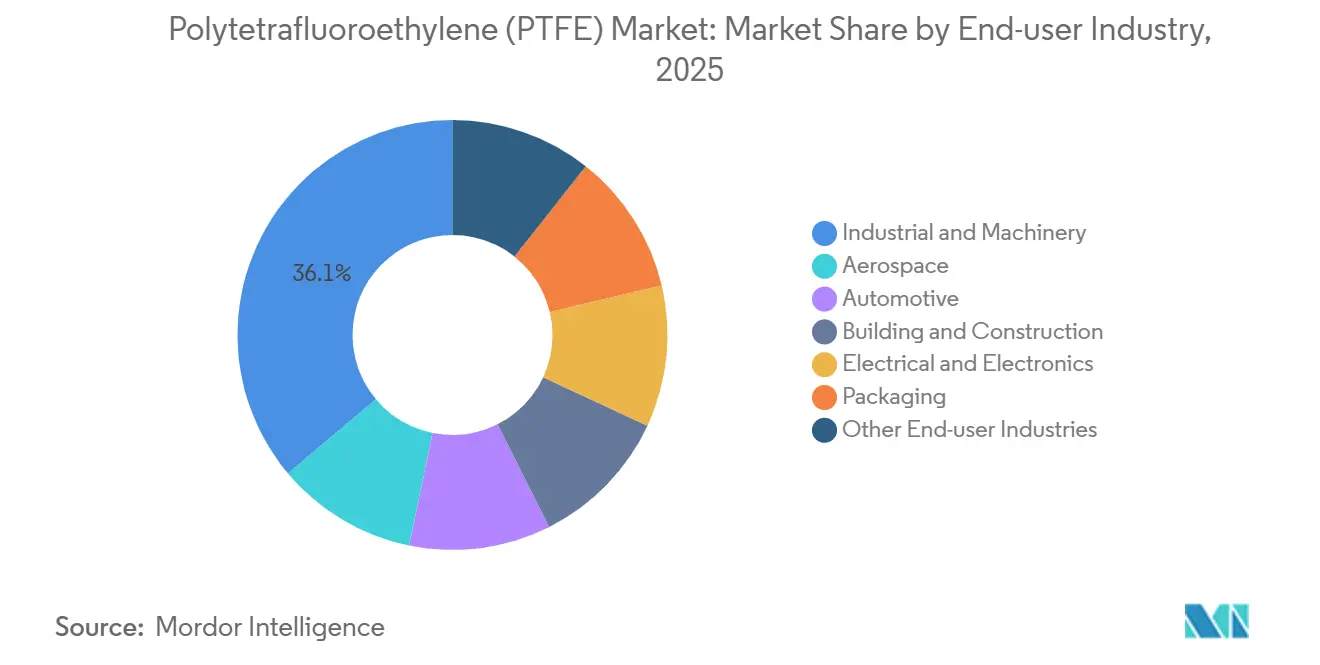
- By end-user industry, industrial and machinery held 36.13% of the Polytetrafluoroethylene (PTFE) market size in 2025; electrical and electronics is forecast to register the fastest 5.96% CAGR during the forecast period (2026-2031).
- By geography, Asia-Pacific commanded 53.13% of the Polytetrafluoroethylene (PTFE) market share in 2025, while the Middle-East and Africa are anticipated to deliver the highest 5.78% CAGR during the forecast period (2026-2031).
Note: Market size and forecast figures in this report are generated using Mordor Intelligence’s proprietary estimation framework, updated with the latest available data and insights as of 2026.
Global Polytetrafluoroethylene (PTFE) Market Trends and Insights
Driver Impact Analysis*
| Driver | (~) % Impact on CAGR Forecast | Geographic Relevance | Impact Timeline |
|---|---|---|---|
| Growth in global chemical processing capacity | +0.9% | Global, with concentration in Asia-Pacific (China, India) and Middle-East | Medium term (2-4 years) |
| EV-driven demand for lightweight wire and cable insulation | +1.2% | Global, led by North America, Europe, and China | Short term (≤ 2 years) |
| Surging PTFE use in non-stick cookware markets | +0.5% | Asia-Pacific, North America, Europe | Long term (≥ 4 years) |
| Adoption of PTFE membranes in solid-state batteries | +1.0% | Asia-Pacific (Japan, South Korea, China), North America | Medium term (2-4 years) |
| Rising use of micro-powder PTFE in 3D-printing filaments | +0.6% | North America, Europe, emerging in Asia-Pacific | Long term (≥ 4 years) |
| Source: Mordor Intelligence | |||


Growth in Global Chemical Processing Capacity
Petrochemical and specialty-chemical complexes commissioned between 2024 and 2026 added 45 million tpy of ethylene and propylene capacity, especially in China’s Yangtze River Delta and Saudi Arabia’s Jubail hub, driving incremental demand for corrosion-resistant Polytetrafluoroethylene (PTFE) gaskets and pump diaphragms[1]American Chemistry Council, “Year-End 2025 Chemical Industry Report,” americanchemistry.com. Each new cracker consumes roughly 2.5–3.5 kilotons of Polytetrafluoroethylene (PTFE) components over its 25-year life, translating into 110–160 kilotons of latent demand from projects already under construction. Granular grades dominate these applications, yet aqueous dispersions are gaining traction in spray-applied vessel linings that must comply with ISO (International Organization for Standardization) 15848 fugitive-emission limits. Modular prefabricated process skids further accelerate Polytetrafluoroethylene (PTFE) uptake because equipment vendors specify fluoropolymer seals that eliminate field customization. As a result, the Polytetrafluoroethylene (PTFE) market benefits from synchronized capacity additions and stricter environmental regulations across growth regions.
EV-Driven Demand for Lightweight Wire and Cable Insulation
Battery-electric vehicles placed in 2025 contained an average of 1.8 km of high-voltage cabling, double the harness length of internal-combustion models, and PTFE’s dielectric strength above 60 kV/mm enables a 20–30% wall-thickness reduction that cuts harness mass by up to 1.8 kg and extends vehicle range by 3-5 km per charge[2]Tesla, “2025 Impact Report,” tesla.com. Chemours raised Teflon PFA (Perfluoroalkoxy) output in West Virginia during 2024 to meet demand from TE Connectivity and Aptiv, both integrating PTFE-insulated conductors into 800-V systems operating at 200°C. Tesla’s dry-electrode battery uses micronized PTFE as a binder; if adoption reaches 15% of global EV production by 2030, annual PTFE powder demand could approach 150 kilotons. The rapid pull from EV platforms, therefore, reshapes the PTFE market by absorbing high-purity powder and film grades.
Surging PTFE Use in Non-Stick Cookware Markets
Consumer preference for metal-utensil-safe pans boosted demand for reinforced PTFE coatings by 9% in 2025. Manufacturers in Guangdong and Maharashtra are running three-layer PTFE systems that cure at lower oven temperatures, trimming energy use by 18% and accelerating line throughput. Although regulators phased out long-chain Perfluorooctanoic acid (PFOA) processing aids, short-chain alternatives such as GenX preserve performance while meeting EPA (Environmental Protection Agency) and European Union (EU) thresholds. PTFE, therefore, retains its dominance in premium cookware even as compliance costs rise.
Adoption of PTFE Membranes in Solid-State Batteries
Toyota’s sulfide-based solid-state cell slated for 2027 commercial launch employs a porous PTFE separator to block lithium dendrites while maintaining more than 10 mS/cm ionic conductivity. Samsung SDI and QuantumScape pursue similar architectures that require sub-micron-pore PTFE membranes for mechanical integrity during cycling. Each gigawatt-hour of solid-state capacity needs 12-18 tons of powder, implying 600-900 kilotons of potential demand at 50 GWh by 2030. These volumes concentrate on ultra-high-purity grades priced 40-60% above commodity levels, bolstering margins for suppliers prepared to certify semiconductor-class cleanliness.
Restraint Impact Analysis*
| Restraint | (~) % Impact on CAGR Forecast | Geographic Relevance | Impact Timeline |
|---|---|---|---|
| Geopolitical risk to fluorspar supply | -0.7% | Global, most acute in North America and Europe | Short term (≤ 2 years) |
| Engineering-plastic substitutes for 5G hardware | -0.4% | Global, concentrated in Asia-Pacific and North America | Medium term (2-4 years) |
| European Union proposed ban on micro-plastic powders in coatings | -0.3% | Europe, potential spillover to North America | Long term (≥ 4 years) |
| Source: Mordor Intelligence | |||
Geopolitical Risk to Fluorspar Supply
China’s export licensing tightened 2025 shipments to 1.2 million tons, 15% below 2024 volumes, pushing Western spot prices to USD 550/ton from USD 380/ton and inflating hydrofluoric-acid costs 18-22%. Mexico’s Mexichem and Mongolia’s Erdenet plan 180,000 tons per year of new capacity by late 2027, yet interim scarcity forces several European compounders to idle 10-15% of nameplate PTFE capacity during Q1 2026 to preserve liquidity.
Engineering-Plastic Substitutes for 5G Hardware
Polyetheretherketone and liquid-crystal polymer resins now rival PTFE for 5G antenna substrates at 30-40% lower cost and faster injection-molding cycle times. Ericsson and Nokia have qualified PEEK (Polyether ether ketone) enclosures that withstand outdoor UV and thermal cycling, where PTFE once dominated. Substitution is 8-12% of PTFE volume through 2026, but accelerates as PEEK (Polyether ether ketone) suppliers ramp capacity in Asia-Pacific.
*Our forecasts treat driver/restraint impacts as directional, not additive. The impact forecasts reflect baseline growth, mix effects, and variable interactions.
Segment Analysis
By Product Form: Granular Grades Anchor Industrial Demand
Granular and molded PTFE held 57.12% volume in 2025, driven by machined seals and valve seats across refineries, chemical plants, and pharmaceutical facilities. This segment is expected to maintain tonnage leadership as operators retrofit to meet ISO 15848 emission standards. However, micronized powder is projected to clock a 5.89% CAGR during the forecast period (2026-2031), the highest among product forms, as additive-manufacturing filament producers and automotive-grease formulators adopt sub-2 µm (micrometer) grades that cut friction coefficients to 0.08. Fine-powder compression molding remains essential for PTFE tapes and films used in electrical insulation, while aqueous dispersions grow modestly in cookware and vessel linings as VOC (Volatile Organic Compound) limits tighten. The PTFE market size for fine-powder and dispersion grades combined is forecast to reach 108 kilotons by 2031. Enhanced water-borne systems reduce VOC emissions 70-85%, aligning with EPA and EU directives.
In parallel, granular suppliers are integrating digital-twin analytics to adjust sintering profiles in real time, lowering scrap rates by 7-10%. Powder producers pursue nano-scale particle-size control to serve solid-state batteries and semiconductor wet-process components that require less than 50 ppb (parts per billion) metal contaminants. These technology shifts widen the performance gap between commodity and high-purity offerings, prompting leading vendors to devote 15-20% of annual capex to purification and clean-room finishing. Consequently, the PTFE market experiences bifurcation between volume-driven grades and margin-rich specialty powders.


By End-User Industry: Electronics Outpaces Industrial Machinery
Industrial and machinery applications commanded 36.13% of the 2025 volume on the back of seals, compressor rings, and bearing cages in corrosive media. Yet, electrical and electronics are plotted to grow at a 5.96% CAGR during the forecast period (2025-2031), the fastest among end-users, as solid-state battery separators, 5G antenna substrates, and semiconductor Chemical Mechanical Planarization (CMP) equipment demand high-purity PTFE films. The PTFE market share for electronics could rise by 2031. Automotive applications remain pivotal: PTFE-lined fuel hoses withstand ethanol blends, while EV high-voltage cables employ thin-wall PTFE insulation rated to 200°C.
Aerospace deploys PTFE in landing-gear seals and engine oil-system components certified to AMS 3678, leveraging ultra-high-purity grades. Building and construction adopt PTFE-coated architectural membranes that offer a 30-year maintenance-free service life, offsetting initial costs that run 40-60% above PVC fabric. Packaging remains niche, limited to conveyor belts and release liners as regulators scrutinize direct food-contact fluoropolymers. Medical devices, including minimally invasive catheter liners and vascular graft membranes, gain traction under ISO 10993 and FDA (Food and Drug Administration) CFR (Code of Federal Regulations) 820 compliance, adding premium-priced volume to the PTFE market.
Geography Analysis
Asia-Pacific captured 53.13% of global PTFE consumption in 2025, supported by China’s fluorochemical capacity and India’s pharmaceutical-grade expansion. Dongyue and Sinochem together operate 85 kilotons of annual nameplate capacity, while Gujarat Fluorochemicals added 3,500 tons per year of fine-powder output during 2025. Japan’s Daikin Industries recorded JPY 349.2 billion (USD 2.4 billion) fluorochemical sales in FY 2024, up 6.1% year-on-year, on semiconductor and EV battery binders. Although China’s chemical-processing growth moderates, India’s textile and pharma uses plus Southeast Asia’s electronics assembly sustain a substantial regional CAGR through 2031.
The Middle East and Africa region is projected to post the fastest 5.78% CAGR during the forecast period (2026-2031) as Saudi Arabia’s Jubail II complex specifies PTFE valve seats for chlorinated feedstocks, and GCC (Gulf Cooperation Council) downstream units invest in fluoropolymer-lined pumps. South Africa’s mining sector upgrades ore-slurry pumps with PTFE linings to extend service intervals. North America's market share growth is amid fluorspar price pressure and engineering-plastic substitution in 5G hardware. Arkema’s USD 20 million Polyvinylidene fluoride (PVDF) expansion in Kentucky, starting mid-2026, reallocates resin away from commodity granular PTFE and tightens supply for molding-grade buyers.
In Europe, Germany, France, and the United Kingdom dominate demand but face a potential 8-10 kiloton loss if ECHA (European Chemicals Agency) finalizes its micro-plastic restriction without PTFE exemptions. South America remains small, driven by Brazil’s offshore oil rigs and Argentina’s agro-chemical plants, both requiring PTFE seals under ANVISA (Agência Nacional de Vigilância Sanitária) and ANMAT (Administración Nacional de Medicamentos, Alimentos y Tecnología Médica) regulations.

Competitive Landscape
The Polytetrafluoroethylene (PTFE) market is moderately consolidated. Regional specialists such as Gujarat Fluorochemicals and Shanghai 3F capture share in pharma and electronics grades by offering shorter lead times and localized technical support. Strategic investment is two-track: incumbents channel capex into high-purity dispersion and micronized powders for semiconductors, solid-state batteries, and 3D-printing, while smaller converters target cost-competitive granular grades for industrial sealing.
Polytetrafluoroethylene (PTFE) Industry Leaders
AGC Inc.
Daikin Industries, Ltd.
Dongyue Group
The Chemours Company
3M
- *Disclaimer: Major Players sorted in no particular order

Recent Industry Developments
- November 2025: AGC Inc. announced that its Fluon PTFE G grade, manufactured using recycled fluorite as the raw material, completed third-party verification based on UL2809. UL 2809 is a standard that defines the methods by which third parties verify self-declared percentages of recycled materials used by entities, based on ISO 14021.
- November 2025: Junkosha announced plans to showcase its Hybrid Channel Tubing solution for endoscopic guide instruments at COMPAMED 2025 in Düsseldorf, Germany. Designed for minimally invasive procedures, the tubing combines the durability of PTFE with the flexibility of expanded PTFE.


Global Polytetrafluoroethylene (PTFE) Market Report Scope
Polytetrafluoroethylene (PTFE), commonly known by the brand name Teflon, is a high-performance synthetic fluoropolymer renowned for its extreme non-stick properties, low friction coefficient, high chemical resistance, and wide operating temperature range. It is used for non-stick cookware, industrial gaskets, electrical insulation, and medical devices due to its inert nature.
The Polytetrafluoroethylene (PTFE) Market is segmented by product form, end-user industry, and geography. By product form, the market is segmented into granular/molded PTFE, fine powder/dispersion PTFE, micronized powder PTFE, and aqueous dispersion PTFE. By end-user industry, the market is segmented into aerospace, automotive, building and construction, electrical and electronics, industrial and machinery, packaging, and other end-user industries. The report also covers the market size and forecasts for the Polytetrafluoroethylene (PTFE) market in 16 countries across major regions. For each segment, the market sizing and forecasts have been done on the basis of volume (tons).
| Granular/Molded PTFE |
| Fine Powder/Dispersion PTFE |
| Micronized Powder PTFE |
| Aqueous Dispersion PTFE |
| Aerospace |
| Automotive |
| Building and Construction |
| Electrical and Electronics |
| Industrial and Machinery |
| Packaging |
| Other End-user Industries |
| Asia-Pacific | China |
| India | |
| Japan | |
| South Korea | |
| Rest of Asia-Pacific | |
| North America | United States |
| Canada | |
| Mexico | |
| Europe | France |
| Germany | |
| Italy | |
| Russia | |
| United Kingdom | |
| Rest of Europe | |
| South America | Brazil |
| Argentina | |
| Rest of South America | |
| Middle-East and Africa | Saudi Arabia |
| South Africa | |
| Rest of Middle-East and Africa |
| By Product Form | Granular/Molded PTFE | |
| Fine Powder/Dispersion PTFE | ||
| Micronized Powder PTFE | ||
| Aqueous Dispersion PTFE | ||
| By End-User Industry | Aerospace | |
| Automotive | ||
| Building and Construction | ||
| Electrical and Electronics | ||
| Industrial and Machinery | ||
| Packaging | ||
| Other End-user Industries | ||
| By Geography | Asia-Pacific | China |
| India | ||
| Japan | ||
| South Korea | ||
| Rest of Asia-Pacific | ||
| North America | United States | |
| Canada | ||
| Mexico | ||
| Europe | France | |
| Germany | ||
| Italy | ||
| Russia | ||
| United Kingdom | ||
| Rest of Europe | ||
| South America | Brazil | |
| Argentina | ||
| Rest of South America | ||
| Middle-East and Africa | Saudi Arabia | |
| South Africa | ||
| Rest of Middle-East and Africa | ||


Market Definition
- End-user Industry - Building & Construction, Packaging, Automotive, Aerospace, Industrial Machinery, Electrical & Electronics, and Others are the end-user industries considered under the polytetrafluoroethylene market.
- Resin - Under the scope of the study, virgin polytetrafluoroethylene resin in the primary forms such as liquid, powder, pellet, etc. are considered.
| Keyword | Definition |
|---|---|
| Acetal | This is a rigid material that has a slippery surface. It can easily withstand wear and tear in abusive work environments. This polymer is used for building applications such as gears, bearings, valve components, etc. |
| Acrylic | This synthetic resin is a derivative of acrylic acid. It forms a smooth surface and is mainly used for various indoor applications. The material can also be used for outdoor applications with a special formulation. |
| Cast film | A cast film is made by depositing a layer of plastic onto a surface then solidifying and removing the film from that surface. The plastic layer can be in molten form, in a solution, or in dispersion. |
| Colorants & Pigments | Colorants & Pigments are additives used to change the color of the plastic. They can be a powder or a resin/color premix. |
| Composite material | A composite material is a material that is produced from two or more constituent materials. These constituent materials have dissimilar chemical or physical properties and are merged to create a material with properties unlike the individual elements. |
| Degree of Polymerization (DP) | The number of monomeric units in a macromolecule, polymer, or oligomer molecule is referred to as the degree of polymerization or DP. Plastics with useful physical properties often have DPs in the thousands. |
| Dispersion | To create a suspension or solution of material in another substance, fine, agglomerated solid particles of one substance are dispersed in a liquid or another substance to form a dispersion. |
| Fiberglass | Fiberglass-reinforced plastic is a material made up of glass fibers embedded in a resin matrix. These materials have high tensile and impact strength. Handrails and platforms are two examples of lightweight structural applications that use standard fiberglass. |
| Fiber-reinforced polymer (FRP) | Fiber-reinforced polymer is a composite material made of a polymer matrix reinforced with fibers. The fibers are usually glass, carbon, aramid, or basalt. |
| Flake | This is a dry, peeled-off piece, usually with an uneven surface, and is the base of cellulosic plastics. |
| Fluoropolymers | This is a fluorocarbon-based polymer with multiple carbon-fluorine bonds. It is characterized by high resistance to solvents, acids, and bases. These materials are tough yet easy to machine. Some of the popular fluoropolymers are PTFE, ETFE, PVDF, PVF, etc. |
| Kevlar | Kevlar is the commonly referred name for aramid fiber, which was initially a Dupont brand for aramid fiber. Any group of lightweight, heat-resistant, solid, synthetic, aromatic polyamide materials that are fashioned into fibers, filaments, or sheets is called aramid fiber. They are classified into Para-aramid and Meta-aramid. |
| Laminate | A structure or surface composed of sequential layers of material bonded under pressure and heat to build up to the desired shape and width. |
| Nylon | They are synthetic fiber-forming polyamides formed into yarns and monofilaments. These fibers possess excellent tensile strength, durability, and elasticity. They have high melting points and can resist chemicals and various liquids. |
| PET preform | A preform is an intermediate product that is subsequently blown into a polyethylene terephthalate (PET) bottle or a container. |
| Plastic compounding | Compounding consists of preparing plastic formulations by mixing and/or blending polymers and additives in a molten state to achieve the desired characteristics. These blends are automatically dosed with fixed setpoints usually through feeders/hoppers. |
| Plastic pellets | Plastic pellets, also known as pre-production pellets or nurdles, are the building blocks for nearly every product made of plastic. |
| Polymerization | It is a chemical reaction of several monomer molecules to form polymer chains that form stable covalent bonds. |
| Styrene Copolymers | A copolymer is a polymer derived from more than one species of monomer, and a styrene copolymer is a chain of polymers consisting of styrene and acrylate. |
| Thermoplastics | Thermoplastics are defined as polymers that become soft material when it is heated and becomes hard when it is cooled. Thermoplastics have wide-ranging properties and can be remolded and recycled without affecting their physical properties. |
| Virgin Plastic | It is a basic form of plastic that has never been used, processed, or developed. It may be considered more valuable than recycled or already used materials. |


Research Methodology
Mordor Intelligence follows a four-step methodology in all our reports.
- Step-1: Identify Key Variables: The quantifiable key variables (industry and extraneous) pertaining to the specific product segment and country are selected from a group of relevant variables & factors based on desk research & literature review; along with primary expert inputs. These variables are further confirmed through regression modeling (wherever required).
- Step-2: Build a Market Model: In order to build a robust forecasting methodology, the variables and factors identified in Step-1 are tested against available historical market numbers. Through an iterative process, the variables required for market forecast are set and the model is built on the basis of these variables.
- Step-3: Validate and Finalize: In this important step, all market numbers, variables and analyst calls are validated through an extensive network of primary research experts from the market studied. The respondents are selected across levels and functions to generate a holistic picture of the market studied.
- Step-4: Research Outputs: Syndicated Reports, Custom Consulting Assignments, Databases & Subscription Platforms


