Market Overview
| Study Period | 2020 - 2031 |
|---|---|
| Forecast Data Period | 2026 - 2031 |
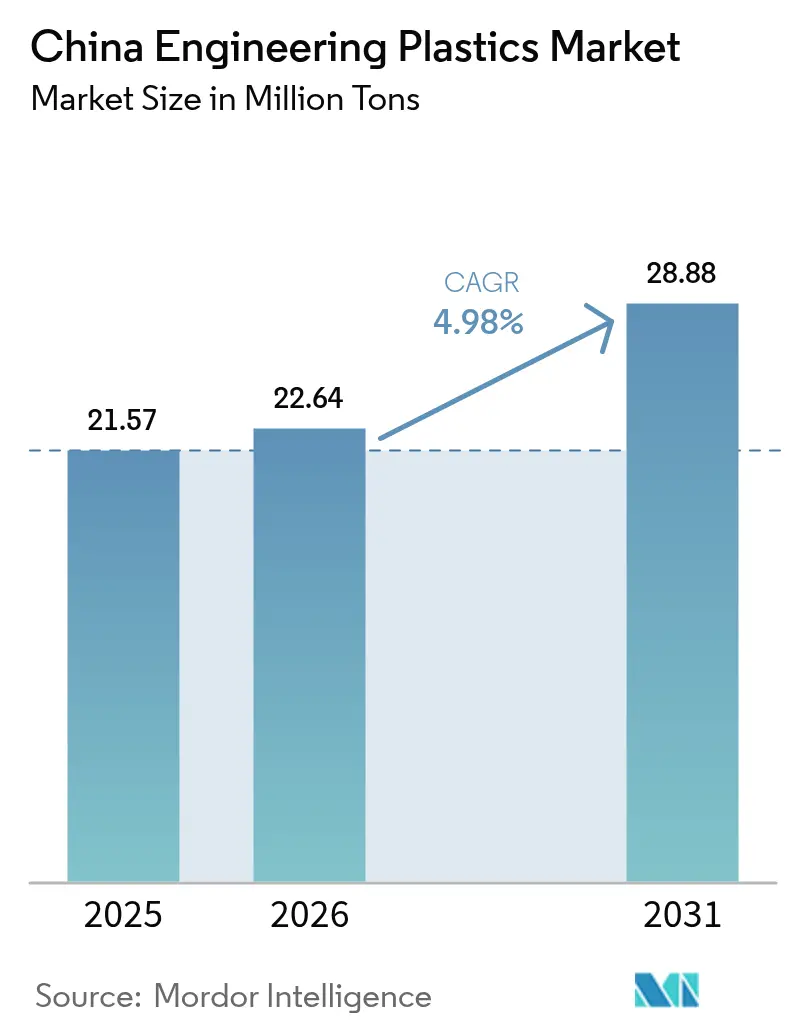
| Base Year Market Size (2025) | 21.57 Million tons |
| Market Volume (2026) | 22.64 Million tons |
| Market Volume (2031) | 28.88 Million tons |
| Growth Rate (2026 - 2031) | 4.98% CAGR |
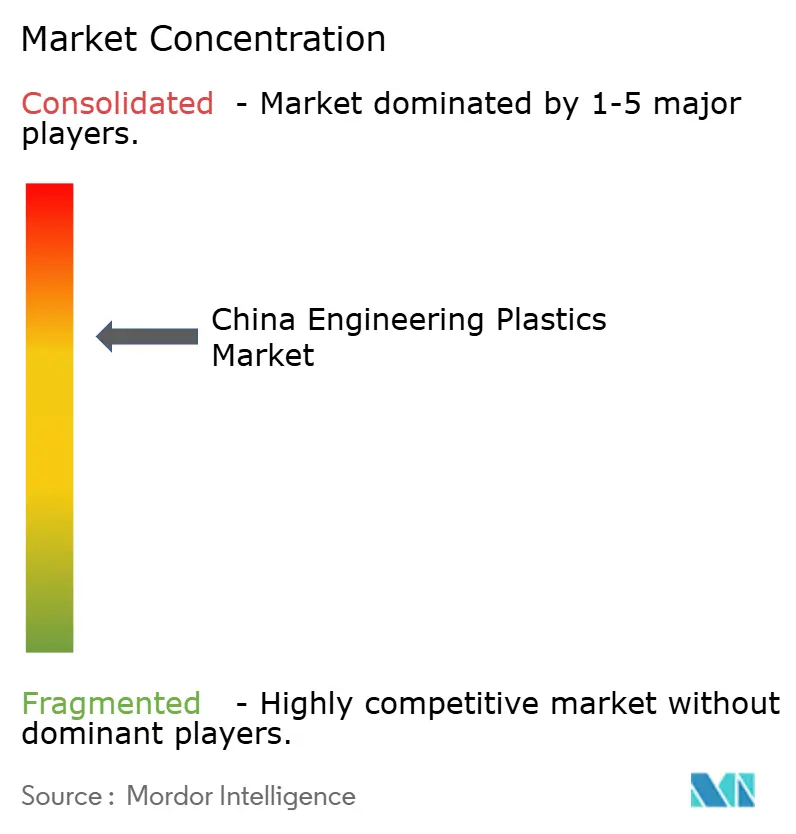
| Market Concentration | Medium |
Major Players *Disclaimer: Major Players sorted in no particular order Image © Mordor Intelligence. Reuse requires attribution under CC BY 4.0. | |
China Engineering Plastics Market Analysis by Mordor Intelligence
The China Engineering Plastics Market size was valued at 21.57 million tons in 2025 and estimated to grow from 22.64 million tons in 2026 to reach 28.88 million tons by 2031, at a CAGR of 4.98% during the forecast period (2026-2031). This steady expansion reflects Beijing’s policy mix of industrial upgrading, technology sovereignty, and circular-economy mandates that collectively pull demand for high-performance resins into fast-growing sectors such as electric vehicles, 5G infrastructure, and precision manufacturing. The market’s volume-based growth also highlights a visible migration from commodity polymers toward higher-margin engineering grades that satisfy tight performance windows on heat resistance, dielectric stability, and mechanical strength. Intensifying local competition is accelerating product innovation because multinational license holders and domestic newcomers alike must pair price discipline with technical differentiation to defend share. Capacity that entered service in 2024-2025, including BASF’s Zhanjiang Verbund and several Sinopec projects, is improving supply security, yet the China engineering plastics market still depends on imports for certain fluoropolymer, LCP and high-temperature resin grades.
Key Report Takeaways
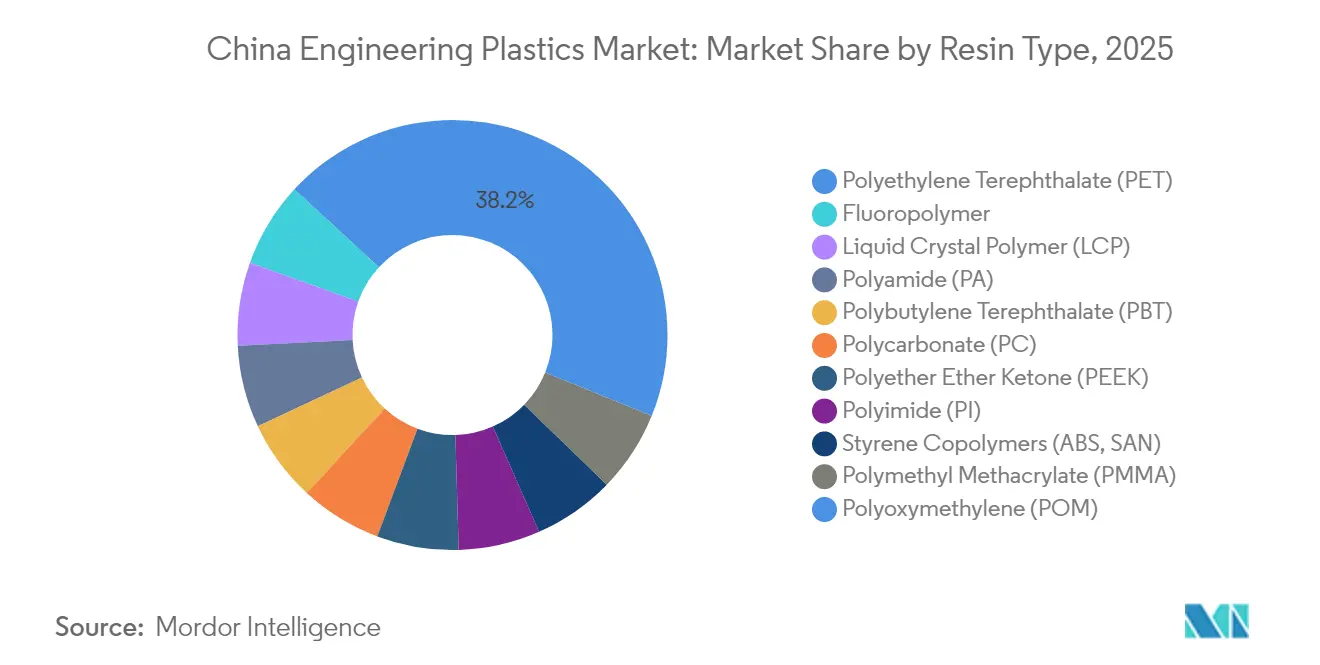
- By resin type, polyethylene terephthalate captured 38.15% of the China engineering plastics market share in 2025, while fluoropolymers are projected to register the fastest 9.04% CAGR through 2031.
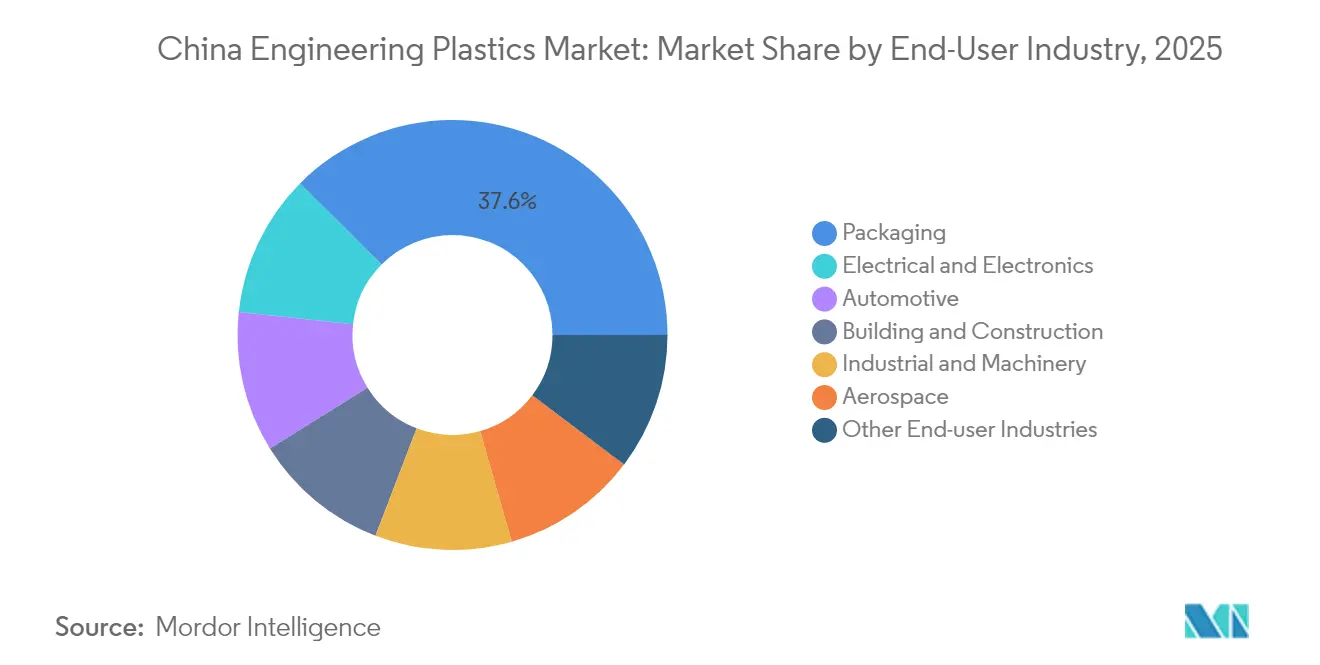
- By end-user industry, packaging accounted for a 37.55% slice of the China engineering plastics market size in 2025, whereas electrical and electronics is expected to grow the quickest at 7.02% CAGR through 2031.
Note: Market size and forecast figures in this report are generated using Mordor Intelligence’s proprietary estimation framework, updated with the latest available data and insights as of 2026.
China Engineering Plastics Market Trends and Insights
Drivers Impact Analysis*
| Driver | (~) % Impact on CAGR Forecast | Geographic Relevance | Impact Timeline |
|---|---|---|---|
| EV-led lightweighting boom | +1.20% | Guangdong, Jiangsu, Shanghai | Medium term (2-4 years) |
| 5G & miniaturized electronics demand | +0.80% | Shenzhen, Beijing, Shanghai | Short term (≤ 2 years) |
| High-speed rail & aerospace localization | +0.60% | Beijing-Tianjin-Hebei, Yangtze River Delta | Long term (≥ 4 years) |
| Government incentives for service-robot makers | +0.40% | Tier-1 pilot cities | Medium term (2-4 years) |
| IC substrate LCP film localisation push | +0.30% | Regional, concentrated in Jiangsu, Guangdong electronics hubs | Short term (≤ 2 years) |
| Source: Mordor Intelligence | |||


EV-led Lightweighting Boom
Surging electric-vehicle output is an unmistakable catalyst for the China engineering plastics market because OEMs specify lighter and stronger polymers to extend driving range and shave assembly costs. Battery packs, structural housings and in-cabin trim increasingly substitute steel and aluminum with glass-filled polycarbonate, carbon-fiber-reinforced polyamide and flame-retardant PC/ABS. LG Chem’s PFAS-free PC/ABS blend, which integrates 50% post-consumer recyclate, demonstrates how sustainability and performance now converge in sourcing decisions for EV chargers. Celanese is co-developing ultra-low-emission polyoxymethylene for Li Auto, indicating that emission standards inside vehicle cabins matter as much as weight savings[1]Celanese Corporation, “Celanese and Li Auto Collaborate to Advance Ultra-Low Emission Innovation in New Energy Vehicles,” celanese.com . The same trend is enlarging the fluoropolymer addressable space because cooling loops and high-voltage wiring need superior dielectric strength and thermal stability. Subsidies for new-energy vehicles approved through 2027 secure a structural pull for engineering-grade resins, anchoring a long runway for the China engineering plastics market.
5G & Miniaturized Electronics Demand
Rapid 5G roll-out compresses component footprints and pushes dielectric performance limits, thereby lifting demand for liquid crystal polymer (LCP), polyphenylene sulfide and other high-frequency resins. Zenite LCP 16236(N) from Celanese provides 30-40% higher flow to mold connectors with finer pitch, permitting more antenna elements per square millimeter. Shenzhen’s contract electronics assemblers are qualifying PEEK and modified polycarbonate for heat-spreader frames within millimeter-wave modules, a design shift that fortifies premium pricing for specialty grades. The policy drive for domestic IC substrate capacity further reinforces LCP demand, linking telecommunications and semiconductor capex cycles into a single market vector. Consequently, the China engineering plastics market sees robust near-term volume lift despite the cyclical smartphone downturn, because infrastructure hardware absorbs much of the incremental resin tonnage.
High-speed Rail & Aerospace Localization
China’s 42,000 km high-speed rail network extension and the COMAC C919 commercial jet program carry stringent flame-smoke-toxicity thresholds that commodity polymers cannot meet. Polyetheretherketone and polyimide thus gain adoption in interior panels, cable sheathing and under-car components that must survive vibration, humidity and wide temperature swings. Although bio-based PEEK variants promise lower lifecycle emissions, the multi-year aerospace certification pathway is slowing their substitution speed. Domestic resin makers are investing upstream into key monomers to curtail reliance on imported intermediates, aligning with Beijing’s localization mandate. Long-term production contracts with rolling-stock manufacturers grant pricing visibility, allowing suppliers to amortize capital for new compounding lines. Overall, localization momentum injects durable demand into the China engineering plastics market, particularly for high-temperature, fire-safe grades.
Government Incentives for Service-Robot Makers
Tax credits and procurement quotas for service-robot platforms are reshaping materials demand in medical, hospitality, and elder-care devices. Designers favor polycarbonates and high-impact polyamides that offer tight dimensional tolerance, pleasant surface finish, and biocompatibility. Municipal grants in Shanghai and Beijing reimburse up to 20% of qualified robotics R&D spend, motivating local plastics compounders to meet UL 94 V-0 flammability and ISO 10993 biocompatibility targets simultaneously. Domestic sourcing preference reduces geopolitical risk exposure for robot OEMs, and in turn boosts contract volumes for Chinese resin manufacturers able to certify to international standards. This program adds incremental yet sticky volume to the China engineering plastics market because after-sales parts and design refresh cycles continually re-order specialty grades.
Restraints Impact Analysis*
| Restraint | (~) % Impact on CAGR Forecast | Geographic Relevance | Impact Timeline |
|---|---|---|---|
| Feed-stock price volatility | -0.90% | National, affecting all production regions | Short term (≤ 2 years) |
| ABS & PC domestic over-capacity | -0.60% | Regional, concentrated in Yangtze River Delta, Pearl River Delta | Medium term (2-4 years) |
| Slow aerospace certification for bio-PEEK | -0.20% | National, affecting aerospace manufacturing hubs | Long term (≥ 4 years) |
| Source: Mordor Intelligence | |||
Feed-stock Price Volatility
Sharp swings in crude-linked naphtha and benzene costs can erase margins because feedstocks often account for two-thirds of polymer conversion expense. BPA price spikes in 2024 took polycarbonate converters by surprise and forced temporary output cuts despite strong downstream call-offs. Exchange-rate movements add complexity when specialized monomers are imported against U.S.-dollar invoicing. In response, Sinopec and several private refiners are pursuing deeper backward integration into C4 and aromatics chains to secure input barrels at advantaged cost. Larger processors hedge oil exposure with long-dated futures, yet smaller compounders lack financial depth, leading to uneven pass-through behavior that clouds pricing visibility in the China engineering plastics market.
ABS & PC Domestic Over-capacity
More than 3 million tons per year of ABS and polycarbonate nameplate capacity came online between 2020-2024, overshooting domestic consumption growth and setting off aggressive price discounting. Smaller, single-line producers struggle to load plants above 60%, creating cash-flow stress and motivating talk of shutdowns or mergers. Export channels cannot fully absorb the surplus because anti-dumping duties constrain volume into North America and the European Union. Tier-one multinationals defend premium niches via differentiated flame-retardant and optical-grade offerings, but general-purpose grades now trade near variable cash cost. Over-supply therefore squeezes working capital and may defer fresh investment, placing a mild brake on the China engineering plastics market until capacity rationalizes.
*Our forecasts treat driver/restraint impacts as directional, not additive. The impact forecasts reflect baseline growth, mix effects, and variable interactions.
Segment Analysis
By Resin Type: PET Dominance Meets Fluoropolymer Innovation
Polyethylene terephthalate held a commanding 38.15% slice of the China engineering plastics market share in 2025, and its ubiquitous role in beverage packaging and automotive fiber reinforcement kept volumes resilient despite slower consumer spending. The segment also captures rising demand for recycled content because bottle-grade rPET can be re-melted into injection-molded housings for consumer electronics. Meanwhile, fluoropolymers are set to post a 9.04% CAGR to 2031, the highest of any resin category, because semiconductor wet-process piping, high-purity chemical drums and battery-cooling tubes require extreme chemical and thermal resistance. Such specialized use cases command premium prices that buffer producers from the commodity price swings haunting other resins.
The China engineering plastics market size for fluoropolymers is small in tonnage but large in value, prompting both global majors and agile domestic firms to plan new dispersion and compounding lines near electronics hubs in Jiangsu and Guangdong. Liquid crystal polymer also maintains double-digit growth, driven by 5G antenna miniaturization needs, yet supply tightness lingers because only a handful of licensors control key oligomer recipes. Polycarbonate and polyamide face profit pressure due to the over-capacity explained earlier, but their role in lightweight vehicle glazing and engine covers still yields stable baseline demand. As a result, the resin portfolio displays a clear two-speed pattern: high-volume PET anchors baseline tonnage, while niche, high-performance resins deliver outsized margin and technology leadership within the China engineering plastics market.


By End-User Industry: Packaging Leadership Challenged by Electronics Surge
Packaging contributed 37.55% of the China engineering plastics market size in 2025 as brand-owners continued to favor lighter, tougher containers that travel efficiently across vast domestic logistics networks. Strict food-contact compliance and a nationwide drive to cut single-use plastics intensified R&D into mono-material PET and high-barrier coatings that improve recyclability. Conversely, electrical and electronics recorded the sharpest trajectory, charting a 7.02% CAGR for the forecast period thanks to 5G roll-out, datacenter construction and domestic semiconductor fab expansions. Design engineers increasingly swap legacy metal chassis for high-creep-resistance polyphthalamide and heat-dissipating polycarbonate blends, further pulling demand.
Automotive applications remain a dependable second-tier growth pillar as OEMs pursue weight reduction across interior and powertrain modules. Building and construction applications—particularly thermal-insulating profiles and flame-retardant wiring channels—track urban redevelopment activity and increasingly reference green building codes. Aerospace is still niche in tonnage yet lucrative; mandated smoke-toxicity thresholds and stringent part-qualification cycles keep barriers high, protecting incumbent suppliers. Together, these patterns diversify the China engineering plastics market, reducing reliance on a single end-user and smoothing cyclical shocks tied to consumer demand.
Geography Analysis
Production of engineering plastics is geographically concentrated yet gradually diffusing inland. The Yangtze River Delta, anchored by Shanghai, Jiangsu, and Zhejiang, remains the epicenter for high-value grades because of its research talent, wafer-fab clusters, and integrated petrochemical feedrails. Polycarbonate, LCP and specialty nylons flow from this zone into precision electronics and medical-device factories located within a one-day trucking radius. Guangdong’s Pearl River Delta emphasizes large-scale, cost-focused compounding that feeds appliance, toy and automotive export lines; its proximity to Hong Kong ports quickens export document turnaround and provides attractive financing options for working capital.
The Beijing-Tianjin-Hebei corridor is scaling fast in response to central-government plans to de-congest coastal megacities and nurture advanced manufacturing in the north. Aerospace-qualified PEEK lines and high-temperature polyimide film units commissioned in 2024-2025 tap research institutes clustered around Beijing, ensuring an educated labor pool and ready access to certification labs. Inland hubs such as Chongqing and Sichuan blend lower land costs with growing transport linkages, making them viable choices for second-phase expansion by resin compounders looking to penetrate western provinces.
Even as logistical nodes multiply, the China engineering plastics market still exhibits coastal bias because international suppliers import high-purity intermediates via Shanghai and Ningbo terminals. However, the rise of cross-country high-speed freight rail has cut transit times from the coast to interior cities to under 48 hours, blunting previous cost obstacles. Regional governments compete through tax holidays and green electricity quotas, hoping to lure plants that can seed broader polymer processing ecosystems. This unfolding geographic diversification ultimately mitigates supply-chain risk and positions the market for more balanced national growth.
Competitive Landscape
The China engineering plastics market exhibits moderately fragmented concentration. Multinational incumbents—BASF, SABIC, LG Chem, Celanese and LyondellBasell—bank on proprietary catalysts and brand trust to defend premium niches, especially in automotive and semiconductor channels. Domestic producers such as Sinopec, Chang Chun Group and Kingfa concentrate on cost leadership and agile customer service to win share from price-sensitive converters. Joint-venture models are common, allowing foreign licensors to stay close to demand while navigating regulatory requirements on data security and environmental compliance.
Sustainability is now a mandatory competitive axis. LG Chem’s commercial demonstration of 100% plant-based acrylic acid positions it to capture cosmetic and adhesive formulators that must hit aggressive carbon-reduction targets. Celanese released recycled-content POM and renewable-feedstock LCP ranges that enable OEMs to pursue circularity pledges without compromising performance. BASF’s verbund site integrates cracker, monomer and compounding assets with renewable electricity, cutting cradle-to-gate emissions for key engineering plastics by up to 30%[2]BASF SE, “Material Investments and Portfolio Measures – BASF Report 2024,” basf.com . Collectively, these moves indicate that technical innovation is inseparable from environmental credentials in winning long-term supply awards.
Strategic investments favor upstream integration and regional proximity. LyondellBasell licensed Hostalen ACP technology to China Energy Group for composite polyolefin production destined for high-pressure pipe, building insulation and EV coolant tanks. Sinopec is scaling aniline and MDI capacity to secure inputs for polycarbonate and polyurethanes, lowering import dependence. Meanwhile, privately-held compounders specialize in color-matched, laser-weldable and EMI-shielded grades that conventional producers overlook. Against this backdrop, the China engineering plastics market rewards both scale economies and sharp specialization, ensuring active deal-flow in alliances, minority stakes, and technology licensing for the foreseeable future.
China Engineering Plastics Industry Leaders
CHIMEI
China Petroleum & Chemical Corporation
Covestro AG
Formosa Plastics Group
PetroChina Company Limited
- *Disclaimer: Major Players sorted in no particular order

Recent Industry Developments
- April 2024: DOMO Chemicals has inaugurated its new facility in Haiyan, Jiaxing, Zhejiang, China. The plant spans 40,000 square meters and has a production capacity of 35 kilotons for TECHNYL polyamide-based grades.
- April 2024: Celanese unveiled its advanced engineering materials at CHINAPLAS 2024, including Vectra LCP ECO-B with 60% renewable content and Zytel High Performance Nylons, which offer a 30% weight reduction for consumer electronics applications.


China Engineering Plastics Market Report Scope
Aerospace, Automotive, Building and Construction, Electrical and Electronics, Industrial and Machinery, Packaging are covered as segments by End User Industry. Fluoropolymer, Liquid Crystal Polymer (LCP), Polyamide (PA), Polybutylene Terephthalate (PBT), Polycarbonate (PC), Polyether Ether Ketone (PEEK), Polyethylene Terephthalate (PET), Polyimide (PI), Polymethyl Methacrylate (PMMA), Polyoxymethylene (POM), Styrene Copolymers (ABS and SAN) are covered as segments by Resin Type.By Resin Type
| Fluoropolymer | Ethylenetetrafluoroethylene (ETFE) |
| Fluorinated Ethylene-propylene (FEP) | |
| Polytetrafluoroethylene (PTFE) | |
| Polyvinylfluoride (PVF) | |
| Polyvinylidene Fluoride (PVDF) | |
| Other Sub Resin Types | |
| Liquid Crystal Polymer (LCP) | |
| Polyamide (PA) | Aramid |
| Polyamide (PA) 6 | |
| Polyamide (PA) 66 | |
| Polyphthalamide | |
| Polybutylene Terephthalate (PBT) | |
| Polycarbonate (PC) | |
| Polyether Ether Ketone (PEEK) | |
| Polyethylene Terephthalate (PET) | |
| Polyimide (PI) | |
| Polymethyl Methacrylate (PMMA) | |
| Polyoxymethylene (POM) | |
| Styrene Copolymers (ABS, SAN) |
By End-User Industry
| Aerospace |
| Automotive |
| Building and Construction |
| Electrical and Electronics |
| Industrial and Machinery |
| Packaging |
| Other End-user Industries |
| By Resin Type | Fluoropolymer | Ethylenetetrafluoroethylene (ETFE) |
| Fluorinated Ethylene-propylene (FEP) | ||
| Polytetrafluoroethylene (PTFE) | ||
| Polyvinylfluoride (PVF) | ||
| Polyvinylidene Fluoride (PVDF) | ||
| Other Sub Resin Types | ||
| Liquid Crystal Polymer (LCP) | ||
| Polyamide (PA) | Aramid | |
| Polyamide (PA) 6 | ||
| Polyamide (PA) 66 | ||
| Polyphthalamide | ||
| Polybutylene Terephthalate (PBT) | ||
| Polycarbonate (PC) | ||
| Polyether Ether Ketone (PEEK) | ||
| Polyethylene Terephthalate (PET) | ||
| Polyimide (PI) | ||
| Polymethyl Methacrylate (PMMA) | ||
| Polyoxymethylene (POM) | ||
| Styrene Copolymers (ABS, SAN) | ||
| By End-User Industry | Aerospace | |
| Automotive | ||
| Building and Construction | ||
| Electrical and Electronics | ||
| Industrial and Machinery | ||
| Packaging | ||
| Other End-user Industries | ||


Market Definition
- End-user Industry - Packaging, Electrical & Electronics, Automotive, Building & Construction, and Others are the end-user industries considered under the engineering plastics market.
- Resin - Under the scope of the study, consumption of virgin resins like Fluoropolymer, Polycarbonate, Polyethylene Terephthalate, Polybutylene Terephthalate, Polyoxymethylene, Polymethyl Methacrylate, Styrene Copolymers, Liquid Crystal Polymer, Polyether Ether Ketone, Polyimide, and Polyamide in the primary forms are considered. Recycling has been provided separately under its individual chapter.
| Keyword | Definition |
|---|---|
| Acetal | This is a rigid material that has a slippery surface. It can easily withstand wear and tear in abusive work environments. This polymer is used for building applications such as gears, bearings, valve components, etc. |
| Acrylic | This synthetic resin is a derivative of acrylic acid. It forms a smooth surface and is mainly used for various indoor applications. The material can also be used for outdoor applications with a special formulation. |
| Cast film | A cast film is made by depositing a layer of plastic onto a surface then solidifying and removing the film from that surface. The plastic layer can be in molten form, in a solution, or in dispersion. |
| Colorants & Pigments | Colorants & Pigments are additives used to change the color of the plastic. They can be a powder or a resin/color premix. |
| Composite material | A composite material is a material that is produced from two or more constituent materials. These constituent materials have dissimilar chemical or physical properties and are merged to create a material with properties unlike the individual elements. |
| Degree of Polymerization (DP) | The number of monomeric units in a macromolecule, polymer, or oligomer molecule is referred to as the degree of polymerization or DP. Plastics with useful physical properties often have DPs in the thousands. |
| Dispersion | To create a suspension or solution of material in another substance, fine, agglomerated solid particles of one substance are dispersed in a liquid or another substance to form a dispersion. |
| Fiberglass | Fiberglass-reinforced plastic is a material made up of glass fibers embedded in a resin matrix. These materials have high tensile and impact strength. Handrails and platforms are two examples of lightweight structural applications that use standard fiberglass. |
| Fiber-reinforced polymer (FRP) | Fiber-reinforced polymer is a composite material made of a polymer matrix reinforced with fibers. The fibers are usually glass, carbon, aramid, or basalt. |
| Flake | This is a dry, peeled-off piece, usually with an uneven surface, and is the base of cellulosic plastics. |
| Fluoropolymers | This is a fluorocarbon-based polymer with multiple carbon-fluorine bonds. It is characterized by high resistance to solvents, acids, and bases. These materials are tough yet easy to machine. Some of the popular fluoropolymers are PTFE, ETFE, PVDF, PVF, etc. |
| Kevlar | Kevlar is the commonly referred name for aramid fiber, which was initially a Dupont brand for aramid fiber. Any group of lightweight, heat-resistant, solid, synthetic, aromatic polyamide materials that are fashioned into fibers, filaments, or sheets is called aramid fiber. They are classified into Para-aramid and Meta-aramid. |
| Laminate | A structure or surface composed of sequential layers of material bonded under pressure and heat to build up to the desired shape and width. |
| Nylon | They are synthetic fiber-forming polyamides formed into yarns and monofilaments. These fibers possess excellent tensile strength, durability, and elasticity. They have high melting points and can resist chemicals and various liquids. |
| PET preform | A preform is an intermediate product that is subsequently blown into a polyethylene terephthalate (PET) bottle or a container. |
| Plastic compounding | Compounding consists of preparing plastic formulations by mixing and/or blending polymers and additives in a molten state to achieve the desired characteristics. These blends are automatically dosed with fixed setpoints usually through feeders/hoppers. |
| Plastic pellets | Plastic pellets, also known as pre-production pellets or nurdles, are the building blocks for nearly every product made of plastic. |
| Polymerization | It is a chemical reaction of several monomer molecules to form polymer chains that form stable covalent bonds. |
| Styrene Copolymers | A copolymer is a polymer derived from more than one species of monomer, and a styrene copolymer is a chain of polymers consisting of styrene and acrylate. |
| Thermoplastics | Thermoplastics are defined as polymers that become soft material when it is heated and becomes hard when it is cooled. Thermoplastics have wide-ranging properties and can be remolded and recycled without affecting their physical properties. |
| Virgin Plastic | It is a basic form of plastic that has never been used, processed, or developed. It may be considered more valuable than recycled or already used materials. |


Research Methodology
Mordor Intelligence follows a four-step methodology in all our reports.
- Step-1: Identify Key Variables: The quantifiable key variables (industry and extraneous) pertaining to the specific product segment and country are selected from a group of relevant variables & factors based on desk research & literature review; along with primary expert inputs. These variables are further confirmed through regression modeling (wherever required).
- Step-2: Build a Market Model: In order to build a robust forecasting methodology, the variables and factors identified in Step-1 are tested against available historical market numbers. Through an iterative process, the variables required for market forecast are set and the model is built on the basis of these variables.
- Step-3: Validate and Finalize: In this important step, all market numbers, variables and analyst calls are validated through an extensive network of primary research experts from the market studied. The respondents are selected across levels and functions to generate a holistic picture of the market studied.
- Step-4: Research Outputs: Syndicated Reports, Custom Consulting Assignments, Databases & Subscription Platforms


