3D Printing Filament Market Size and Share
Market Overview
| Study Period | 2021 - 2031 |
|---|---|
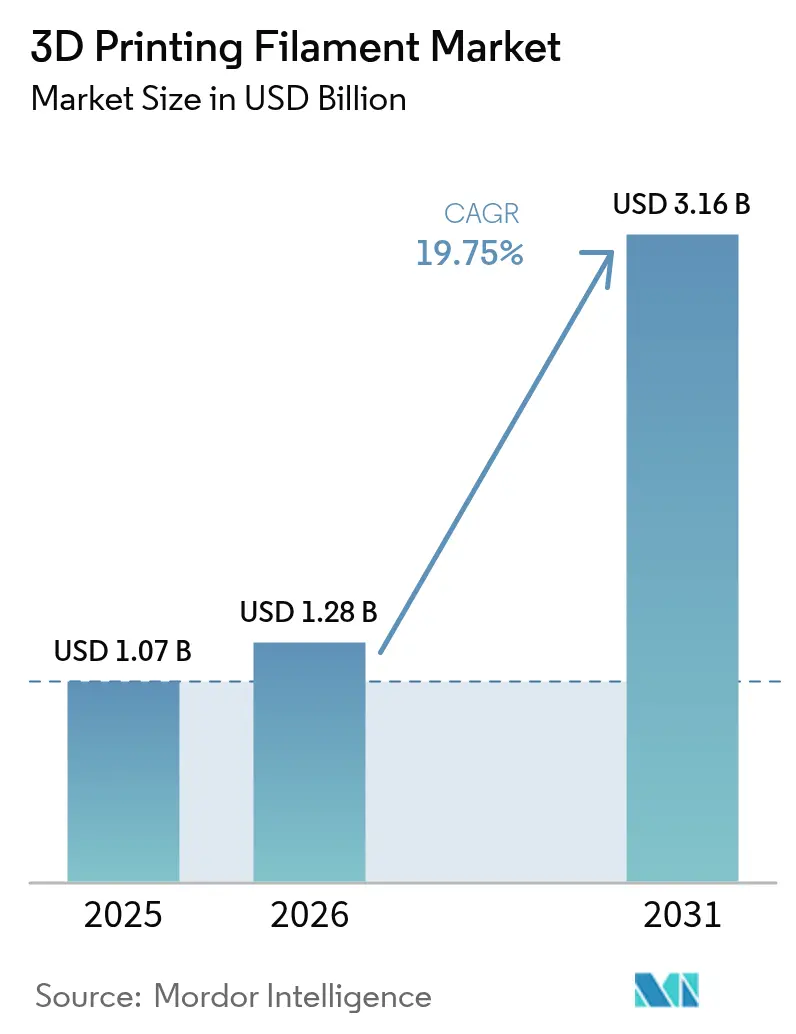
| Market Size (2026) | USD 1.28 Billion |
| Market Size (2031) | USD 3.16 Billion |
| Growth Rate (2026 - 2031) | 19.75% CAGR |
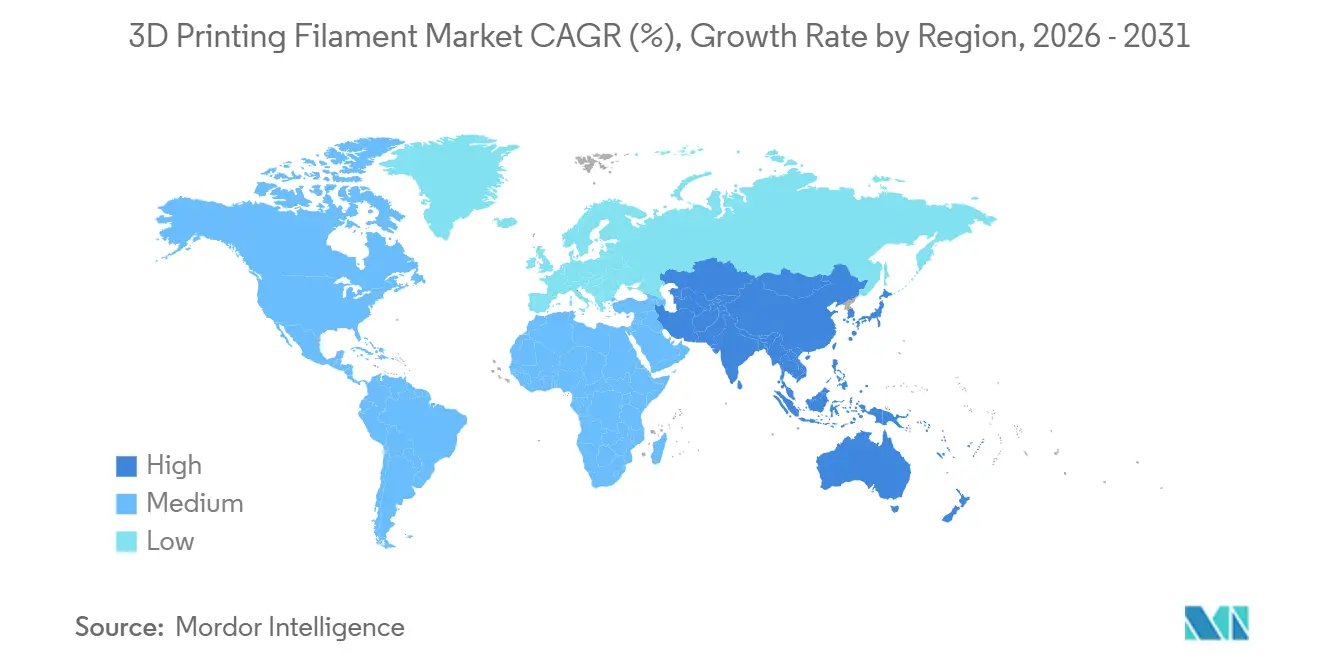
| Fastest Growing Market | Asia Pacific |
| Largest Market | Asia Pacific |
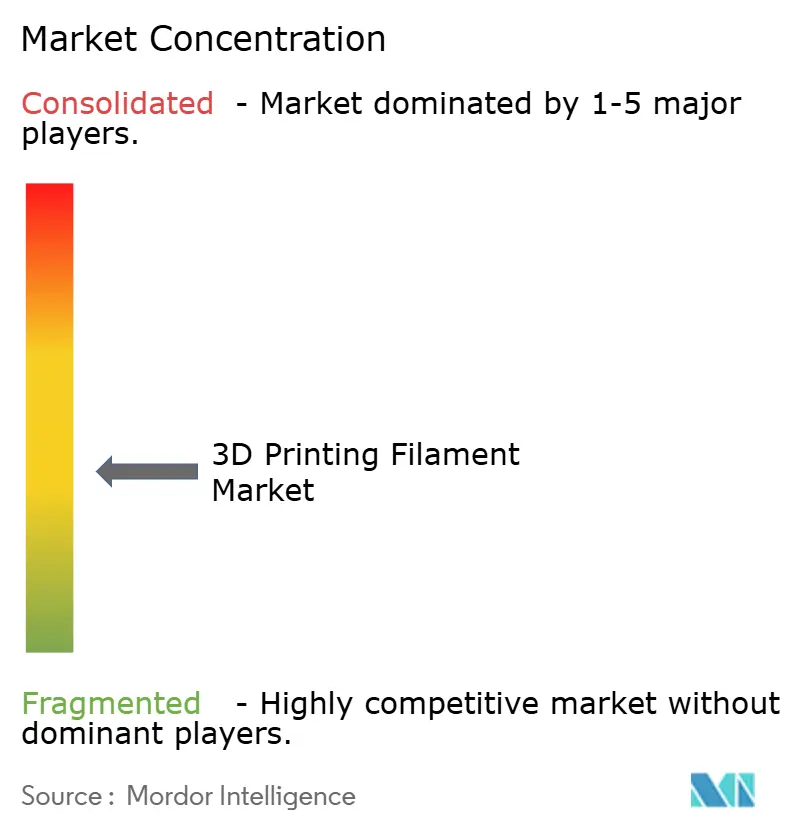
| Market Concentration | Medium |
Major Players *Disclaimer: Major Players sorted in no particular order Image © Mordor Intelligence. Reuse requires attribution under CC BY 4.0. | |
3D Printing Filament Market Analysis by Mordor Intelligence
The 3D Printing Filament Market size is projected to expand from USD 1.07 billion in 2025 and USD 1.28 billion in 2026 to USD 3.16 billion by 2031, registering a CAGR of 19.75% between 2026 to 2031. Industry players are shifting from using prototypes to serially producing certified components for aerospace, medical, and electronics applications. Aerospace leaders are now adopting fused-filament fabrication for critical flight parts, thanks to quicker material-qualification cycles. Medical-device designers are using implant-grade PEEK filaments to expedite regulatory processes and reduce tooling expenses. In the Asia-Pacific region, polymer producers are streamlining operations by co-locating resin synthesis with filament extrusion, leading to shorter lead times and just-in-time deliveries for contract manufacturers. Concurrently, in Europe and North America, sustainability mandates are pushing buyers toward bio-based or mechanically recycled materials. These alternatives promise reduced carbon footprints without sacrificing mechanical performance.
Key Report Takeaways
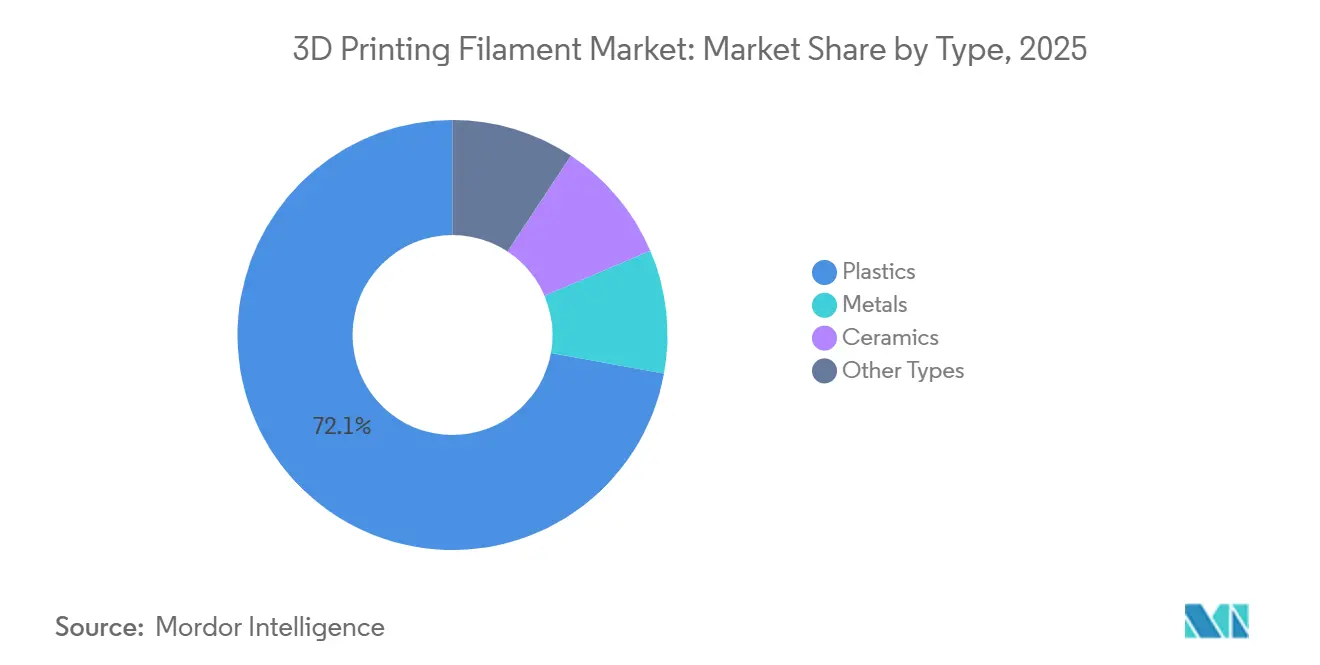
- By type, plastics held 72.12% of the 3D Printing Filament market share in 2025 and are projected to expand at a 21.38% CAGR in the forecast period (2026-2031).
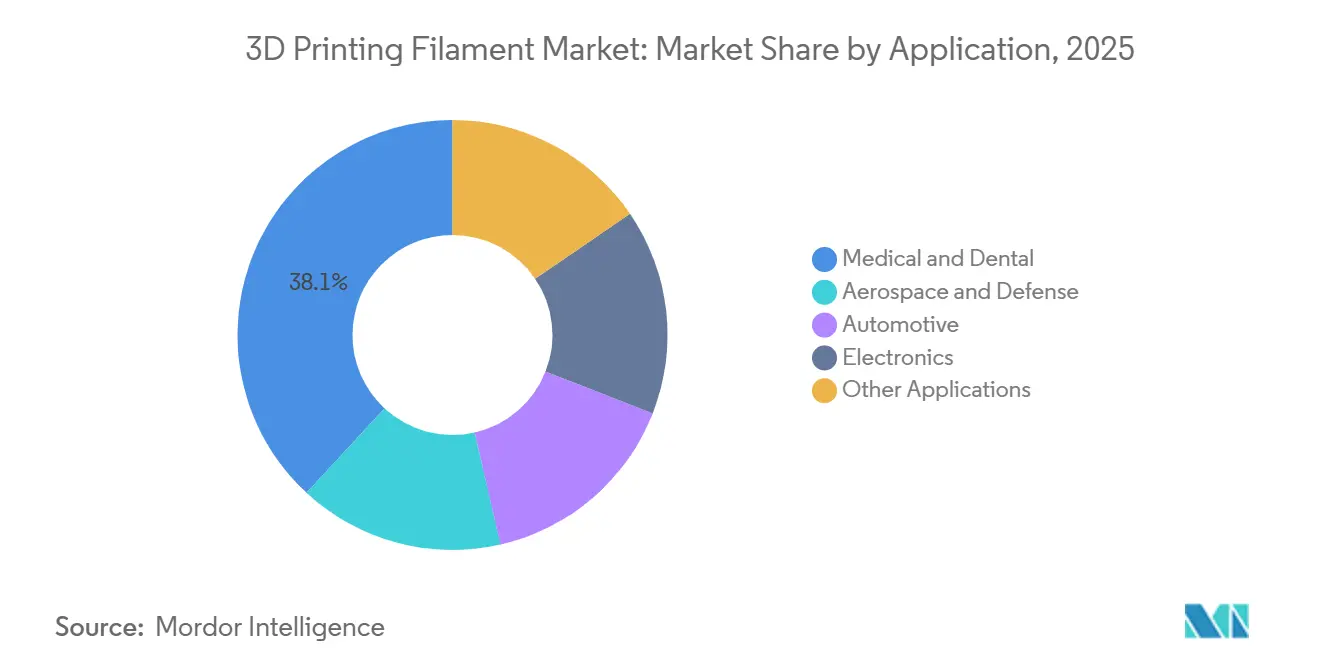
- By application, medical and dental accounted for a 38.12% share of the 3D Printing Filament market size in 2025 and are advancing at a 21.17% CAGR in the forecast period (2026-2031).
- By geography, Asia-Pacific generated 39.17% revenue in 2025 and is forecast to grow at a 20.83% CAGR in the forecast period (2026-2031).
Note: Market size and forecast figures in this report are generated using Mordor Intelligence’s proprietary estimation framework, updated with the latest available data and insights as of 2026.
Global 3D Printing Filament Market Trends and Insights
Drivers Impact Analysis*
| Drivers | (~) % Impact on CAGR Forecast | Geographic Relevance | Impact Timeline |
|---|---|---|---|
| Desktop and printer price erosion expands hobbyist base | +2.5% | Global, with concentration in North America and Europe | Medium term (2-4 years) |
| Sustainability demand for bio-based and recycled PLA/PET | +3.5% | Europe (regulatory driver), North America (corporate ESG), Asia-Pacific (production scale) | Long term (≥ 4 years) |
| Aerospace qualification of PEEK/PEKK filaments | +4.0% | North America (NASA, FAA), Europe (EASA), spillover to Asia-Pacific aerospace hubs | Medium term (2-4 years) |
| Carbon-negative algae-derived polyamide credits | +1.5% | Europe (carbon accounting frameworks), North America (voluntary markets) | Long term (≥ 4 years) |
| In-line rheology sensing cuts scrap to less than 2% | +2.0% | Global, led by North America and Europe industrial adopters | Short term (≤ 2 years) |
| Source: Mordor Intelligence | |||
Desktop And Printer Price Erosion Expands Hobbyist Base
By 2026, the global desktop printer market is projected to experience significant growth, primarily driven by the increasing availability of affordable entry-level models. This expansion is expected to sustain a consistent demand for standard commodity filaments, such as PLA and ABS, during the forecast period of 2026–2031. Concurrently, hobbyists are exploring specialized grades, experimenting with premium options like wood-filled, glow-in-the-dark, and flexible TPU. However, these advanced materials require frequent nozzle replacements, leading to higher maintenance costs. To address declining hardware margins, printer OEMs are shifting their focus toward material subscription models. At the same time, filament suppliers are balancing their portfolios by combining high-volume, low-margin PLA with premium engineering thermoplastics that offer higher profit margins.
Sustainability Demand For Bio-Based And Recycled PLA/PET
In Europe, the directives targeting single-use plastics, along with corporate ESG goals in North America, are driving the shift toward certified compostable and mechanically recycled filaments. Fillamentum’s OrCA, made entirely from recycled nylon, significantly reduces emissions compared to virgin PA6[1]Fillamentum, “0rCA® Recycled Nylon Filament,” fillamentumusa.com. Similarly, Braskem’s EVA filament, derived from sugarcane, highlights the dual benefits of bio-feedstocks - enhanced lightweight performance and improved carbon disclosure. Furthermore, pilot initiatives at U.S. universities demonstrate that mechanical recycling can preserve tensile strength nearly equivalent to that of virgin material across several cycles, reinforcing the credibility of circular-economy solutions in industrial applications.
Aerospace Qualification Of PEEK/PEKK Filaments
In May 2025, Stratasys and Lockheed Martin, after printing numerous coupons on the Fortus F900 platform, demonstrated that their Antero 840CN03 PEKK not only met NASA's outgassing standards but also satisfied the flame performance criteria of FAR 25.853[2]Stratasys, “Antero 840CN03 PEKK Qualification Data,” stratasys.com. Similarly, Evonik's VESTAKEEP i4 3DF, an implant-grade PEEK, was produced in ISO 13485 cleanrooms and is supported by an FDA Master Access File. These milestones highlight the growing acceptance of fused-filament fabrication as a legitimate production method, enabling it to command significant price premiums over traditional commodity polymers.
Carbon-Negative Algae-Derived Polyamide Credits
Lifecycle assessments indicate that algae-based polyamides can achieve net-negative carbon figures when accounting for photosynthetic CO2 capture. This presents a compelling opportunity for companies engaged in voluntary carbon markets. Spectrum Filaments’ PLA Nature ALGAE NORI, which is notable for its visible bio-fillers and food-safe certification, exemplifies early commercial efforts. Achieving algae cultivation levels comparable to petroleum-derived feedstocks remains a goal for the late 2020s; however, recent investments signal increasing momentum.
Restraints Impact Analysis*
| Restraints | (~) % Impact on CAGR Forecast | Geographic Relevance | Impact Timeline |
|---|---|---|---|
| Mechanical and thermal limits of commodity PLA/ABS | -1.5% | Global, particularly in price-sensitive hobbyist and education segments | Medium term (2-4 years) |
| Lactide-price volatility from Chinese corn tariffs | -1.0% | Global PLA supply chain, with acute impact on North America and Europe importers | Short term (≤ 2 years) |
| EU microplastics rules on single-use prints | -2.0% | Europe (direct regulatory impact), spillover to North America and Asia-Pacific through multinational compliance | Long term (≥ 4 years) |
| Source: Mordor Intelligence | |||
Mechanical And Thermal Limits Of Commodity PLA/ABS
PLA's glass-transition temperature and tensile strength restrict its application in functional parts exposed to heat or UV. ABS, while offering better impact resistance, emits styrene fumes during printing, making ventilation essential in schools. Although modified PLA formulations significantly reduce shrinkage, they still fall short of nylon or PEEK in terms of service temperatures. As a result, without major chemical advancements, commodity filaments are confined to low-stress prototyping.
Lactide-Price Volatility From Chinese Corn Tariffs
China, producing over half of the world's lactic acid, holds a commanding lead in the global market. This stronghold has left PLA suppliers susceptible to feedstock price swings, especially those swayed by corn tariffs. Early in 2025, spot prices experienced a notable spike. In reaction, producers sought diversification in their fermentation sources, opting for cassava and sugarcane. Larger resin manufacturers managed to cushion the blow by locking in long-term offtake contracts, whereas smaller filament producers struggled with the escalating costs.
*Our forecasts treat driver/restraint impacts as directional, not additive. The impact forecasts reflect baseline growth, mix effects, and variable interactions.
Segment Analysis
By Type: Plastics Sustain Dominance As Engineering Grades Multiply
In 2025, plastics commanded a dominant 72.12% share of the 3D printing filament market, with projections indicating a robust 21.38% CAGR during the forecast period of 2026–2031. The market's enthusiasm for plastic filaments largely stems from the adoption of engineering-grade materials, such as PEEK, PEKK, PEI, and TPU, in regulated sectors. These sectors prioritize traceable lot data and consistent mechanical profiles. Noteworthy examples include the use of application-specific grades that are now replacing the general-purpose PLA in high-demand areas, such as implants and aerospace covers.
While Polylactic Acid (PLA) remains the preferred choice in classrooms and hobbyist settings due to its low print temperatures and odorless processing, its mechanical limitations often lead users to adopt nylons or carbon-fiber composites. These alternatives are favored for crafting jigs, fixtures, and functional prototypes. Conversely, metals and ceramics serve a specialized role, focusing on tooling, semiconductor handling, and high-temperature insulation. In these applications, bound-powder filaments achieve sintered densities exceeding 80% metal content. Furthermore, as innovations in powder reusability and binder chemistries progress, the existing cost gaps are narrowing. This trend suggests a potential increase in market share for these materials; however, a complete surpassing of plastics before 2031 appears improbable.


By Application: Medical And Dental Maintain Leadership With Implant-Grade Certifications
In 2025, the medical and dental sectors commanded a 38.12% share of the 3D printing filament market, with projections indicating a robust CAGR of 21.17% during the forecast period of 2026–2031. Invibio’s PEEK-OPTIMA filament, a staple in millions of implants, highlights its proven biocompatibility. Additionally, the use of carbon-fiber-reinforced PEEK and the FDA-approved spine cages underscores the potential of pre-qualified materials and validated print profiles to accelerate device development from years to just months.
As applications in aerospace and defense broaden, PEKK and PEI filaments are demonstrating their capabilities by meeting stringent flame, smoke, and toxicity standards. Components crafted from these materials, now integrated into spacecraft, serve as a testament to the reliability of fused-filament technology in essential flight assemblies. The application spectrum is vast, encompassing automotive tooling, electronics enclosures, and consumer-goods prototyping. In this arena, TPU and flame-retardant nylon are making notable advancements. TPU is carving a niche in flexible seals, while flame-retardant nylon has secured the UL 94 V-0 certification for connectors.
Geography Analysis
In 2025, the Asia-Pacific region commanded a leading position with a 39.17% revenue share and is poised to achieve a robust 20.83% CAGR through the forecast period of 2026–2031. Producers, adopting a vertically integrated approach, are placing resin reactors adjacent to filament lines. This strategic move is evident as facilities prepare for a significant expansion of their resin reactor capacities over the next decade. Suppliers are taking proactive steps, evident in the expansions of recycled polyester yarn production, to ensure compliance with EU standards from the source. While China's dominance in lactic acid solidifies its cost leadership in PLA, fluctuations in tariffs are prompting a diversification trend in Southeast Asia.
In 2025, North America secured a substantial market share, largely driven by the aerospace and medical sectors, both of which emphasize rigorous certification documentation. The Department of Defense's programs underscore the tangible demand for advanced materials in aerospace, guaranteeing a consistent, multi-year need for filaments. Regional acquisitions have not only bolstered the presence but have also broadened portfolios to encompass medical-grade nylons. To mitigate the impact of elevated labor and energy costs, especially when compared with the Asia-Pacific, there is a marked shift towards automating extrusion processes and conducting in-line inspections, all in a bid to safeguard profit margins.
Europe, in 2025, held a significant market share. Navigating the regulatory landscapes of REACH and the Single-Use Plastics Directive, the region is rapidly transitioning to bio-based and recycled materials. This transition is particularly advantageous for innovators whose offerings demonstrate notable carbon reductions. The trend of consolidation is evident, with strategic acquisitions, particularly in high-performance thermoplastics, gaining momentum within the EU. Furthermore, production facilities' commitments to renewable energy are amplifying the importance of cradle-to-gate carbon disclosures, a feature that is becoming increasingly valued by the automotive and electronics industries.

Competitive Landscape
The 3D Printing Filament Market is moderately fragmented. Open-platform alliances challenge the dominance of closed ecosystems. Start-ups are now able to expand desktop FFF hardware into the realm of metals, avoiding the requirement for expensive six-figure printers. This shift is lowering entry barriers for smaller machine shops. Today, the focus has shifted from mere print speed to ensuring process reliability. Innovations such as inline rheology sensors, machine-vision defect prediction, and AI-driven parameter tuning are setting apart hardware and material packages. These advancements ensure a consistent, audited quality of parts, even over extended multi-shift production runs.
3D Printing Filament Industry Leaders
BASF
Stratasys
NatureWorks LLC
Polymaker
3DXTECH
- *Disclaimer: Major Players sorted in no particular order

Recent Industry Developments
- July 2025: Polymaker unveiled its Fiberon PA612-ESD 3D printing filament, tailored for industrial applications demanding ESD protection. Such ESD-safe materials play a crucial role in protecting electronic components. The Fiberon PA612-ESD filament establishes an internal network adept at safely dissipating electrical charges.
- May 2025: At RAPID + TCT 2025 in Detroit, United States, Amolen, a manufacturer specializing in 3D printing filaments, introduced two new thermoplastic polyurethane (TPU) products: the Glow-in-the-Dark Series and the Transparent Series. These new additions are part of Amolen's growing S-Series lineup.


Global 3D Printing Filament Market Report Scope
3D printer filament is a type of printing material used by the FFF-type 3D printer. It is one of the most common 3D printing materials in the world. It is mostly made of thermoplastic. However, metal, ceramics, and other materials are also used to make 3D printing filaments.
The market is segmented by type, application, and geography. By type, the market is segmented into metals, plastics, ceramics, and other types. By application, the market is segmented into aerospace and defense, automotive, medical and dental, electronics, and other applications. The report also covers the market size and forecasts for the market in 28 countries across major regions. For each segment, the market sizing and forecasts are done based on revenue (USD).
| Metals | Titanium |
| Stainless Steel | |
| Other Metals | |
| Plastics | Polyethylene Terephthalate (PET) |
| Polylactic Acid (PLA) | |
| Acrylonitrile Butadiene Styrene (ABS) | |
| Nylon | |
| Other Plastics | |
| Ceramics | |
| Other Types |
| Aerospace and Defense |
| Automotive |
| Medical and Dental |
| Electronics |
| Other Applications |
| Asia-Pacific | China |
| India | |
| Japan | |
| South Korea | |
| Australia | |
| Malaysia | |
| Thailand | |
| Vietnam | |
| Indonesia | |
| Rest of Asia-Pacific | |
| North America | United States |
| Canada | |
| Mexico | |
| Europe | Germany |
| United Kingdom | |
| France | |
| Italy | |
| Spain | |
| Russia | |
| Nordics | |
| Turkey | |
| Rest of Europe | |
| South America | Brazil |
| Argentina | |
| Colombia | |
| Rest of South America | |
| Middle-East and Africa | Saudi Arabia |
| United Arab Emirates | |
| Qatar | |
| South Africa | |
| Nigeria | |
| Egypt | |
| Rest of Middle-East and Africa |
| By Type | Metals | Titanium |
| Stainless Steel | ||
| Other Metals | ||
| Plastics | Polyethylene Terephthalate (PET) | |
| Polylactic Acid (PLA) | ||
| Acrylonitrile Butadiene Styrene (ABS) | ||
| Nylon | ||
| Other Plastics | ||
| Ceramics | ||
| Other Types | ||
| By Application | Aerospace and Defense | |
| Automotive | ||
| Medical and Dental | ||
| Electronics | ||
| Other Applications | ||
| By Geography | Asia-Pacific | China |
| India | ||
| Japan | ||
| South Korea | ||
| Australia | ||
| Malaysia | ||
| Thailand | ||
| Vietnam | ||
| Indonesia | ||
| Rest of Asia-Pacific | ||
| North America | United States | |
| Canada | ||
| Mexico | ||
| Europe | Germany | |
| United Kingdom | ||
| France | ||
| Italy | ||
| Spain | ||
| Russia | ||
| Nordics | ||
| Turkey | ||
| Rest of Europe | ||
| South America | Brazil | |
| Argentina | ||
| Colombia | ||
| Rest of South America | ||
| Middle-East and Africa | Saudi Arabia | |
| United Arab Emirates | ||
| Qatar | ||
| South Africa | ||
| Nigeria | ||
| Egypt | ||
| Rest of Middle-East and Africa | ||


Key Questions Answered in the Report
How large will the 3D printing filament market be by 2031?
The 3D Printing Filament Market size is projected to expand from USD 1.07 billion in 2025 and USD 1.28 billion in 2026 to USD 3.16 billion by 2031, registering a CAGR of 19.75% between 2026 to 2031.
Which material type dominates commercial filament demand?
Plastics hold 72.12% revenue share thanks to the rapid adoption of engineering-grade PEEK, PEI, and TPU in aerospace and medical parts.
What application segment is expanding the quickest?
Medical and dental filaments are projected to post a 21.17% CAGR, led by implant-grade PEEK already used in many procedures.
Why is Asia-Pacific the largest regional market?
Vertically integrated polymer-to-filament plants, such as Covestro’s Zhuhai TPU complex, shorten supply chains and support just-in-time production for global brands.
How are regulations shaping European filament demand?
REACH microplastics restrictions and the Single-Use Plastics Directive steer buyers toward bio-based or recycled grades, boosting demand for certified compostable filaments.
Page last updated on:


