
Market Overview
| Study Period | 2021 - 2031 |
|---|---|
| Forecast Data Period | 2026 - 2031 |
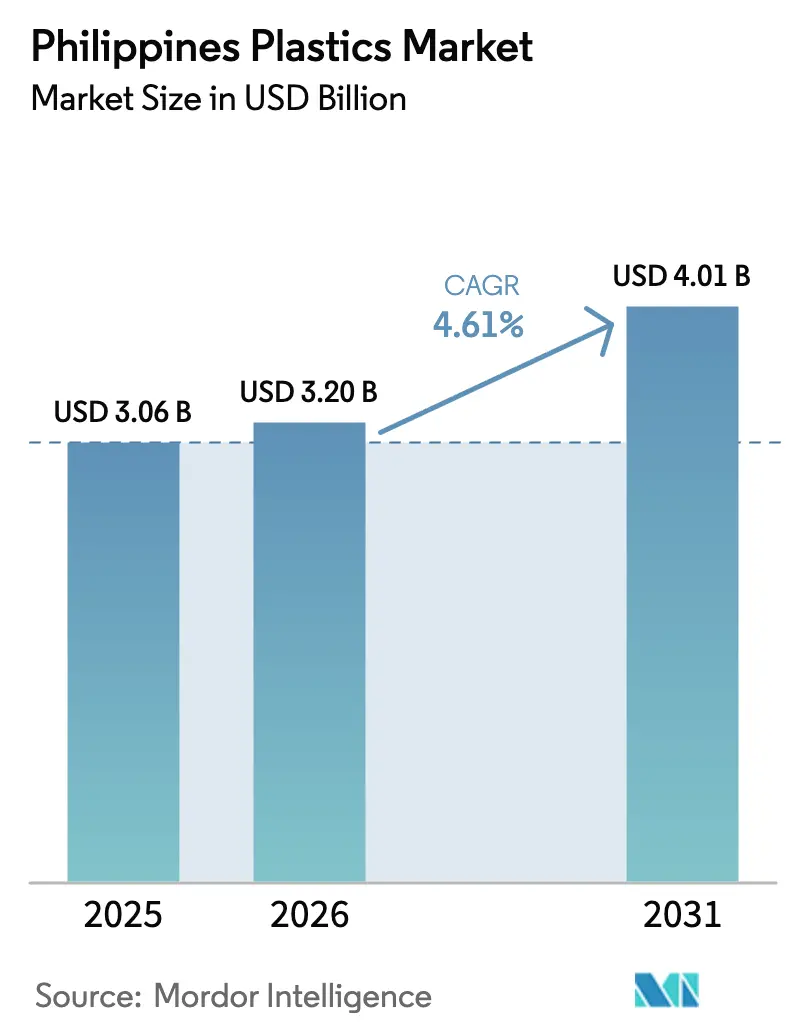
| Base Year Market Size (2025) | USD 3.06 Billion |
| Market Size (2026) | USD 3.20 Billion |
| Market Size (2031) | USD 4.01 Billion |
| Growth Rate (2026 - 2031) | 4.61 % |
| Market Concentration | Medium |
Major Players *Disclaimer: Major Players sorted in no particular order Image © Mordor Intelligence. Reuse requires attribution under CC BY 4.0. | |
Philippines Plastics Market Analysis by Mordor Intelligence
The Philippines Plastics Market size was valued at USD 3.06 billion in 2025 and is estimated to grow from USD 3.20 billion in 2026 to reach USD 4.01 billion by 2031, at a CAGR of 4.61% during the forecast period (2026-2031). Packaging demand linked to e-commerce growth, infrastructure‐led construction activity, and resurgent automotive wire-harness exports are combining to lift domestic resin off-take despite limited upstream capacity. Extended Producer Responsibility (EPR) targets that rise from 20% recovery in 2025 to 80% in 2028 are accelerating capital flows into recycling, particularly food-grade recycled PET and plant-fiber composites. PEZA’s 5% special corporate income tax and duty-free resin imports continue to attract compounders that balance imported feedstocks with local fillers to serve the Philippines plastics market profitably. At the same time, high electricity tariffs and patchwork single-use-plastic bans are forcing converters to adopt energy-efficient equipment and certified traceability systems to protect margins within the Philippines plastics market.
Key Report Takeaways
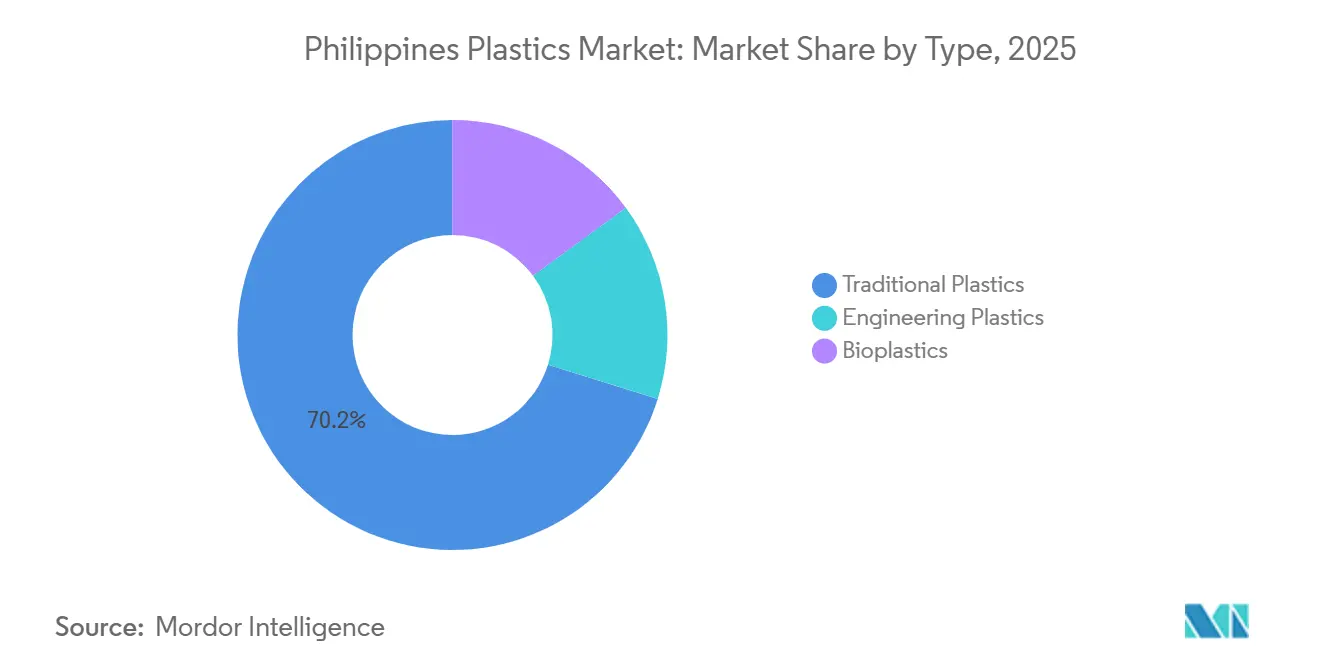
- By type, traditional plastics captured 70.18% of the Philippines plastics market share in 2025, while bioplastics are forecast to have a 5.06% CAGR through 2031.
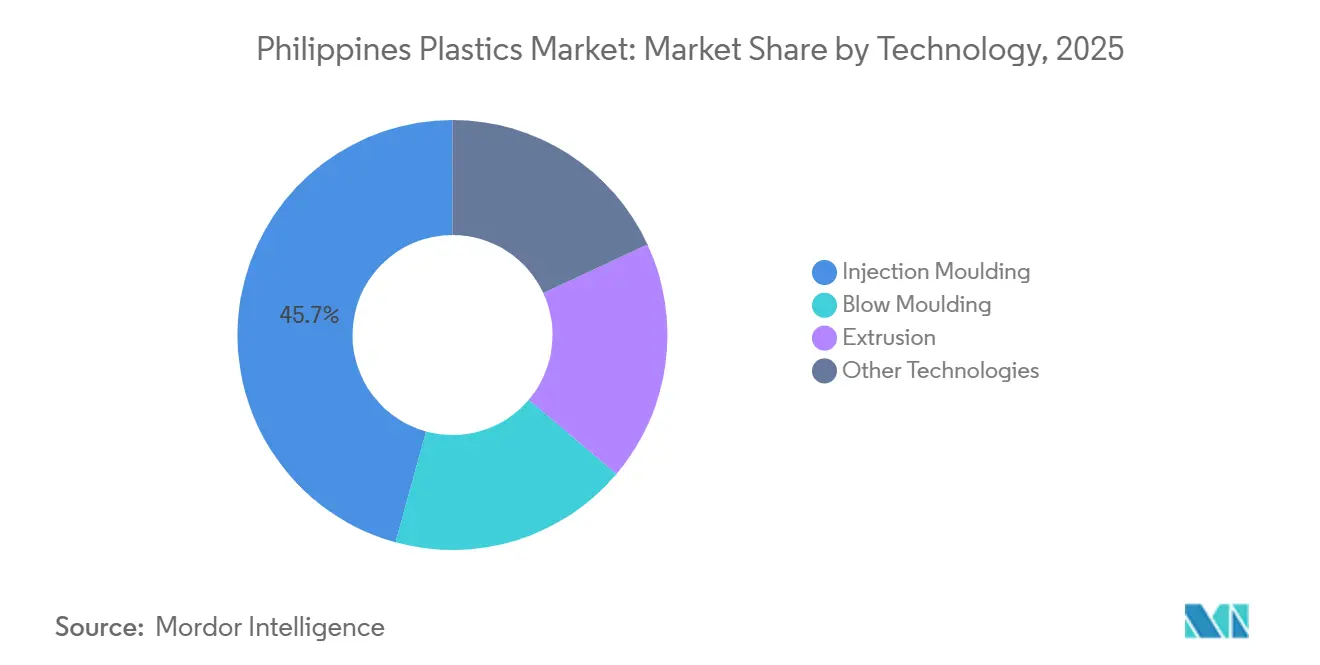
- By technology, injection molding led with 45.72% share of the Philippines plastics market size in 2025; rotational molding and thermoforming are expected to expand at a 4.97% CAGR to 2031.
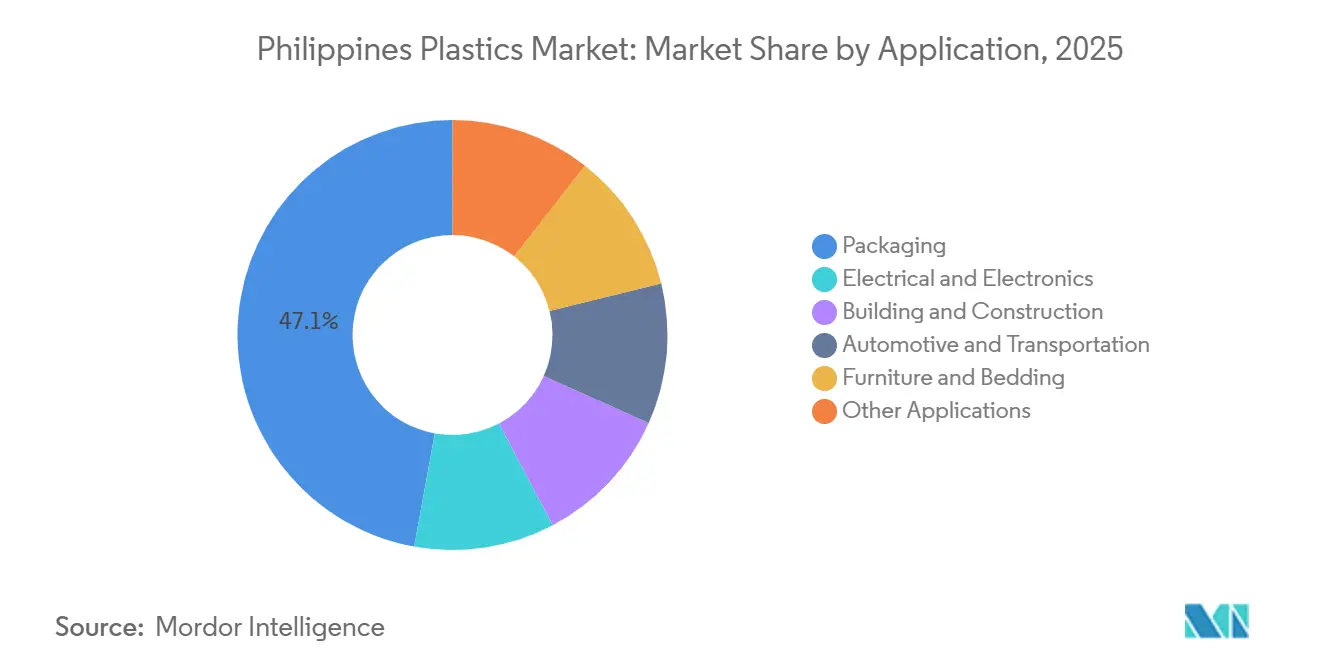
- By application, packaging accounted for 47.14% of the Philippines plastics market share in 2025, whereas automotive and transportation applications are on track for the fastest 5.19% CAGR to 2031.
Note: Market size and forecast figures in this report are generated using Mordor Intelligence’s proprietary estimation framework, updated with the latest available data and insights as of January 2026.
Philippines Plastics Market Trends and Insights
Drivers Impact Analysis*
| Driver | (~) % Impact on CAGR Forecast | Geographic Relevance | Impact Timeline |
|---|---|---|---|
| Surging packaging & e-commerce demand | +1.2% | National, concentrated in Metro Manila, Calabarzon | Short term (≤ 2 years) |
| Government infrastructure build-out boosts construction plastics | +1.0% | National, priority corridors in Luzon, Visayas, Mindanao | Medium term (2-4 years) |
| Rising automotive wire-harness exports need engineering plastics | +0.8% | PEZA zones in Laguna, Cavite, Batangas | Medium term (2-4 years) |
| PEZA tax incentives favour local compounders | +0.6% | PEZA-registered zones nationwide | Long term (≥ 4 years) |
| Brand commitments spur PCR-grade resin demand | +0.5% | National, led by Metro Manila FMCG hubs | Medium term (2-4 years) |
| Source: Mordor Intelligence | |||
Surging Packaging & E-commerce Demand
E-commerce penetration reached 15% in 2024 and continues to climb, pushing parcel volumes that favor light-weight, flexible films over rigid formats. Leading platforms now embed recycled-content guidelines into seller scorecards, encouraging the shift from virgin polypropylene mailers to recycled LDPE or rPET films. FMCG brands responding to EPR quotas have doubled take-back budgets for sachet and bottle collection, which increases demand for locally sourced PCR-grade pellets. As payment failures trigger repeat shipments, more bubble-wrap and corrugated liners are used per successful delivery, enlarging the overall packaging footprint that feeds directly into the Philippines plastics market. This cycle of volume growth, platform‐led sustainability, and regulatory pressure is steering converters toward certified recycled materials that command premiums yet still widen the Philippines plastics market.
Government Infrastructure Build-Out Boosts Construction Plastics
The national budget allocated PHP 1.545 trillion (USD 27.5 billion) to infrastructure in 2024, equivalent to 5.8% of GDP, channeling orders for HDPE and uPVC pipe, geotextiles, and EPS insulation into large public works. Contractors prefer corrosion-resistant plastic pipe over ductile iron to lower freight costs across the archipelago’s 7,641 islands. Climate-resilient design standards now specify UV-stabilized polypropylene geotextiles to protect flood-prone highways, nudging the replacement of sand-filled sacks with longer-lasting plastic alternatives. The Advanced Manufacturing Center recorded 79 client engagements in additive manufacturing, signaling that 3D-printed fittings and couplings could localize value within the Philippines plastics market. Sustained capital expenditure keeps construction grades at the core of domestic resin demand, underpinning stable volumes even when consumer spending softens.
Rising Automotive Wire-Harness Exports Need Engineering Plastics
Wire-harness shipments from PEZA zones to Japanese and Korean OEMs rose on contracts for EV models that demand flame-retardant nylon and PBT housings. Calamba-based Techno MoldPlas operates 29 injection machines to ±0.05 mm tolerances, validating the capability window local molders must hit to win higher-margin orders. The Comprehensive Automotive Resurgence Strategy extends fiscal credits for lightweighting, which motivates substitution of metal clips with glass-fiber-reinforced polyamide, raising the engineering share of the Philippines plastics market. EV battery enclosure prototypes using plant-fiber plastics point to incremental demand for heat-stable composites that also meet OEM carbon scoring. As volume migrates from commodity interiors to functional safety parts, domestic converters realize better yields and resilient pricing.
PEZA Tax Incentives Favor Local Compounders
Enterprises that locate inside economic zones secure a four- to seven-year income tax holiday, followed by a 5% tax on gross income in lieu of the 25% standard rate, plus duty-free equipment imports [2]. This structure lowers landed cost for compounded pellets by as much as 8% versus non-PEZA operations, encouraging mid-sized firms to scale blending lines and color masterbatch capacity. D&L Industries’ Batangas site exceeded its 2024 export target by 175%, demonstrating that PEZA incentives translate to global competitiveness even when utilities are expensive. Gross-income taxation minimizes disputes over transfer pricing, giving multinational suppliers the confidence to consolidate regional formulation work inside Philippine zones. Predictable taxation thus anchors investment that broadens the Philippines plastics market.
Restraints Impact Analysis*
| Restraint | (~) % Impact on CAGR Forecast | Geographic Relevance | Impact Timeline |
|---|---|---|---|
| Dependence on imported naphtha & polymers | -0.9% | National, acute in non-PEZA zones | Long term (≥ 4 years) |
| Single-use-plastic bans & EPR law compliance costs | -0.7% | Metro Manila, expanding to provincial cities | Medium term (2-4 years) |
| High energy & domestic logistics expenses | -0.5% | National, most severe in Visayas, Mindanao | Long term (≥ 4 years) |
| Source: Mordor Intelligence | |||
Dependence on Imported Naphtha & Polymers
Plastics import value jumped 24.75% year-on-year to USD 288.57 million in January 2025, underscoring near-total reliance on foreign feedstocks[1]. Only one local cracker—JG Summit’s Batangas complex—converts naphtha into olefins, and its 480,000-tonne ethylene output covers a fraction of domestic demand. Spot PP and PE prices track China’s export swings, so converters struggle to forecast margins and must pre-pay resin 60-90 days before collecting from FMCG buyers, tightening working capital. Currency volatility amplifies cost uncertainty because resin is invoiced in USD while most finished goods sell in PHP. These dynamics keep upstream risk a persistent drag on the Philippines plastics market.
Single-Use-Plastic Bans & EPR Law Compliance Costs
Republic Act 11898 compels 917 registered companies to recover 80% of plastic packaging by 2028 or face fines up to PHP 20 million. Local ordinances in Quezon City, Marikina, and Makati already ban common items such as straws and shopping bags, forcing converters to retool lines toward compostable or mono-material alternatives that cost 20%-40% more. Annual third-party audits inflate overhead, and EPR credits must be secured in advance or offset through co-processing contracts, adding complexity for small manufacturers. If House Bill 6470 passes, nationwide harmonization will remove patchwork rules but raise the baseline compliance load, squeezing operators with limited capex. Compliance investments are therefore a near-term restraint on the Philippines plastics market, although recyclers able to certify traceability will gain pricing power.
*Our forecasts treat driver/restraint impacts as directional, not additive. The impact forecasts reflect baseline growth, mix effects, and variable interactions.
Segment Analysis
By Type: Fiber Blends Challenge Commodity Dominance
Traditional plastics generated 70.18% of the Philippines plastics market size in 2025, anchored by polyethylene and polypropylene used in flexible packaging, pipes, and household goods. Commodity margins remain thin as Chinese oversupply keeps regional prices subdued, motivating converters to look for differentiation. D&L Polymer & Colours’ January 2025 launch of plant-fiber plastics replaced up to 40% of virgin resin with abaca and pineapple fibers, reducing weight and improving stiffness in appliance housings. Engineering grades, including nylon 66 and PBT, maintain a smaller share yet yield premiums of 50%-100% over PE, cushioning producers from spot volatility.
Bioplastics lead growth at a 5.06% CAGR through 2031. Local producers OIKOS and EcoNest currently import starch pellets, but feasibility work for a 30,000-tonne PLA line suggests that cassava feedstock from Northern Mindanao and BARMM could localize supply, trimming import bills and boosting the Philippines plastics market. However, bioplastic resin still costs 40%-100% more than conventional polymers, and EPR regulations do not yet provide explicit price offsets, limiting near-term penetration. Continued R&D by the Industrial Technology Development Institute on nanocellulose and PHA could narrow that gap and diversify raw-material options, but scale-up hinges on electricity pricing and credit access.

By Technology: Injection Precision Meets Rotomolding Versatility
Injection molding held 45.72% Philippines plastics market share in 2025 and remains the workhorse for electronics casings, connector housings, and medical devices, where dimensional tolerances below 0.05 mm are routine. Investments in servo-hydraulic machines with energy-recovery modules partially offset high electricity tariffs, and certified mold shops inside PEZA zones shorten lead times for OEM changes. Extrusion lines feed film and profile markets but face headwinds from anti-sachet legislation, prompting upgrades to multi-layer lines capable of running recycled content at high throughput.
Rotomolding, thermoforming, and compression molding together posted the fastest 4.97% CAGR and now capture niche furniture, agricultural, and specialty container applications. Resorts specify UV-stabilized rotomolded seating, while agricultural co-ops order thermoformed seedling trays made from post-consumer polypropylene, demonstrating end-use diversity that expands the Philippines plastics market. Blow molding benefits from PETValue’s bottle-to-bottle loop, ensuring steady preform demand even as beverage brands introduce light-weight neck finishes that cut resin per bottle by up to 10%.
By Application: Sachets Drive Packaging, Harnesses Pull Automotive
Packaging commanded 47.14% of the Philippines plastics market share in 2025, fueled by rising parcel counts, single-serve sachets, and the mainstreaming of video commerce that favors smaller pack sizes. Nestlé’s plastic-neutrality milestone of 79,559 tonnes collected by July 2023 shows how brands take-back schemes now feed recycled resin directly into film extrusion. Compostable film lines certified under TÜV Austria’s Compostaflex create further segment diversification and support higher unit margins.
Automotive & transportation applications are projected to expand at a 5.19% CAGR, the fastest within the Philippines plastics market, as EV components such as battery enclosures and lightweight connectors migrate to Philippine sourcing hubs. Building & construction follows infrastructure outlays with steady demand for pipe and geotextile, while electrical & electronics stay resilient on semiconductor packaging trays and appliance housings that require electrostatic discharge protection. Furniture, bedding, and miscellaneous uses—including toys and agricultural films—round out demand and often adopt lower-grade recycled resins, supporting the circular economy narrative.
Geography Analysis
Calabarzon forms the core manufacturing corridor for the Philippines plastics market, hosting JG Summit’s cracker, D&L’s Batangas specialty plant, PETValue’s bottle-to-bottle line, and dozens of precision molders all within 150 km of Manila ports. Metro Manila concentrates downstream conversion and waste collection to minimize transport costs on both virgin pellets and baled post-consumer plastics, enabling large FMCG users to secure just-in-time deliveries.
Visayas and Mindanao lag on energy and freight economics, confining most processors to low-value agricultural films and simple containers, yet high cassava output in Northern Mindanao positions the region as a logical site for future PLA fermentation or starch-based polymer blending. Infrastructure disbursements tilt toward Luzon, but planned airports and roads in Cebu and Davao could stimulate regional conversion if energy reforms materialize.
Export orientation remains essential: JG Summit ships polyolefins to more than 30 countries, and D&L’s Batangas plant sends specialty compounds across Asia and Europe, validating that economies of scale require offshore demand to absorb incremental capacity additions. The forthcoming National Plastics Action Roadmap aims to spread collection and recycling infrastructure beyond Metro Manila, potentially balancing geographic demand by 2030.
Regulatory Landscape
The Philippines plastics market operates under an increasingly compliance-led framework driven by the Extended Producer Responsibility (EPR) Act of 2022 (Republic Act 11898) and its DENR implementation. This applies to obliged enterprises (generally large companies with assets exceeding PHP 100 million) and sets annual plastic packaging recovery targets that step up through 60% in 2026 toward higher thresholds later in the decade. Non-compliance carries financial penalties (PHP 5 million to PHP 20 million) and increases the need for auditable recovery, verification, and traceability via Producer Responsibility Organizations (PROs) and accredited recovery channels.
Beyond waste policy, product standards also influence resin and conversion choices in regulated end uses. The Department of Trade and Industry, through the Bureau of Philippine Standards (BPS), enforces mandatory certification for selected plastic products, including various pipe categories (such as uPVC and PE pipes) under PS and ICC marking schemes. This directly anchors demand for compliant construction grades as infrastructure spending continues. In February 2026, DENR activity around EPR compliance and recognition programming also pointed to more standardized monitoring and audit frameworks, raising documentation requirements across the plastics and recycling value chain.
Value Chain Analysis
The value chain starts with feedstocks and base polymers that are predominantly imported, with domestic olefins supply constrained by the single local naphtha cracker (JG Summit’s Batangas complex). Imported PE, PP, engineering resins, and additives move through traders and distributors into local compounders, often located in PEZA and other industrial parks. These compounds then feed converters using injection molding, extrusion, and blow molding for packaging, construction, electronics, and automotive components. Downstream, brand owners and OEMs drive specifications for lightweighting, performance, and recycled content, while ports and inter-island logistics costs influence where conversion and recycling capacity can operate economically.
EPR is reshaping post-consumer flows into a more formal recovery loop. It adds Producer Responsibility Organizations (PROs), aggregators, MRFs, recyclers, and co-processing partners as more central intermediaries. The World Bank has estimated the Philippines loses USD 790 million to USD 890 million in material value each year by disposing of single-use plastics instead of recovering them, highlighting the economic incentive to scale collection, sorting, and reprocessing. Industry coordination platforms such as PARMS, including its EPR program work with stakeholders, are accelerating standardized recovery models and reinforcing demand for verifiable PCR-grade pellets, particularly for packaging applications.
Competitive Landscape
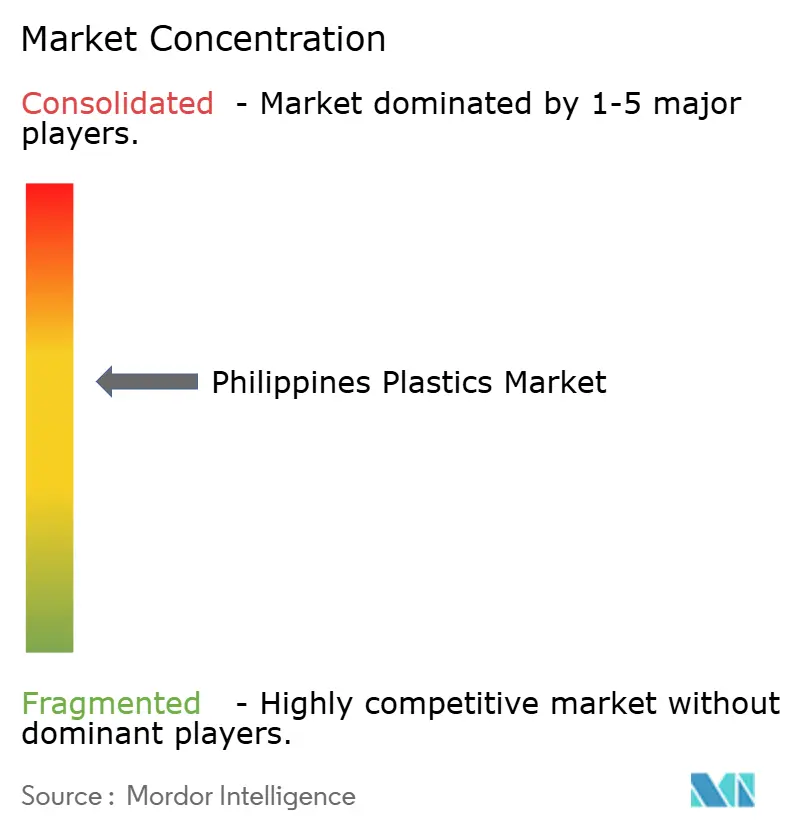
The Philippines Plastics Market is moderately concentrated. The upstream segment is concentrated around JG Summit Petrochemicals, which runs the only naphtha cracker but reported a PHP 3.8 billion EBITDA loss in the first nine months of 2024 due to record-low spreads, prompting a PHP 17.1 billion recapitalization. Midstream competition intensifies as D&L Industries commercializes fiber-reinforced resins that sell at a 20% premium to virgin PP while cutting weight by 8%-12% in appliance parts. Philippine Resins Industries leverages a chlor-alkali integration model, feeding PVC into water-pipe demand linked to Build Better More projects.
Philippines Plastics Industry Leaders
-
JG Summit Petrochemicals Group
-
Chemrez Technologies
-
Petron Corporation
-
NPC Alliance Corporation
-
Philippine Resins Industries Inc.
- *Disclaimer: Major Players sorted in no particular order
Market Opportunities and Future Outlook
EPR compliance is creating investable whitespace in collection-to-recycling infrastructure and in traceable PCR resin supply that can be channeled into packaging and other high-volume applications. Alpla’s March 2026 opening of its 4,800-square-meter facility at Filinvest Innovation Park in Calamba provides a concrete signal of downstream capacity build. The site is Alpla’s first base production site in the Philippines, producing bottles and closures across multiple blow molding and compression technologies, with room to add more lines. With brand recovery obligations under RA 11898 also in play, the business case strengthens for locally sourced rPET and recycled polyolefin streams that meet audit requirements.
Materials innovation and compounding remain another near-term opportunity where the value chain can progress even with limited upstream resin capacity. D&L Industries, through D&L Polymer & Colours, expanded natural-fiber integration with a January 2026 launch of a 100% abaca pellet, supporting hybrid formulations that reduce virgin resin intensity. This helps converters respond to single-use restrictions and recovery targets without fully redesigning production assets. Separately, BPS mandatory certification for pipes and related products keeps compliant construction plastics and formulation know-how in focus, especially for uPVC and PE pipe grades used in water, drainage, and infrastructure projects, where certification, durability, and consistent supply are decisive buying criteria.
Recent Industry Developments
- May 2026: JG Summit Holdings was reported to be in discussions regarding a potential sale of its petrochemical unit. With the Batangas complex tied to the country’s only naphtha cracker footprint, any ownership change becomes a strategic variable for domestic polyolefin availability, import reliance, and converter supply planning.
- July 2025: Chemrez Technologies secured Philippine Coconut Authority approval for CropGuard, an organic pesticide, for inclusion in the agency’s Integrated Pest Management framework. The approval strengthens Chemrez’s positioning in bio-based and coconut-derived specialty chemistry, supporting adjacent demand for specialized packaging and formulation materials used in agro-input distribution.
- May 2025: JG Summit Olefins Corporation’s board approved a prolonged shutdown of its petrochemical plant for at least two years amid challenging global petrochemical conditions, with production having ceased in January 2025 and debt transferred to the parent company. The extended outage tightened the local supply backdrop for key polymers and reinforced the market’s dependence on imported resins and more volatile landed-cost dynamics.
Research Methodology Framework and Report Scope
Market Definition and Coverage
For this study, the Philippines plastics market is defined as the revenue generated from plastic resins and plastic products sold into end-use applications within the Philippines, across major processing technologies and polymer families.
Scope exclusions: This sizing excludes informal scrap trade and non-plastic substitute materials, and it does not count the value of finished goods where plastics are only a minor component.
Segmentation Overview
- By Type
- Traditional Plastics
- Engineering Plastics
- Bioplastics
- By Technology
- Blow Moulding
- Extrusion
- Injection Moulding
- Other Technologies
- By Application
- Packaging
- Electrical & Electronics
- Building & Construction
- Automotive & Transportation
- Furniture & Bedding
- Other Applications
Data Sources, Market Sizing, and Validation
Desk Research
Desk research started with the basics that shape demand for plastics in the Philippines, including manufacturing output, construction activity, packaging consumption signals, and import and export flows for key polymer categories. We relied on public sources such as the Philippine Statistics Authority, Bureau of Customs trade releases, Bangko Sentral ng Pilipinas macro series, and government procurement and policy notices where relevant.
To keep pricing and supply assumptions grounded, we also reviewed company annual reports and investor presentations, industry association updates, and reputable business press coverage of capacity changes and regulatory moves, including EPR and single-use plastic policies. In addition, paid subscriptions for company financial intelligence, shipment-level trade visibility, and patent landscaping were used selectively to fill gaps on product mixes and to sanity-check directional trends. The sources listed above are illustrative only, and many other public and paid references were also used for data collection, validation, and clarification.
Primary Interviews and Surveys
Primary work was used to pressure-test assumptions that are hard to read from public data alone, including run-rate pricing moves, conversion yields by process, and how demand shifts between local supply and imports during tight periods. We spoke with resin distributors, converters, and large buyers across packaging, construction-related uses, and electrical and electronics, then followed up on any unclear points so the final model reflects observed buying patterns.
Distribution of primary research fieldwork respondents
| Company type | Respondent position |
|---|---|
| Top tier: 31% | CXOs: 15% |
| Mid tier: 54% | Functional/Unit leaders: 40% |
| Smaller Players: 15% | Managers: 45% |
Market-Sizing & Forecasting
Sizing was built using a top-down approach where production and trade data reconstruct the available polymer and converted-plastics pool, which is then allocated to end-use demand using application shares and processing intensity indicators. We then corroborated the totals using selective bottom-up checks, such as sampled converter capacity-to-output ratios, distributor channel checks, and ASP multiplied by volume for a few high-visibility resin families, before adjusting for overlaps.
Key inputs used in the model include polymer import volumes and unit values, conversion spreads between resin and finished plastic products, construction and infrastructure activity signals, packaging demand markers tied to FMCG and e-commerce movement, and regulatory-driven shifts such as EPR compliance push, which can change material choices and recycled-content targets. When bottom-up information was missing for smaller converters, the gap was handled through conservative utilization bands and cross-checks against import dependency levels.
Forecasting uses scenario analysis supported by light regression on the most stable drivers, and assumptions are refined with what interviewees expect for pricing pass-through, capacity restarts, and demand from packaging and construction. This keeps the forward view explainable, while still reflecting how volumes and ASPs move differently across cycles.
Data Validation & Update Cycle
Outputs were triangulated across multiple independent checks, including trade-derived implied consumption, pricing sanity ranges, and consistency with known capacity changes, and then exceptions were reviewed before sign-off. Where variance was large, we re-contacted sources to confirm whether the gap came from timing, product mix, or a one-off disruption.
The report is refreshed annually, and interim revisions are triggered when material events occur, such as large duty changes, major plant shutdowns or restarts, or a regulatory step that changes packaging formats. Before delivery, an analyst performs a final update pass so the numbers reflect the latest available public series and validated market feedback.
Mordor Intelligence's Philippines Plastics Market Estimate Compared With Other Published Estimates
Published market sizes for Philippines plastics often do not match because the scope boundary and the timing of price inputs vary a lot by publisher. Differences also show up when one estimate leans more on resin value only, while another mixes resin and converted products, which shifts the total even if volumes look similar.
A refresh-led difference is common, since the currency conversion month, the way ASPs are rolled forward across the year, and the checks used to catch outlier unit values can move the final number by a meaningful margin. By keeping FX timing consistent across the base year and re-validating unit values against import statistics and converter feedback during each refresh, Mordor Intelligence reduces drift that can happen when older pricing snapshots are carried into a newer demand picture.
Benchmark comparison
| Source | Market Size | Gaps in Research Methodology |
|---|---|---|
| Mordor Intelligence | USD 3.06 B (2025) | |
| Regional Consultancy A | USD 3.00 B (2025) | Uses a similar headline definition, but the published figure appears to rely on broader annual average pricing and less frequent checks on unit-value outliers, which can slightly compress the value total in a year with mixed resin price moves. |
| Trade Publisher B | USD 1.92 B (2024) | The estimate is anchored to an earlier year and is likely closer to resin-only value with a different pricing window, so it does not fully reflect later price normalization and downstream conversion value captured in broader plastics revenue. |
The spread across sources mostly comes from timing and what is counted as plastics value, rather than a disagreement on the direction of demand. When the scope is kept consistent and ASP and FX assumptions are refreshed with repeatable checks, the resulting market size stays traceable to clear inputs and can be updated without reworking the full model.
Key Questions Answered in the Report
What is the forecast value for plastics demand in the Philippines by 2031?
The Philippines Plastics market size is estimated at USD 3.20 billion in 2026 and is expected to reach USD 4.01 billion by 2031, at a CAGR of 4.61%.
Which end-use segment is set for the quickest growth to 2031?
Automotive & transportation, expanding at a projected 5.19% CAGR as wire-harness and EV components gain share.
How large was packaging’s share of total resin use in 2025?
The packaging application contributed to 47.14% of national consumption in 2025.
What fiscal benefits come from locating inside a PEZA zone?
Firms receive a 4-7 year income tax holiday, then pay a 5% tax on gross income instead of 25%, plus duty-free imports of equipment and resins.
Which region offers feedstock potential for cassava-based biopolymers?
Northern Mindanao and BARMM, which together account for 70% of national cassava output, offer feedstock potential for cassava-based biopolymers.