Market Overview
| Study Period | 2020 - 2031 |
|---|---|
| Forecast Data Period | 2026 - 2031 |
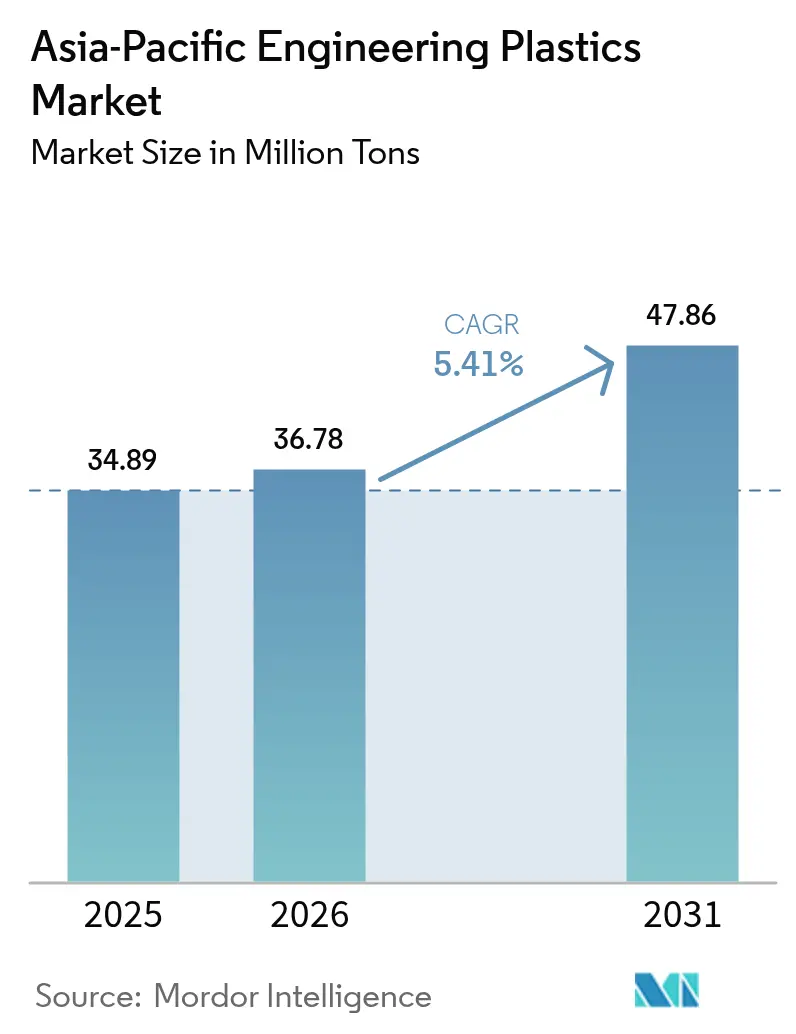
| Base Year Market Size (2025) | 34.89 Million tons |
| Market Volume (2026) | 36.78 Million tons |
| Market Volume (2031) | 47.86 Million tons |
| Growth Rate (2026 - 2031) | 5.41% CAGR |
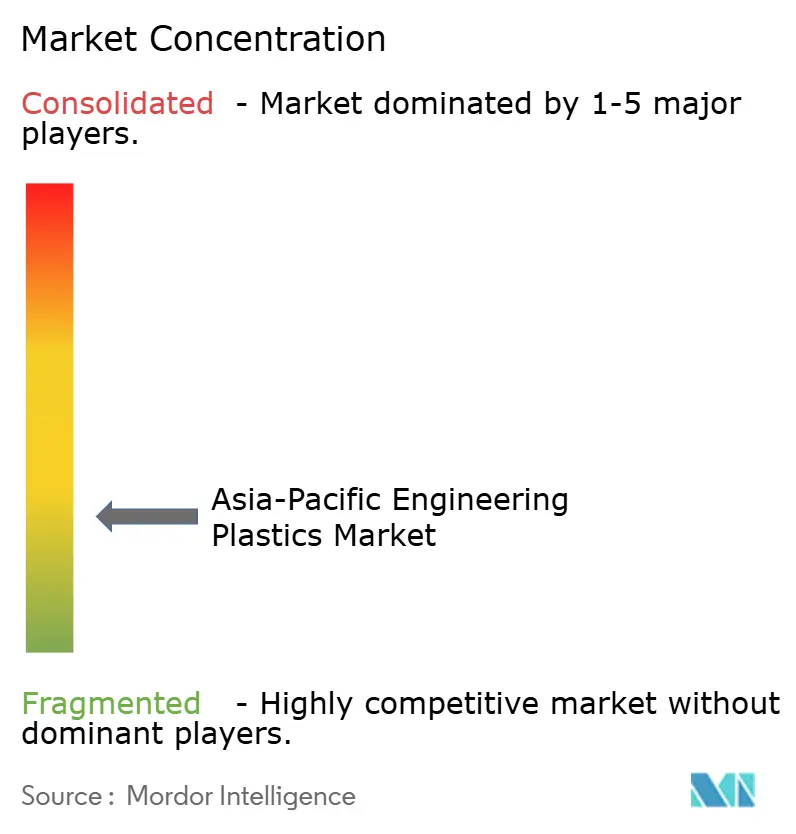
| Market Concentration | Low |
Major Players *Disclaimer: Major Players sorted in no particular order Image © Mordor Intelligence. Reuse requires attribution under CC BY 4.0. | |
Asia-Pacific Engineering Plastics Market Analysis by Mordor Intelligence
Asia-Pacific Engineering Plastics Market size in 2026 is estimated at 36.78 million tons, growing from 2025 value of 34.89 million tons with 2031 projections showing 47.86 million tons, growing at 5.41% CAGR over 2026-2031. Spurts in automotive electrification, rapid 5G infrastructure roll-outs, and steady packaging modernization anchor this growth trajectory. Expansions such as SABIC’s USD 6.4 billion Fujian complex, designed for 1.8 million tons annual ethylene capacity by H2 2026, are set to reinforce regional feedstock security and stimulate downstream engineering plastics supply. Lightweighting programs, electronics miniaturization, and recycling mandates continue to recalibrate material specifications, fostering swifter resin substitution and higher-value blends. Concurrently, local chemical recyclers in Japan, South Korea, and Malaysia scale pilot facilities to commercial size, signaling a long-term pivot toward circular feedstocks.
Key Report Takeaways
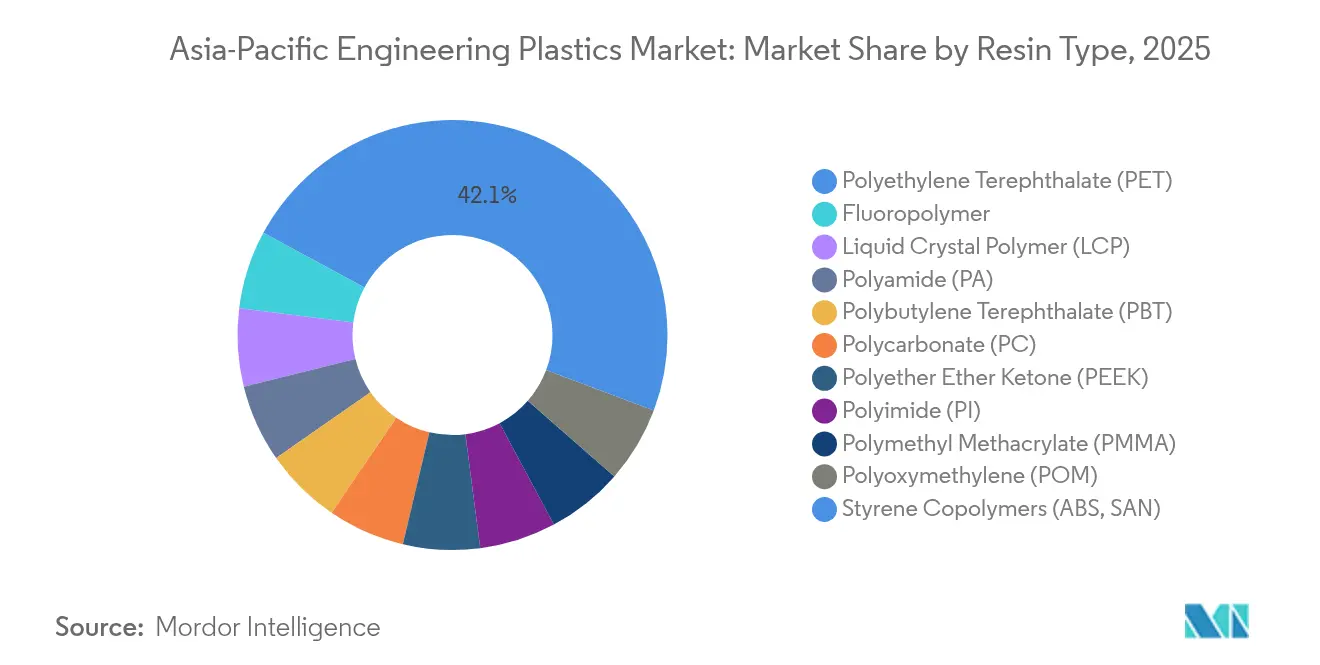
- By resin type, PET captured 42.12% of the Asia-Pacific engineering plastics market share in 2025, while fluoropolymers lead growth at an 8.12% CAGR through 2031.
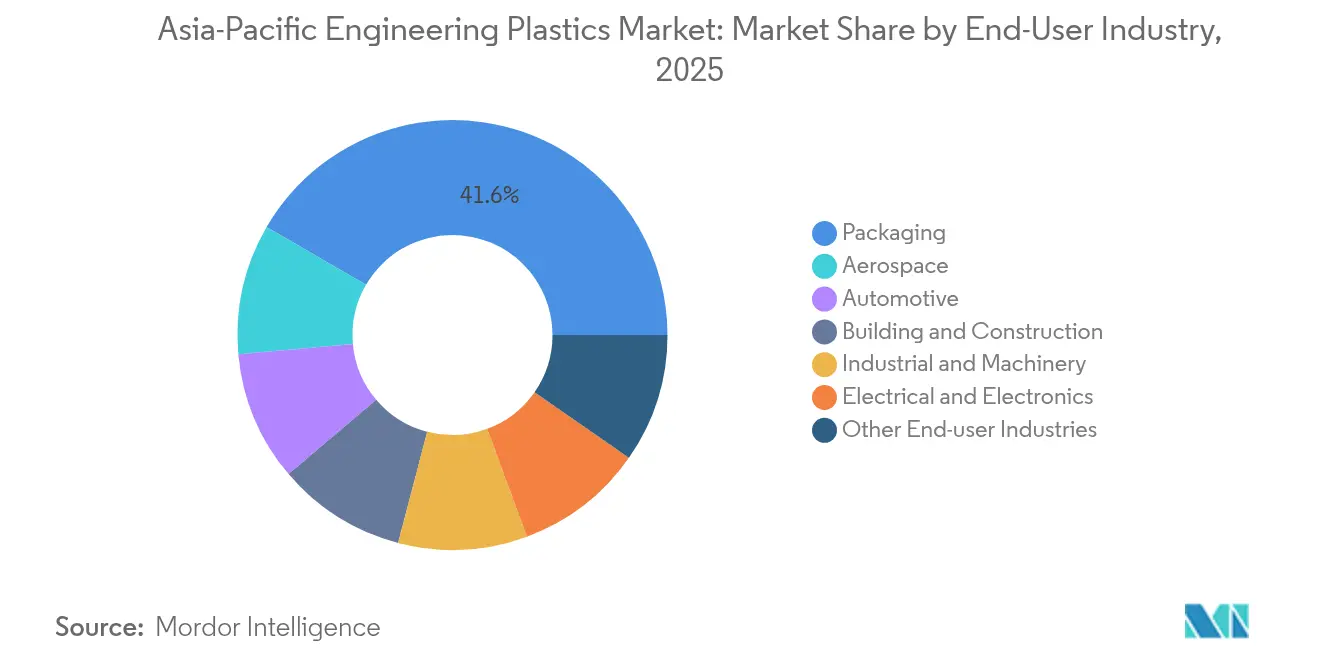
- By end-user, packaging held 41.62% revenue share in 2025; electrical and electronics is projected to expand at a 7.08% CAGR to 2031.
- By geography, the Rest of Asia-Pacific commanded 26.55% share in 2025, while South Korea records the highest CAGR at 5.83% through 2031.
Note: Market size and forecast figures in this report are generated using Mordor Intelligence’s proprietary estimation framework, updated with the latest available data and insights as of 2026.
Asia-Pacific Engineering Plastics Market Trends and Insights
Drivers Impact Analysis*
| Driver | (~) % Impact on CAGR Forecast | Geographic Relevance | Impact Timeline |
|---|---|---|---|
| Lightweighting demand in automotive manufacturing | +1.20% | China, Japan, South Korea, India | Medium term (2-4 years) |
| Expansion of consumer electronics production hubs | +0.90% | China, South Korea, Malaysia, Rest of Asia-Pacific | Short term (≤ 2 years) |
| Sustainability push for recycled engineering plastics | +0.70% | Japan, South Korea, Malaysia | Long term (≥ 4 years) |
| 5G base-station hardware requiring LCP & PEEK | +0.60% | China, South Korea, Japan | Short term (≤ 2 years) |
| Thermal-management parts for EV battery packs | +0.80% | China, Japan, South Korea | Medium term (2-4 years) |
| Source: Mordor Intelligence | |||


Lightweighting Demand in Automotive Manufacturing
OEMs across China, Japan, and South Korea are switching from metal to polymer parts to hit fleet-average energy-efficiency rules. South Korea’s pledge for 4.5 million zero-emission vehicles by 2030 raises polyamide, PPS, and PEEK demand in under-hood and battery-pack structures. Glass-fiber-reinforced PA66 delivering 270 MPa tensile strength now replaces metal cross-members, cutting component mass by up to 35%. Tier-1 suppliers are scaling in-house compounding to safeguard formulations and shorten lead times. Asahi Kasei’s CAD 417 million (USD 300 million) joint venture with Honda will secure separator volumes for North American battery projects, illustrating how vertical integration aligns with lightweighting goals.
Expansion of Consumer Electronics Production Hubs
Clustered smartphone, wearable, and PCB plants in China, South Korea, and Malaysia generate acute demand for ultra-low-warpage resins. Celanese’s Zenite LCP 16236(N) boosts melt flow by 30-40%, enabling finer pitches in 5G connector arrays. Rapid prototype cycles favor local resin suppliers that can deliver material in days rather than weeks. Panel-level packaging’s migration to the region multiplies orders for high-modulus LCP, PPS, and PPA grades.
Sustainability Push for Recycled Engineering Plastics
Chemical recycling projects have moved from pilot to the early commercial stage. JEPLAN’s 20,000 tons/year PET depolymerization plant starts up in 2025, while Malaysia’s PETRONAS is building a regional hub geared for mixed-waste streams. Celanese’s Zytel PA ECO-R cuts product-level carbon footprints by 32% using post-industrial feedstock. Automotive OEMs now stipulate minimum recycled-content thresholds in supplier contracts, propelling demand for certified circular quantities.
5G Base-Station Hardware Requiring LCP & PEEK
Asia-Pacific telecom operators have installed more than 2.5 million 5G macro-sites since 2024, driving usage of dimensionally stable polymers for antenna brackets and RF connectors. LCP and PEEK maintain dielectric constants below 3 at GHz frequencies, outperforming traditional epoxy laminates under high-humidity exposure. Fluoropolymers cover cable insulation, safeguarding signal integrity across temperature swings from –40 °C to 125 °C.
Restraints Impact Analysis*
| Restraint | (~) % Impact on CAGR Forecast | Geographic Relevance | Impact Timeline |
|---|---|---|---|
| Feedstock price volatility tied to crude derivatives | –0.8% | China, India | Short term (≤ 2 years) |
| Inadequate recycling infrastructure for specialty polymers | –0.4% | Southeast Asia, India | Long term (≥ 4 years) |
| Pending PFAS bans targeting fluoropolymers | –0.3% | Japan, South Korea | Medium term (2-4 years) |
| Source: Mordor Intelligence | |||
Inadequate Recycling Infrastructure for Specialty Polymers
Outside Japan and South Korea, facilities able to depolymerize PA, PBT, and POM remain scarce. Capital outlays exceeding USD 100 million deter private investors, leaving Southeast Asian recyclers focused on PET bottles. OEMs wanting recycled PA66 currently rely on imported pellets, stretching lead times and inflating costs.
Pending PFAS Bans Targeting Fluoropolymers
Draft regulations in Japan and South Korea propose phasing out specific PFAS additives by 2028; specialty cable grades using FEP or PVDF face qualification risks. Substitution pathways involve advanced siliconized polyolefins, but their long-term weatherability remains under validation.
*Our forecasts treat driver/restraint impacts as directional, not additive. The impact forecasts reflect baseline growth, mix effects, and variable interactions.
Segment Analysis
By Resin Type: PET Dominance Masks Specialty Growth
PET commanded 42.12% of the Asia-Pacific engineering plastics market share in 2025, benefiting from ubiquitous packaging and fiber demand. Fluoropolymers, though less than a tenth of overall volume, post the segment-best 8.12% CAGR through 2031 as telecom and battery regulations escalate performance requirements.
Glass-fiber-reinforced PA66, high-flow LCP, and medical-grade PEEK deepen specialty revenue pools. INVISTA’s China expansion doubled nylon 6,6 polymer capacity to 400,000 tons/year in 2024, narrowing regional supply gaps. Polycarbonate and POM maintain broad applications in appliances and the automotive sector, yet pricing pressure from localized capacities in China tempers near-term margins.


By End-User Industry: Electronics Surge Challenges Packaging Leadership
Packaging dominated in 2025 with 41.62% volume, anchored by beverage bottles and rigid trays. Smartphone boards, 5G antennas, and power modules push electrical and electronics demand at a 7.08% CAGR to 2031, reshaping procurement priorities.
Vehicle electrification intertwines with stringent fire-safety codes, accelerating the shift to halogen-free, flame-retardant resins in under-hood connectors. Building applications maintain steady polycarbonate sheet and PVC ceiling panel use, yet growth lags technology-linked sectors. Robotics programs in China, foreshadow niche upticks in PEEK and LCP for high-load joints.
Geography Analysis
China retains its status as the production nucleus, yet the Rest of Asia-Pacific segment held 26.55% of the Asia-Pacific engineering plastics market share in 2025, owing to diversified manufacturing in Vietnam, Thailand, and Indonesia. Projects such as Hengli Petrochemical’s 1.6 million tons specialty resin complex reinforce China’s scale advantage. Anti-dumping duties up to 74.9% on U.S. polyoxymethylene have redirected trade flows toward intra-ASEAN sourcing.
South Korea leads CAGR rankings at 5.83% through 2031 as automotive battery content surges. Lotte Chemical’s USD 220 million compounding plant in Jeollanam-do will serve regional EV programs with PA, PBT, and mPPE blends. Japan pioneers chemical recycling, with JEPLAN’s depolymerization startup scheduled for July 2025.
India offers latent upside as domestic OEMs localize component supply; however, recycling gaps and volatile monomer pricing cap short-term acceleration. Malaysia is positioning as a circular-economy hub through PETRONAS’s advanced recycling investment, while Australia focuses on aerospace and medical niches leveraging stringent quality standards.
Competitive Landscape
The Asia-Pacific engineering plastics market exhibits highly fragmented concentration. SABIC’s Fujian ethylene project (USD 6.4 billion) and Celanese’s broad acetyl-chain upgrades in the U.S. and China underline vertical-integration plays that mitigate feedstock risk[2]SABIC, “SABIC and Fujian Energy Petrochemical celebrate the start of construction for the SABIC Fujian Petrochemical Complex,” sabic.com . Asahi Kasei will lift alkaline water electrolyzer capacity beyond 3 GW by 2028, channeling membrane technology into fluoropolymer demand.
Emerging Chinese polymer recyclers vie for post-consumer feedstock streams, aiming to displace virgin imports. Ascend Performance Materials’ HMD plant in Jiangsu expands polyamide intermediates supply, bolstering captive backward integration. Trinseo’s European PC shutdown reflects global rationalization, with Asian capacity fills absorbing displaced volumes.
Digital manufacturing platforms that integrate polymer simulation, tool design, and order fulfillment differentiate service-centric suppliers. Patent portfolios around high-frequency, halogen-free compounds and chemically recycled grades act as entry barriers in specialty arenas.
Asia-Pacific Engineering Plastics Industry Leaders
Covestro AG
LG Chem
Mitsubishi Chemical Corporation
SABIC
Sumitomo Chemical Co. Ltd.
- *Disclaimer: Major Players sorted in no particular order

Recent Industry Developments
- September 2025: LyondellBasell has expanded its Suzhou Technical Center by adding a new laboratory extrusion line and upgrading its processing workshop. These enhancements strengthen the Advanced Polymer Solutions division by improving compounding capabilities and supporting the development of advanced formulations for polypropylene compounds and engineered plastics.
- May 2025: Covestro has expanded its global capacity for polycarbonate (PC) specialty films with new production lines at the Map Ta Phut Industrial Park in Thailand, addressing rising demand in medical technology across Asia-Pacific and strengthening its Solutions & Specialties segment.


Asia-Pacific Engineering Plastics Market Report Scope
Aerospace, Automotive, Building and Construction, Electrical and Electronics, Industrial and Machinery, Packaging are covered as segments by End User Industry. Fluoropolymer, Liquid Crystal Polymer (LCP), Polyamide (PA), Polybutylene Terephthalate (PBT), Polycarbonate (PC), Polyether Ether Ketone (PEEK), Polyethylene Terephthalate (PET), Polyimide (PI), Polymethyl Methacrylate (PMMA), Polyoxymethylene (POM), Styrene Copolymers (ABS and SAN) are covered as segments by Resin Type. Australia, China, India, Japan, Malaysia, South Korea are covered as segments by Country.By Resin Type
| Fluoropolymer | Ethylenetetrafluoroethylene (ETFE) |
| Fluorinated Ethylene-propylene (FEP) | |
| Polytetrafluoroethylene (PTFE) | |
| Polyvinylfluoride (PVF) | |
| Polyvinylidene Fluoride (PVDF) | |
| Other Sub Resin Types | |
| Liquid Crystal Polymer (LCP) | |
| Polyamide (PA) | Aramid |
| Polyamide (PA) 6 | |
| Polyamide (PA) 66 | |
| Polyphthalamide | |
| Polybutylene Terephthalate (PBT) | |
| Polycarbonate (PC) | |
| Polyether Ether Ketone (PEEK) | |
| Polyethylene Terephthalate (PET) | |
| Polyimide (PI) | |
| Polymethyl Methacrylate (PMMA) | |
| Polyoxymethylene (POM) | |
| Styrene Copolymers (ABS, SAN) |
By End-User Industry
| Aerospace |
| Automotive |
| Building and Construction |
| Electrical and Electronics |
| Industrial and Machinery |
| Packaging |
| Other End-user Industries |
By Geography
| China |
| India |
| Japan |
| South Korea |
| Australia |
| Malaysia |
| Rest of Asia-Pacific |
| By Resin Type | Fluoropolymer | Ethylenetetrafluoroethylene (ETFE) |
| Fluorinated Ethylene-propylene (FEP) | ||
| Polytetrafluoroethylene (PTFE) | ||
| Polyvinylfluoride (PVF) | ||
| Polyvinylidene Fluoride (PVDF) | ||
| Other Sub Resin Types | ||
| Liquid Crystal Polymer (LCP) | ||
| Polyamide (PA) | Aramid | |
| Polyamide (PA) 6 | ||
| Polyamide (PA) 66 | ||
| Polyphthalamide | ||
| Polybutylene Terephthalate (PBT) | ||
| Polycarbonate (PC) | ||
| Polyether Ether Ketone (PEEK) | ||
| Polyethylene Terephthalate (PET) | ||
| Polyimide (PI) | ||
| Polymethyl Methacrylate (PMMA) | ||
| Polyoxymethylene (POM) | ||
| Styrene Copolymers (ABS, SAN) | ||
| By End-User Industry | Aerospace | |
| Automotive | ||
| Building and Construction | ||
| Electrical and Electronics | ||
| Industrial and Machinery | ||
| Packaging | ||
| Other End-user Industries | ||
| By Geography | China | |
| India | ||
| Japan | ||
| South Korea | ||
| Australia | ||
| Malaysia | ||
| Rest of Asia-Pacific | ||


Market Definition
- End-user Industry - Packaging, Electrical & Electronics, Automotive, Building & Construction, and Others are the end-user industries considered under the engineering plastics market.
- Resin - Under the scope of the study, consumption of virgin resins like Fluoropolymer, Polycarbonate, Polyethylene Terephthalate, Polybutylene Terephthalate, Polyoxymethylene, Polymethyl Methacrylate, Styrene Copolymers, Liquid Crystal Polymer, Polyether Ether Ketone, Polyimide, and Polyamide in the primary forms are considered. Recycling has been provided separately under its individual chapter.
| Keyword | Definition |
|---|---|
| Acetal | This is a rigid material that has a slippery surface. It can easily withstand wear and tear in abusive work environments. This polymer is used for building applications such as gears, bearings, valve components, etc. |
| Acrylic | This synthetic resin is a derivative of acrylic acid. It forms a smooth surface and is mainly used for various indoor applications. The material can also be used for outdoor applications with a special formulation. |
| Cast film | A cast film is made by depositing a layer of plastic onto a surface then solidifying and removing the film from that surface. The plastic layer can be in molten form, in a solution, or in dispersion. |
| Colorants & Pigments | Colorants & Pigments are additives used to change the color of the plastic. They can be a powder or a resin/color premix. |
| Composite material | A composite material is a material that is produced from two or more constituent materials. These constituent materials have dissimilar chemical or physical properties and are merged to create a material with properties unlike the individual elements. |
| Degree of Polymerization (DP) | The number of monomeric units in a macromolecule, polymer, or oligomer molecule is referred to as the degree of polymerization or DP. Plastics with useful physical properties often have DPs in the thousands. |
| Dispersion | To create a suspension or solution of material in another substance, fine, agglomerated solid particles of one substance are dispersed in a liquid or another substance to form a dispersion. |
| Fiberglass | Fiberglass-reinforced plastic is a material made up of glass fibers embedded in a resin matrix. These materials have high tensile and impact strength. Handrails and platforms are two examples of lightweight structural applications that use standard fiberglass. |
| Fiber-reinforced polymer (FRP) | Fiber-reinforced polymer is a composite material made of a polymer matrix reinforced with fibers. The fibers are usually glass, carbon, aramid, or basalt. |
| Flake | This is a dry, peeled-off piece, usually with an uneven surface, and is the base of cellulosic plastics. |
| Fluoropolymers | This is a fluorocarbon-based polymer with multiple carbon-fluorine bonds. It is characterized by high resistance to solvents, acids, and bases. These materials are tough yet easy to machine. Some of the popular fluoropolymers are PTFE, ETFE, PVDF, PVF, etc. |
| Kevlar | Kevlar is the commonly referred name for aramid fiber, which was initially a Dupont brand for aramid fiber. Any group of lightweight, heat-resistant, solid, synthetic, aromatic polyamide materials that are fashioned into fibers, filaments, or sheets is called aramid fiber. They are classified into Para-aramid and Meta-aramid. |
| Laminate | A structure or surface composed of sequential layers of material bonded under pressure and heat to build up to the desired shape and width. |
| Nylon | They are synthetic fiber-forming polyamides formed into yarns and monofilaments. These fibers possess excellent tensile strength, durability, and elasticity. They have high melting points and can resist chemicals and various liquids. |
| PET preform | A preform is an intermediate product that is subsequently blown into a polyethylene terephthalate (PET) bottle or a container. |
| Plastic compounding | Compounding consists of preparing plastic formulations by mixing and/or blending polymers and additives in a molten state to achieve the desired characteristics. These blends are automatically dosed with fixed setpoints usually through feeders/hoppers. |
| Plastic pellets | Plastic pellets, also known as pre-production pellets or nurdles, are the building blocks for nearly every product made of plastic. |
| Polymerization | It is a chemical reaction of several monomer molecules to form polymer chains that form stable covalent bonds. |
| Styrene Copolymers | A copolymer is a polymer derived from more than one species of monomer, and a styrene copolymer is a chain of polymers consisting of styrene and acrylate. |
| Thermoplastics | Thermoplastics are defined as polymers that become soft material when it is heated and becomes hard when it is cooled. Thermoplastics have wide-ranging properties and can be remolded and recycled without affecting their physical properties. |
| Virgin Plastic | It is a basic form of plastic that has never been used, processed, or developed. It may be considered more valuable than recycled or already used materials. |


Research Methodology
Mordor Intelligence follows a four-step methodology in all our reports.
- Step-1: Identify Key Variables: The quantifiable key variables (industry and extraneous) pertaining to the specific product segment and country are selected from a group of relevant variables & factors based on desk research & literature review; along with primary expert inputs. These variables are further confirmed through regression modeling (wherever required).
- Step-2: Build a Market Model: In order to build a robust forecasting methodology, the variables and factors identified in Step-1 are tested against available historical market numbers. Through an iterative process, the variables required for market forecast are set and the model is built on the basis of these variables.
- Step-3: Validate and Finalize: In this important step, all market numbers, variables and analyst calls are validated through an extensive network of primary research experts from the market studied. The respondents are selected across levels and functions to generate a holistic picture of the market studied.
- Step-4: Research Outputs: Syndicated Reports, Custom Consulting Assignments, Databases & Subscription Platforms


