Plasmid Purification Market Size and Share
Market Overview
| Study Period | 2019 - 2030 |
|---|---|
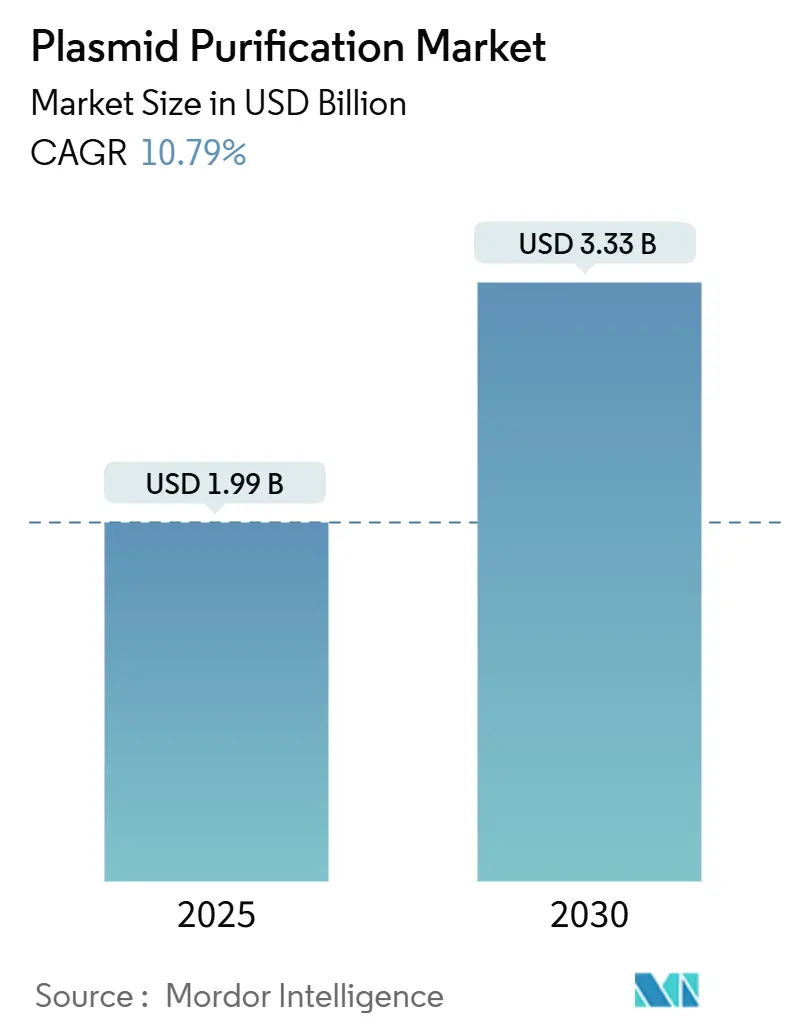
| Market Size (2025) | USD 1.99 Billion |
| Market Size (2030) | USD 3.33 Billion |
| Growth Rate (2025 - 2030) | 10.79% CAGR |
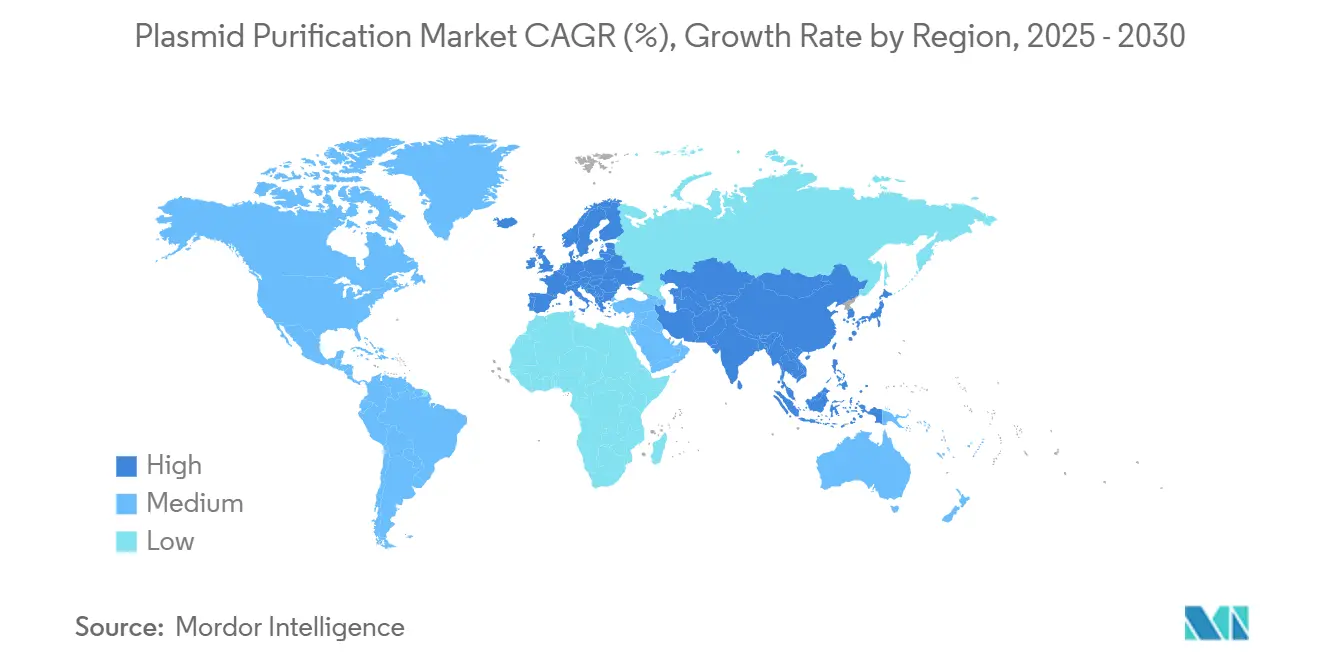
| Fastest Growing Market | Asia Pacific |
| Largest Market | North America |
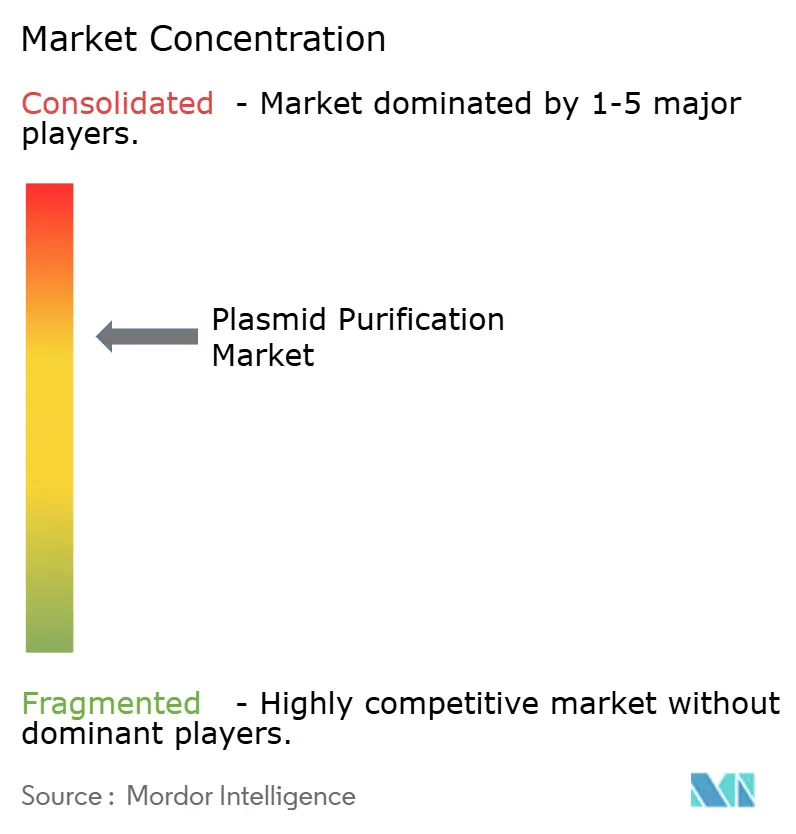
| Market Concentration | Medium |
Major Players *Disclaimer: Major Players sorted in no particular order Image © Mordor Intelligence. Reuse requires attribution under CC BY 4.0. | |
Plasmid Purification Market Analysis by Mordor Intelligence
The plasmid purification market size stood at USD 1.99 billion in 2025 and is on track to reach USD 3.33 billion by 2030, advancing at a 10.79% CAGR. Strong momentum for gene therapy commercialization, permanent mRNA vaccine production capacity, and CRISPR screening workflows underpin this growth. Demand for GMP-grade plasmids continues to surge as more than 700 gene-therapy programs progress through the clinic, while standardized kits remain popular with academic and early-stage users. Consolidation among suppliers—highlighted by Thermo Fisher Scientific’s USD 4.1 billion purchase of Solventum’s purification business—has intensified competition and accelerated vertical integration. Simultaneously, the FDA’s 2025 move to recombinant Factor C endotoxin testing sharpens quality requirements and favors manufacturers with advanced purification technologies.
Key Report Takeaways
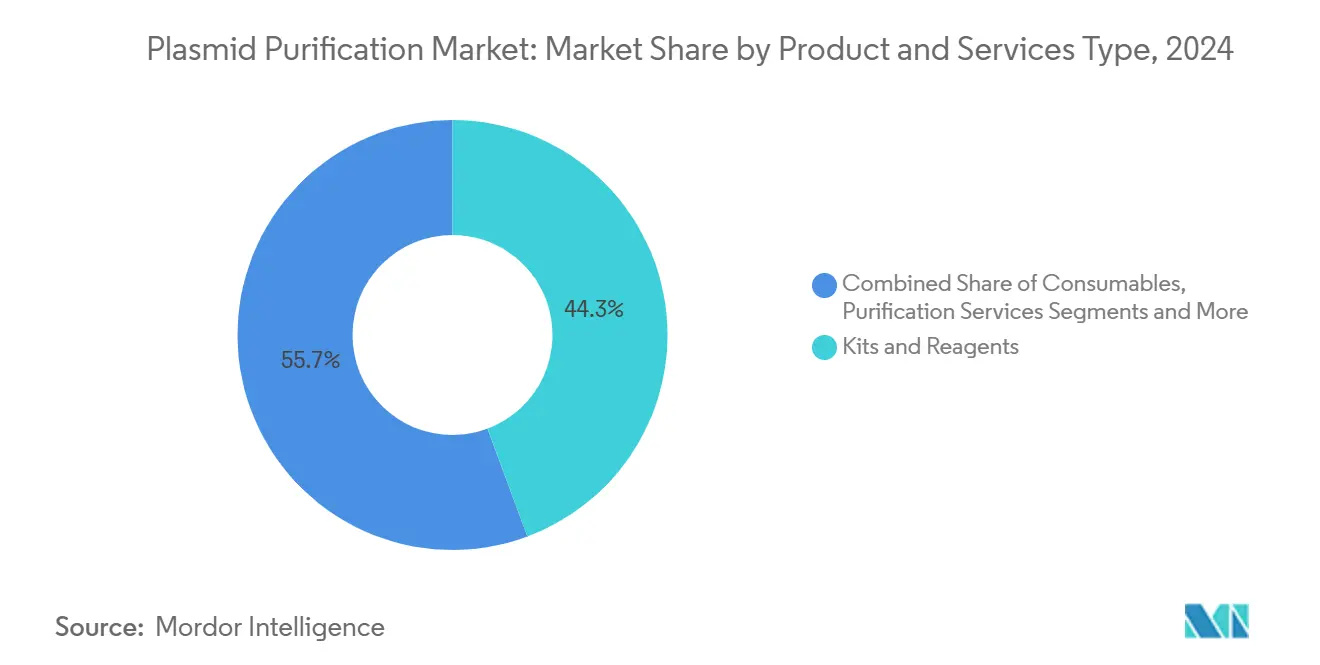
- By product & services type, purification services led growth with a 13.47% CAGR to 2030, while kits and reagents accounted for 44.33% of plasmid purification market share in 2024.
- By purity grade, GMP-grade plasmids are set to expand at a 14.23% CAGR, whereas research-grade plasmids retained 62.38% of the plasmid purification market size in 2024.
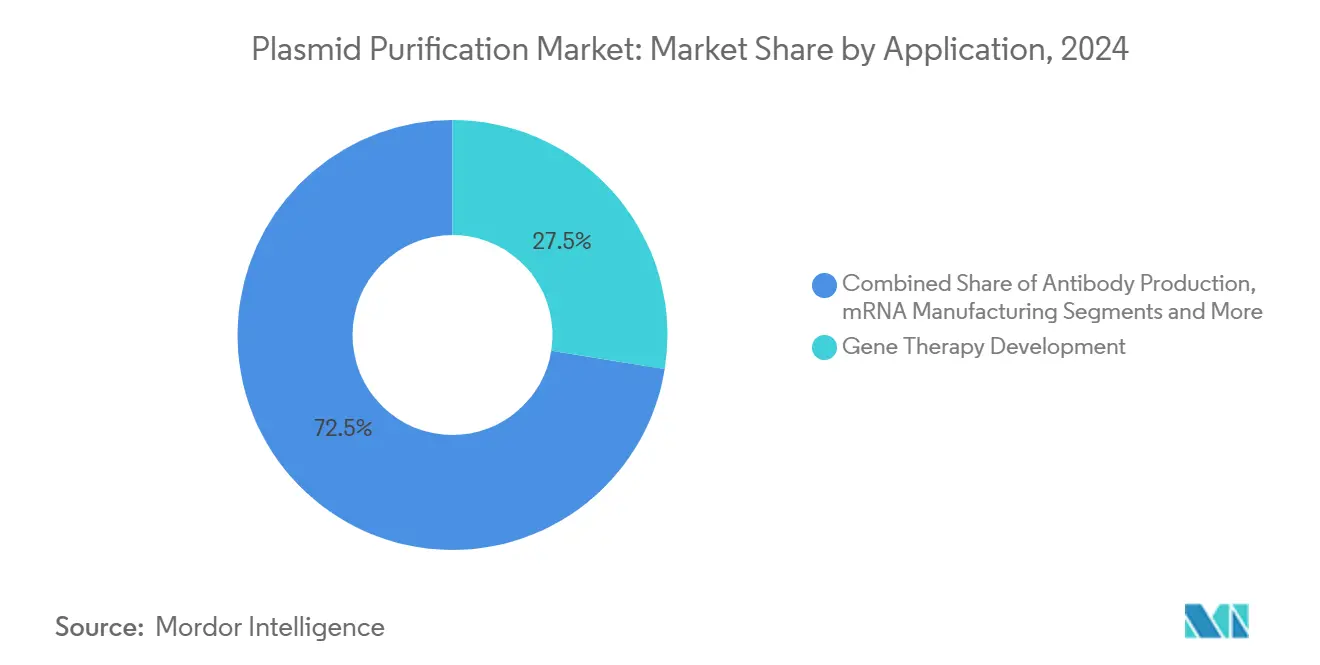
- By application, mRNA manufacturing posted the fastest 13.89% CAGR, and gene therapy claimed 27.53% of plasmid purification market share in 2024.
- By end user, CDMOs are growing at 13.09% CAGR, while pharmaceutical and biotechnology companies held 44.58% of the plasmid purification market size in 2024.
- Geographically, North America dominated with 37.56% plasmid purification market share in 2024, whereas Asia-Pacific is forecast to grow at 12.74% CAGR through 2030.
Global Plasmid Purification Market Trends and Insights
Drivers Impact Analysis*
| Driver | (~) % Impact on CAGR Forecast | Geographic Relevance | Impact Timeline |
|---|---|---|---|
| Surging clinical-stage gene-therapy pipeline | +2.8% | North America & EU core, global reach | Medium term (2–4 years) |
| Rapid scale-up of mRNA vaccine manufacturing capacity | +2.1% | North America & Europe | Short term (≤ 2 years) |
| Increasing outsourcing to CDMOs for GMP-grade plasmids | +1.9% | Global, strong in APAC | Medium term (2–4 years) |
| Growing demand for high-copy plasmids in CRISPR screening | +1.6% | North America & EU spill-over to APAC | Long term (≥ 4 years) |
| Shift toward continuous, closed-system purification platforms | +1.4% | Early adoption in developed markets | Long term (≥ 4 years) |
| Biotech investors backing microbial synthetic-biology start-ups | +1.1% | North America & EU, rising APAC | Medium term (2–4 years) |
| Source: Mordor Intelligence | |||
Surging Clinical-Stage Gene-Therapy Pipeline
The global gene-therapy trial count exceeded 3,900 in 2024, accelerating demand for GMP-grade plasmid DNA across a widening therapeutic scope. More than 70% of these programs incorporate plasmids either as direct agents or as viral-vector substrates.[1]Dan Stanton, “Catalent commits to pDNA, buying Delphi and expanding a Maryland plant,” BioProcess International, bioprocessintl.com As trials progress to pivotal phases, regulators favor platform processes, prompting manufacturers to implement scalable, reproducible purification methods. Investment in modular facilities supports parallel production streams, while improved European reimbursement pathways bolster commercial incentives. Collectively, these factors push the plasmid purification market toward higher capacity and stricter quality assurance.
Rapid Scale-Up of mRNA Vaccine Manufacturing Capacity Post-COVID-19
Infrastructure built for COVID-19 vaccines now supports broader therapeutic pipelines, with Wacker allocating USD 102 million to additional capacity and BIOVECTRA expanding operations. Twin-column and multicolumn continuous chromatography systems shorten processing times and raise yields, positioning suppliers to meet both pandemic-preparedness and routine production requirements. Regulators now expect documented surge capability, reinforcing the need for flexible, scalable purification platforms. Dual-sourcing strategies forged during the pandemic remain in place, sustaining ongoing demand for template plasmids.
Increasing Outsourcing to CDMOs for GMP-Grade Plasmids
Pharmaceutical firms increasingly contract out plasmid manufacturing to CDMOs adept at managing endotoxin control, supercoiling integrity, and evolving regulatory standards. Catalent’s purchase of Delphi Genetics and facility upgrades illustrate the wave of capacity expansion dedicated to plasmid services. CDMOs offer modular suites, enabling concurrent campaigns for multiple clients without cross-contamination. Dual-supplier agreements mitigate supply risks, while platform processes and digital QA tools accelerate technology transfer, bolstering the plasmid purification market.
Growing Demand for High-Copy Plasmids in CRISPR Screening
As CRISPR screens move from discovery to therapeutic development, high-copy plasmids that ensure robust guide RNA expression have become essential. Automated, high-throughput protocols require ultra-pure, consistently supercoiled plasmids to maintain transfection fidelity across large libraries. Artificial-intelligence-assisted enzyme engineering intensifies throughput, further boosting plasmid volumes.[2]Gregg T. Beckham, “Enabling high-throughput enzyme discovery and engineering with a low-cost, robot-assisted pipeline,” Nature, nature.com Specialized purification approaches preserve plasmid topology and yield, enlarging a niche that complements therapeutic plasmid demand and widens the plasmid purification industry’s customer base.
Restraints Impact Analysis*
| Restraint | (~) % Impact on CAGR Forecast | Geographic Relevance | Impact Timeline |
|---|---|---|---|
| Complex IP landscape for novel chromatography resins | –1.8% | North America & EU | Medium term (2–4 years) |
| Limited global GMP manufacturing capacity drives long lead-times | –2.1% | Worldwide, acute in emerging markets | Short term (≤ 2 years) |
| Endotoxin specification tightening raises production cost | –1.4% | Global, higher impact in cost-sensitive regions | Short term (≤ 2 years) |
| Scarcity of skilled upstream personnel in emerging markets | –1.2% | APAC & MEA | Long term (≥ 4 years) |
| Source: Mordor Intelligence | |||
Complex IP Landscape for Novel Chromatography Resins
Overlapping patents covering multimodal resins and continuous systems complicate technology adoption, particularly for smaller firms lacking legal resources. Major suppliers have consolidated patent portfolios, forcing license negotiations or suboptimal work-arounds. Additional regulatory validation for new resin chemistries prolongs timelines, discouraging rapid innovation and potentially slowing the plasmid purification market’s technology refresh cycles.
Limited Global GMP Manufacturing Capacity Drives Long Lead-Times
Available GMP plasmid slots remain scarce, stretching new-program lead-times to 12–18 months at leading CDMOs. Consolidation has reduced the supplier pool, and emerging-market access often depends on overseas capacity. Developers must secure reservations early, raising working-capital needs. Although several expansions are underway, facility construction and validation take years, restraining near-term scalability.
*Our forecasts treat driver/restraint impacts as directional, not additive. The impact forecasts reflect baseline growth, mix effects, and variable interactions.
Segment Analysis
By Product & Services Type: Services Drive Market Evolution
Purification services expanded at a 13.47% CAGR through 2030, underscoring a strategic industry pivot toward turnkey outsourcing. Kits and reagents maintained 44.33% of plasmid purification market share in 2024, reflecting entrenched demand from researchers and small biotech firms. Instruments and systems enjoy steady replacement sales as manufacturers upgrade to continuous or single-use formats. Consumables provide recurring revenue streams, but the services boom exemplifies how complexity and compliance favor specialized providers.
Growth in purification services reflects client appetite for rapid, risk-mitigated access to GMP-grade plasmids without building internal suites. CDMOs differentiate via end-to-end offerings that integrate plasmid production with viral-vector or mRNA manufacturing, enabling seamless tech transfer. Thermo Fisher Scientific’s Solventum acquisition demonstrates the value of bundling hardware, reagents, and services under one roof. As capacity comes online, competition shifts to turnaround time, digital transparency, and advanced analytics within the plasmid purification market.


By Purity Grade: GMP Standards Reshape Market Dynamics
GMP-grade plasmids are projected to outpace all other categories at a 14.23% CAGR as clinical pipelines mature. Research-grade plasmids still represented 62.38% of plasmid purification market size in 2024, anchored by academia and discovery-stage biotech. The leap from research to GMP production requires stricter endotoxin, sterility, and supercoiling criteria plus lot-tracking, heightening cost and regulatory scrutiny.
The FDA’s Chapter 86 rFC mandate accentuates the gulf between grades, forcing manufacturers to adopt recombinant tests and upgrade depyrogenation workflows.[3]Samsung Biologics, “Samsung Biologics Reports Strong Q1 2025 Results,” samsung.com Companies such as Charles River Laboratories now offer tiered plasmid banking that transitions customers from research to GMP readiness, easing the quality-upgrade burden. As therapy developers hit late-phase milestones, demand for validated GMP capacity intensifies, invigorating the plasmid purification market.
By Application: mRNA Manufacturing Accelerates Market Growth
mRNA manufacturing posted the fastest 13.89% CAGR, propelled by infrastructure initially constructed for COVID-19 vaccines. Gene therapy remained the largest application, holding 27.53% of plasmid purification market share in 2024, buoyed by more than 700 active clinical programs. Cell therapy, CRISPR screening, and antibody production add diversified demand, each imposing unique purity and topology specifications.
Permanent mRNA capacity repurposes into oncology, rare-disease, and personalized-vaccine pipelines, requiring consistent plasmid templates to sustain high transcription yields. Continuous purification technologies boost throughput, supporting large-volume orders without compromising quality. Meanwhile, CRISPR and cell therapy segments seek plasmids optimized for expression efficiency in diverse cellular contexts, challenging suppliers to provide flexible yet standardized solutions within the plasmid purification market.
By End User: CDMOs Emerge as Growth Leaders
CDMOs are advancing at 13.09% CAGR, reflecting pharma’s strategy to outsource complex plasmid production. Pharmaceutical and biotechnology companies maintained 44.58% of plasmid purification market size in 2024, underscoring their role as primary purchasers of kits, reagents, and services. Academic and government institutes remain steady buyers of research-grade products, while synthetic-biology start-ups populate the “others” category.
CDMOs differentiate through capacity scale, geographic reach, and platform breadth. Samsung Biologics leveraged its S-HiConTM formulation platform to secure over USD 1.4 billion in contracts during 2024. Dual-sourcing remains standard practice, but deeper partnerships form as CDMOs bundle plasmid, viral-vector, and fill-finish offerings. Successful providers market regulatory expertise and digital release analytics, raising the competitive bar in the plasmid purification industry.
Geography Analysis
North America dominated with 37.56% plasmid purification market share in 2024, driven by a dense concentration of gene-therapy sponsors, mature CDMOs, and a regulatory environment that expedites clinical progression. The United States hosts the largest installed base of GMP suites, while Canada’s supportive policies foster biotech growth. Mexico is emerging as a cost-competitive manufacturing hub, though capacity remains limited. Consolidation trends, such as Thermo Fisher Scientific’s Solventum acquisition, reinforce North American leadership by vertically integrating supply chains.
Asia-Pacific is projected to register a 12.74% CAGR through 2030, the fastest worldwide. China’s sizable government incentives and academic talent pool underpin rapid expansion, especially in synthetic biology. Japan and South Korea maintain sophisticated biologics infrastructures, while Australia offers streamlined regulatory pathways that attract clinical trials. India’s cost-effective workforce and expanding CDMO presence contribute additional upside, although regulatory harmonization is still progressing. Joint ventures like Agilent’s nucleic-acid collaboration with Sangon Biotech illustrate knowledge transfer into the region.
Europe retains meaningful scale thanks to established pharmaceutical clusters in Germany and the United Kingdom, complemented by French, Italian, and Spanish initiatives in gene therapy. Harmonized EMA guidelines facilitate cross-border trials, and funding schemes support commercial manufacturing. Catalent’s USD 160 million Oxfordshire expansion exemplifies the region’s continued investment in plasmid capabilities. South America, the Middle East, and Africa are smaller but rising participants; constrained GMP capacity and limited talent pools temper acceleration, yet increasing research engagement hints at long-term opportunity for the plasmid purification market.

Competitive Landscape
The plasmid purification market shows moderate consolidation, with recent mega-deals signaling a shift toward integrated, end-to-end platforms. Thermo Fisher Scientific’s USD 4.1 billion Solventum buy and Novo Holdings’ USD 16.5 billion Catalent acquisition concentrate technology, services, and distribution under fewer umbrellas, heightening entry barriers. Players with broad portfolios and global footprints command pricing power and preferred-supplier status.
Competitive differentiation increasingly hinges on automation, process-analytic technologies, and digital batch-release capabilities. Samsung Biologics’ integrated S-HiConTM system illustrates how high-concentration formulation know-how wins sizable contracts. Continuous purification adoption offers cost and quality benefits that nimble newcomers may exploit. At the same time, niche specialists focusing on high-copy CRISPR plasmids or microbial hosts can carve defensible positions by catering to emerging segments. Overall, strategic vertical integration and technology leadership are redefining success factors within the plasmid purification market.
Plasmid Purification Industry Leaders
Thermo Fisher Scientific Inc.
QIAGEN N.V.
Merck KGaA
Danaher Corporation
Takara Bio Inc.
- *Disclaimer: Major Players sorted in no particular order

Recent Industry Developments
- July 2025: Takara Bio Europe signed a distribution accord with MACHEREY-NAGEL, broadening access to the latter’s bioanalysis portfolio across ten European countries.
- May 2025: Thermo Fisher Scientific launched the Applied Biosystems MagMAX Pro HT NoSpin Plasmid MiniPrep Kit, enabling rapid, automated plasmid isolation for small-scale experiments.
- May 2025: 3P BIOVIAN introduced the AAVion platform, integrating in-house plasmid production with end-to-end AAV manufacturing to streamline gene-therapy development.


Global Plasmid Purification Market Report Scope
| Kits & Reagents |
| Instruments & Systems |
| Consumables |
| Purification Services |
| Research-grade |
| GMP-grade |
| Gene Therapy Development |
| DNA Vaccine Production |
| mRNA Manufacturing |
| Cell Therapy Manufacturing |
| CRISPR & Gene-Editing Research |
| Antibody Production |
| Pharmaceutical & Biotechnology Companies |
| Contract Development & Manufacturing Organizations (CDMOs) |
| Academic & Government Research Institutes |
| Others |
| North America | United States |
| Canada | |
| Mexico | |
| Europe | Germany |
| United Kingdom | |
| France | |
| Italy | |
| Spain | |
| Rest of Europe | |
| Asia-Pacific | China |
| Japan | |
| India | |
| Australia | |
| South Korea | |
| Rest of Asia-Pacific | |
| Middle East and Africa | GCC |
| South Africa | |
| Rest of Middle East and Africa | |
| South America | Brazil |
| Argentina | |
| Rest of South America |
| By Product & Services Type | Kits & Reagents | |
| Instruments & Systems | ||
| Consumables | ||
| Purification Services | ||
| By Purity Grade | Research-grade | |
| GMP-grade | ||
| By Application | Gene Therapy Development | |
| DNA Vaccine Production | ||
| mRNA Manufacturing | ||
| Cell Therapy Manufacturing | ||
| CRISPR & Gene-Editing Research | ||
| Antibody Production | ||
| By End User | Pharmaceutical & Biotechnology Companies | |
| Contract Development & Manufacturing Organizations (CDMOs) | ||
| Academic & Government Research Institutes | ||
| Others | ||
| By Geography | North America | United States |
| Canada | ||
| Mexico | ||
| Europe | Germany | |
| United Kingdom | ||
| France | ||
| Italy | ||
| Spain | ||
| Rest of Europe | ||
| Asia-Pacific | China | |
| Japan | ||
| India | ||
| Australia | ||
| South Korea | ||
| Rest of Asia-Pacific | ||
| Middle East and Africa | GCC | |
| South Africa | ||
| Rest of Middle East and Africa | ||
| South America | Brazil | |
| Argentina | ||
| Rest of South America | ||


Key Questions Answered in the Report
What is the current value of the plasmid purification market and its outlook to 2030?
The market is valued at USD 1.99 billion in 2025 and is forecast to climb to USD 3.33 billion by 2030, growing at a 10.79% CAGR.
Which segment holds the largest share of global revenue?
Kits and reagents remain the biggest revenue contributor, accounting for 44.33% of 2024 sales.
Why are CDMOs growing faster than other end-user groups?
Pharmaceutical companies increasingly outsource plasmid production to CDMOs to tap specialized GMP expertise and shorten time-to-clinic, driving a 13.09% CAGR for the segment.
How will FDA adoption of recombinant Factor C testing affect manufacturers?
Moving from LAL to rFC raises quality benchmarks and operating costs; companies that validate the new assay quickly will gain an edge with regulators and clients.
Which geographic region is expanding the quickest?
Asia-Pacific is projected to post the fastest 12.74% CAGR through 2030, propelled by large-scale investments in China, Japan, and South Korea.
What technological shift is redefining cost structures in plasmid purification?
Continuous, closed-system purification—such as multicolumn continuous chromatography—delivers higher yields, lower contamination risk, and better scalability than legacy batch methods.
Page last updated on:


