
Sterile Filtration Market Size and Share
Market Overview
| Study Period | 2020 - 2031 |
|---|---|
| Market Size (2026) | USD 9.95 Billion |
| Market Size (2031) | USD 15.58 Billion |
| Growth Rate (2026 - 2031) | 9.38 % |
| Fastest Growing Market | Asia-Pacific |
| Largest Market | North America |
| Market Concentration | Low |
Major Players *Disclaimer: Major Players sorted in no particular order Image © Mordor Intelligence. Reuse requires attribution under CC BY 4.0. | |
Sterile Filtration Market Analysis by Mordor Intelligence
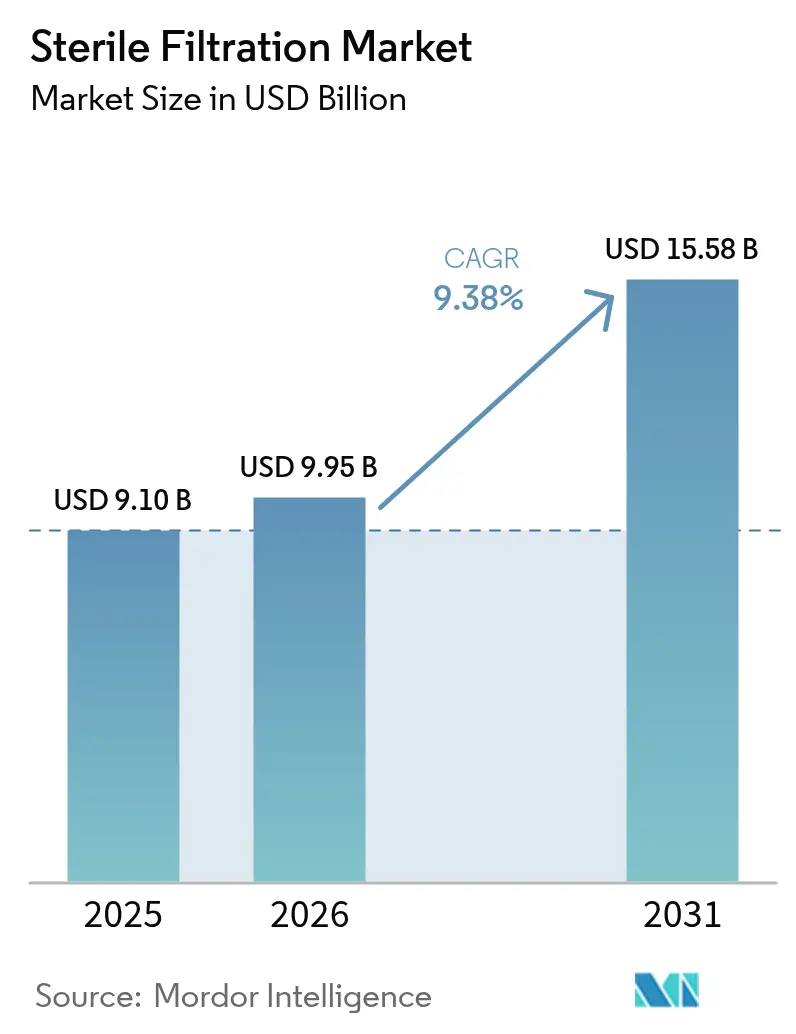
Sterile filtration market size in 2026 is estimated at USD 9.95 billion, growing from 2025 value of USD 9.1 billion with 2031 projections showing USD 15.58 billion, growing at 9.38% CAGR over 2026-2031. Rising contamination-control standards for advanced therapy medicinal products, together with the European Medicines Agency’s revised Annex 1 guidelines that require rigorous pre-use post-sterilization integrity testing, keep capital and validation spending on an upward trajectory. Demand scales further as chronic diseases spur sterile injectable volumes and single-use manufacturing gains wider acceptance. Contract development and manufacturing organizations (CDMOs) boost regional capacity, helping biopharma companies de-risk supply chains while maintaining speed to clinic. Cartridge filters remain the volume workhorse, yet capsule filters grow fastest on the back of small-batch gene and cell therapy requirements. Polyethersulfone (PES) membranes lead current installations, although looming PFAS restrictions are pushing producers to diversify away from polyvinylidene fluoride (PVDF).
Key Report Takeaways
- By product type, cartridge filters held 31.45% of the sterile filtration market share in 2025, while capsule filters are projected to register a 10.22% CAGR through 2031.
- By membrane material, PES led with 24.95% share of the sterile filtration market size in 2025; PVDF membranes are set to expand at 10.03% CAGR between 2026-2031.
- By filtration technique, microfiltration accounted for 29.15% revenue in 2025, whereas ultrafiltration is expected to grow at 12.34% CAGR to 2031.
- By application, final fill/finish secured 19.75% share of the sterile filtration market size in 2025, and ATMP small-batch filtration is forecast to advance at a 13.05% CAGR through 2031.
- By end user, pharmaceutical and biopharmaceutical firms captured 39.75% revenue in 2025, while CDMOs are poised to expand at 12.64% CAGR to 2031.
- By geography, North America led with 38.10% revenue share in 2025, while Asia Pacific is forecast to expand at a 8.98% CAGR to 2031.
Note: Market size and forecast figures in this report are generated using Mordor Intelligence’s proprietary estimation framework, updated with the latest available data and insights as of 2026.
Global Sterile Filtration Market Trends and Insights
Drivers Impact Analysis*
| Driver | (~) % Impact on CAGR Forecast | Geographic Relevance | Impact Timeline |
|---|---|---|---|
| Growing Burden Of Chronic & Rare Diseases | +2.10% | Global, with highest impact in North America & Europe | Long term (≥ 4 years) |
| Expansion Of Global Biopharmaceutical Manufacturing Capacity | +1.80% | APAC core, spill-over to North America & Europe | Medium term (2-4 years) |
| Shift Toward Single-Use And Modular Production Facilities | +1.50% | Global, led by North America & Europe | Medium term (2-4 years) |
| Stricter Global GMP & Annex 1 Revisions Tightening Filter Validation | +1.30% | Europe primary, North America secondary | Short term (≤ 2 years) |
| Surge In Advanced-Therapy Medicinal Products (ATMPs) Needing Low-Volume Sterile Runs | +1.20% | North America & Europe, emerging in APAC | Long term (≥ 4 years) |
| AI-Driven Predictive Maintenance Reducing Filtration Failure Risk | +0.60% | Global, with early adoption in developed markets | Medium term (2-4 years) |
| Source: Mordor Intelligence | |||
Growing Burden of Chronic & Rare Diseases
Orphan drugs represented nearly 50% of FDA-recognized therapeutics in 2024, anchoring sustained demand for final fill/finish filtration and driving long-run volume growth in the sterile filtration market. Capsule formats benefit most because they match low-volume, high-value production, while expedited approval pathways compress timelines and increase readiness pressure. Aging populations in developed economies, alongside improved access in emerging regions, hard-wire this demand driver into long-term health-care infrastructure.
Expansion of Global Biopharmaceutical Manufacturing Capacity
Total installed biopharma capacity rose from 16.5 million L in 2018 to 17.4 million L in 2025, with Samsung Biologics and MilliporeSigma committing multi-billion-dollar programs in South Korea. CDMOs are forecast to control 54% of global biologics capacity by 2028, underscoring the importance of standardized, validated filtration lines that can switch rapidly between client projects while meeting harmonized regulatory demands.
Shift Toward Single-Use and Modular Production Facilities
Single-use technology continues to grow at double-digit rates because it limits cross-contamination risk and curtails cleaning validation, thereby reinforcing sterile filtration market adoption. Integrated capsule filters reduce aseptic connections, streamline facility start-up, and enable distributed regional manufacturing footprints that align with personalized-medicine supply chains.
Stricter Global GMP & Annex 1 Revisions Tightening Filter Validation
Europe’s revised Annex 1, effective August 2023, mandates contamination-control strategies that elevate integrity-testing frequency and automation. Filter vendors differentiate through validation services and real-time monitoring, but smaller producers face higher compliance overhead, accelerating consolidation among manufacturers with robust regulatory infrastructure.
Restraints Impact Analysis*
| Restraint | (~) % Impact on CAGR Forecast | Geographic Relevance | Impact Timeline |
|---|---|---|---|
| High Total Cost Of Ownership Of Validated Sterile Filters | -1.40% | Global, with highest impact in cost-sensitive emerging markets | Medium term (2-4 years) |
| Membrane Fouling & Integrity Test Failures Causing Downtime | -0.90% | Global, particularly affecting high-volume production facilities | Short term (≤ 2 years) |
| Long Lead-Times For Regulatory Re-Validation After Filter Or Process Change | -0.70% | Global, with highest impact in highly regulated markets | Medium term (2-4 years) |
| Emerging PFAS Regulations Threatening PTFE/PVDF Membrane Supply | -0.80% | Europe primary, with global supply chain implications | Long term (≥ 4 years) |
| Source: Mordor Intelligence | |||
High Total Cost of Ownership of Validated Sterile Filters
EU Annex 1 compliance has increased filtration-related costs by as much as 30%, a burden that smaller biopharma firms struggle to absorb. Fixed validation expenses encourage outsourcing to CDMOs with established platforms, creating scale advantages for larger players and raising entry barriers for novel filter formats that require extensive re-qualification.
Membrane Fouling & Integrity Test Failures Causing Downtime
Complex biologics can foul membranes or trigger integrity-test failures, causing line stoppages that jeopardize batch release.[1]Johannes E. Vogel, “Development and Upscaling of a Sterile Filtration Step for Concentrated Lentiviral Vectors,” Biotechnology Journal, onlinelibrary.wiley.com Advanced therapy manufacturers are especially exposed owing to high-value, low-volume lots. Predictive maintenance tools help mitigate the risk but demand capital and data expertise that not all sites can marshal.
*Our forecasts treat driver/restraint impacts as directional, not additive. The impact forecasts reflect baseline growth, mix effects, and variable interactions.
Segment Analysis
By Product: Capsule Filters Drive Innovation
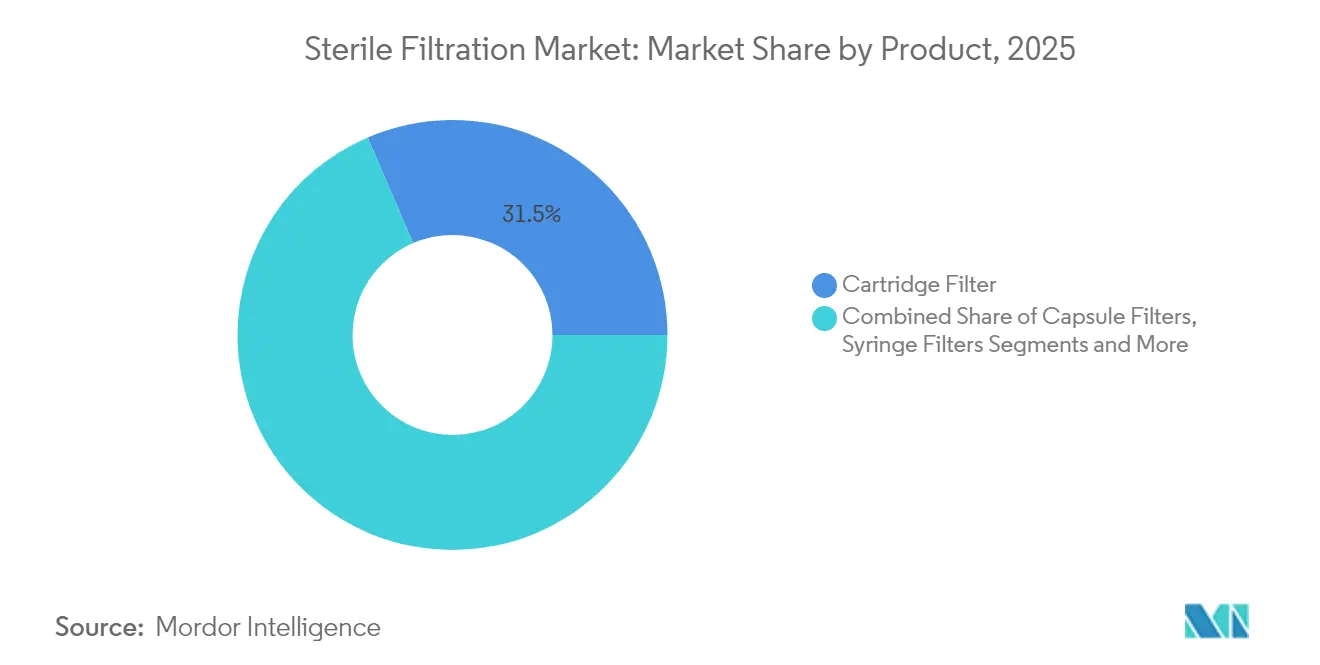
Cartridge filters dominated 2025 with 31.45% revenue, confirming their incumbency in high-volume plant operations. Capsule filters, however, are forecast to log a 10.22% CAGR owing to flexible batch scalability for personalized therapies. This momentum anchors the sterile filtration market size expansion for ATMP producers that need rapid changeovers without re-cleaning. Cytiva’s Emflon II gamma-compatible modules exemplify single-use advances that eliminate CIP validation burdens.
Syringe filters keep laboratory and clinical trial workflows moving even though their growth remains modest. Accessories such as holders, vent filters, and assemblies provide incremental gains as manufacturers emphasize closed-system integration to limit contamination events. This is a critical concern for regulators enforcing Annex 1 clarity on aseptic connections.



By Membrane Material: PES Dominance Faces PVDF Pressure
Polyethersulfone membranes held a 24.95% share in 2025 due to low protein binding and robust throughput, cementing their status for final fill/finish lines. PVDF variants are projected to grow 10.03% annually until 2031, driven by chemical resistance, yet pending PFAS restrictions in Europe threaten long-term accessibility. PES suppliers invest in next-generation grades to capture capacity migrating from PVDF.
PTFE, nylon, and mixed cellulose ester membranes fill application niches spanning gas filtration to low-cost buffer prep. The sterile filtration market is expected to witness accelerated R&D in fluoropolymer-free chemistries as customers look to de-risk material compliance and avoid costly system re-validation.
By Filtration Technique: Ultrafiltration Gains Momentum
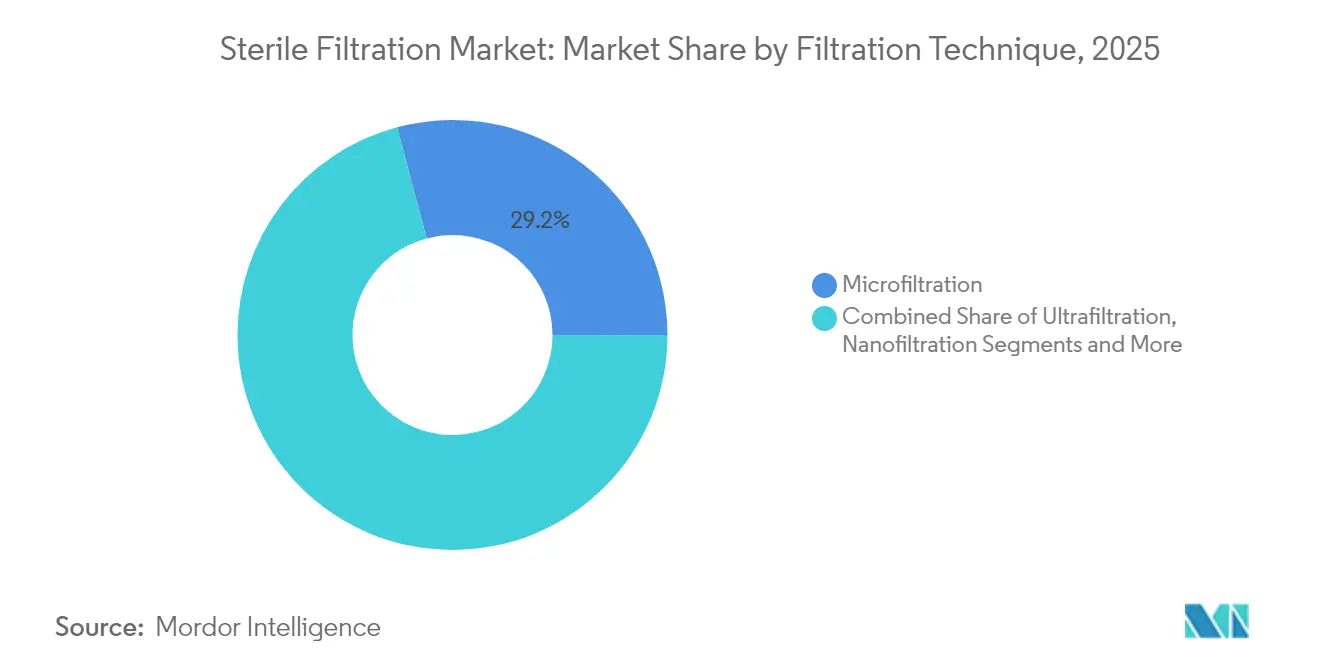
Microfiltration sustained 29.15% revenue in 2025 as the default microbial barrier in bulk drug manufacturing. Ultrafiltration, growing at 12.34% CAGR, is increasingly chosen for virus clearance and protein concentration, serving the surge in monoclonal antibody and gene therapy pipelines. Toray’s hollow-fiber development, which marries selectivity with high flux, illustrates technical progress that shortens processing cycles.
Nanofiltration and reverse osmosis continue to underpin water-for-injection and buffer concentration schemes, though their higher energy and capital intensity keep them in specialized roles rather than broad adoption across the sterile filtration market.
By Application: ATMP Small-Batch Drives Growth
Final fill/finish retained 19.75% share of the sterile filtration market in 2025 because regulations require terminal filtration immediately before container closure. The ATMP small-batch niche is on track for 13.05% CAGR as gene and cell therapy pipelines commercialize and require validated, low-hold-up volume capsules.
Buffer/media prep and water-for-injection filtration move in lock-step with overall capacity additions, whereas air and gas sterilization rise as single-use systems demand validated venting for blow-fill-seal lines and closed processing steps.
By End User: CDMOs Accelerate Adoption
Pharmaceutical and biopharmaceutical companies produced 39.75% of 2025 sales, yet CDMOs will advance faster at 12.64% CAGR as sponsors outsource production and expect plug-and-play validation files. The sterile filtration market share gains for service providers mirror their rising stake in global biologic capacity, forecast to reach 54% by 2028.
Academic and government labs sustain steady bench-scale demand, while food and beverage processors adopt pharmaceutical-style sterility assurance mainly in high-risk liquids such as dairy concentrates and probiotic beverages.
Geography Analysis
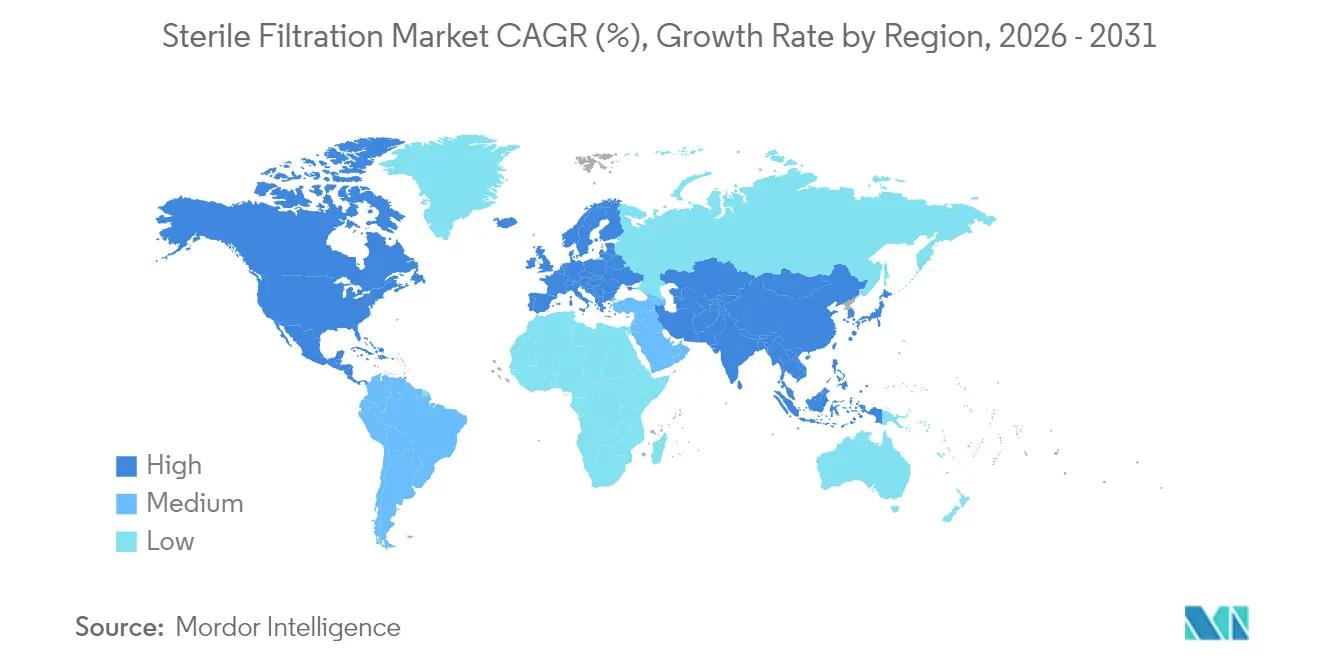
North America and Europe command the lion’s share of 2025 revenue owing to entrenched biopharmaceutical clusters, advanced regulatory oversight, and a strong pipeline of injectable therapeutics. U.S. capacity expansions from Novo Nordisk’s USD 4.1 billion site in North Carolina to Eli Lilly’s USD 2 billion Concord investment embed long-run demand for filtration hardware and validation services. Europe’s Annex 1 revisions, now the global contamination-control benchmark, compel every drug maker exporting into the region to align filtration strategies.
Asia Pacific, led by South Korea, delivers the fastest-growing sterile filtration market through 2031 because of major greenfield projects such as Cytiva’s USD 326 million Incheon plant and Samsung Biologics’ multi-billion-dollar campus. China and India scale facilities that meet FDA and EMA standards, while Japan’s materials expertise buttresses membrane R&D, reinforcing regional self-sufficiency goals. MilliporeSigma’s EUR 300 million Daejeon center underlines incumbent suppliers’ commitment to localizing production.
Middle East & Africa and South America remain emerging but strategic territories. Brazil and Argentina advance fill/finish lines to curb import reliance, and GCC nations embed pharmaceutical manufacture within diversification plans. Technology transfer initiatives and government incentives ease skills gaps and build the regulatory foundations needed for future sterile filtration market penetration.

Regulatory Landscape
Sterile filtration for sterile medicinal products is governed by stringent GMP expectations for aseptic processing, with the European Commission's EU GMP Annex 1 (revised, effective August 2023) tightening contamination-control strategies and reinforcing sterilizing filtration as a process step supported by pre-use, post-sterilization integrity testing. These requirements shape what global suppliers and drug manufacturers need to put in validation packages, including integrity test methods and documentation practices across sites that export into Europe.
In the United States, FDA cGMP expectations for aseptic processing and sterile drug manufacturing continue to require validated sterilizing-grade filtration and robust process controls. FDA-recognized consensus standards such as ISO 13408-2:2018 (Aseptic processing, sterilizing filtration) provide harmonized approaches to filter validation, and industry guidance evolves alongside regulatory scrutiny, including PDA Technical Report No. 26 (revised November 2025) for sterilizing filtration of liquids and EMA work on updating Part IV GMP guidance for ATMPs (concept phase pointing to a September 2026 draft) that keeps advanced-therapy manufacturers focused on contamination-control and validation readiness.
Value Chain Analysis
The value chain starts with upstream polymer and additive supply, then moves into membrane casting/spinning and conversion into sterilizing-grade media. Device component fabrication follows (housings, end caps, connectors), then cartridges/capsules and single-use manifolds are assembled, and sterilization services are performed, including gamma irradiation for many single-use assemblies. Downstream, suppliers support validation documentation, integrity-test method assistance, and quality agreements, and sell through direct bioprocessing teams and specialized distributors to pharmaceutical/biopharmaceutical manufacturers, CDMOs, and laboratory users.
Bottlenecks concentrate around specialty membrane capacity and qualification friction, including long lead times for high-performance membrane production and constrained access to irradiation and validated assembly capacity. Customers also face re-validation requirements when filters or materials change, which pushes manufacturers to localize and partner to secure redundant supply and shorten logistics cycles. This is reflected in Ion Exchange (India) Ltd and MANN+HUMMEL announcing an April 2026 technology and manufacturing collaboration to produce PVDF ultrafiltration membranes and skidded systems in Goa, India, and in Merck expanding filtration-related production lines in India to support regulated bioprocess supply continuity.
Competitive Landscape
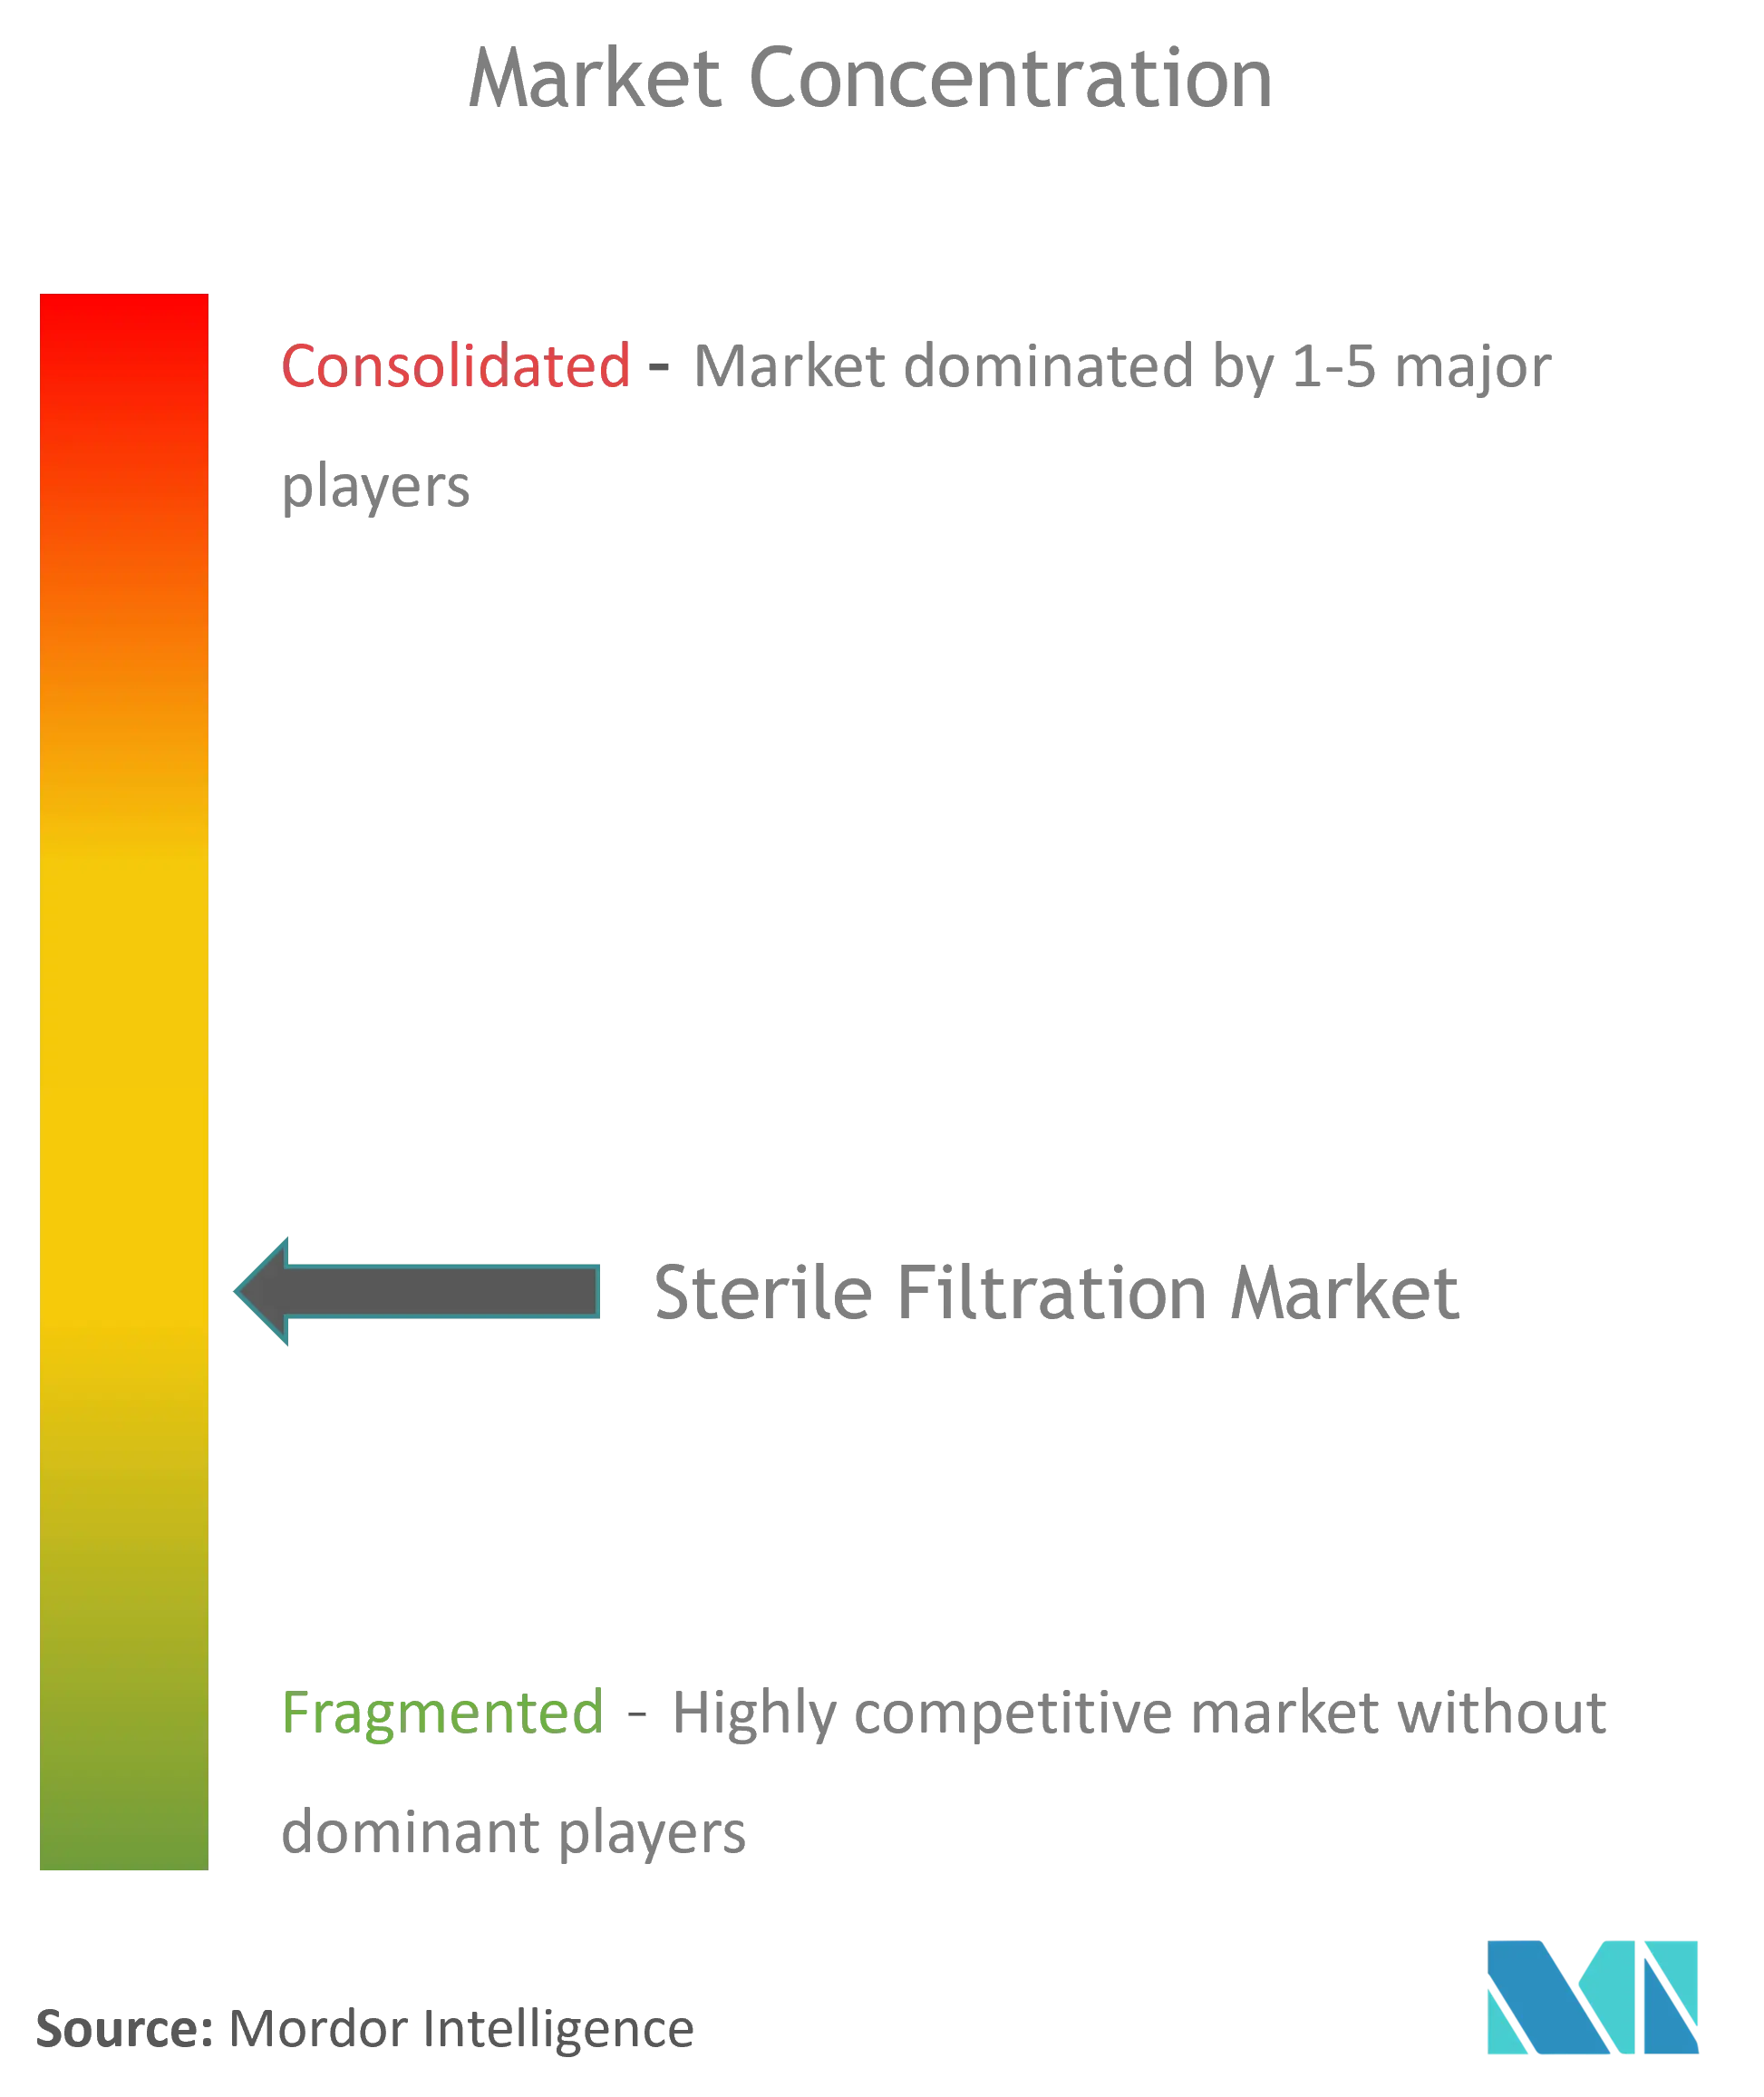
The sterile filtration market demonstrates moderate concentration. Danaher, Sartorius, and Merck KGaA leverage broad portfolios, validation toolkits, and global supply chains to safeguard their share as Annex 1 rules tighten. Danaher reported USD 5.74 billion revenue for Q1 2025 with sustained bioprocessing order growth over seven quarters, reflecting resilient demand for filtration and single-use assemblies.
Thermo Fisher’s USD 4.1 billion purchase of Solventum’s purification and filtration line intensifies competition, extending its reach into high-growth biologics workflows. AI-driven predictive maintenance, disposable system integration, and PFAS-free membrane alternatives are becoming decisive differentiators. Smaller innovators thrive in niches—virus filters with superior flux or regional servicing—but higher compliance hurdles encourage strategic partnerships or bolt-on deals with larger multinationals.
Regulators also spur innovation; FDA patent activity around real-time integrity analytics indicates a future where automated systems can flag contamination risks as batches run, rewarding suppliers equipped with sensor-rich cartridges and data platforms.[3]U.S. Food and Drug Administration, “Q5A(R2) Viral Safety Evaluation of Biotechnology Products,” fda.gov As customers prioritize risk mitigation over unit cost, technology leadership and global support networks outweigh simple price competition.
Sterile Filtration Industry Leaders
Merck KGaA
Danaher Corporation
ThermoFisher Scientific Inc.
Sartorius AG
GE Healthcare
- *Disclaimer: Major Players sorted in no particular order

Market Opportunities and Future Outlook
Compliance-led upgrades around contamination-control strategies increase the case for suppliers that bundle sterilizing-grade filters with validation services, integrity-test automation, and documentation that reduces change-control burden under EU GMP Annex 1 (effective August 2023). As single-use and modular facilities expand, and integrity-testing frequency rises, sponsors and CDMOs increasingly seek integrated capsule and assembly configurations aimed at reducing aseptic connections and simplifying qualification.
Regional capacity build-outs and supply-chain localization programs also create opportunities for in-region membrane and assembly manufacturing and for qualified second-source strategies, particularly in Asia Pacific and India. The most concrete investment signals include Merck opening a EUR 150 million filtration manufacturing facility in Cork, Ireland (September 2025) and Cytiva inaugurating a 6,100 m2 sterile filtration-focused plant in Incheon, South Korea (November 2024, targeted to be fully operational in 2026). Material and chemistry diversification is another actionable area as customers and suppliers assess exposure to emerging PFAS-related restrictions, which may affect fluoropolymer-containing membranes and components and drive demand for alternative membrane chemistries and re-qualified product families that maintain performance while de-risking regulatory and procurement constraints.
Recent Industry Developments
- April 2026: Merck announced an expansion of its Peenya, Bengaluru manufacturing facility, adding new production lines for filtration hardware systems and Pellicon 2 ultrafiltration cassettes. The expansion strengthens localized supply for regulated bioprocess filtration consumables and supports shorter lead times for customers managing qualification and change control across global sites.
- September 2025: Merck opened a climate-neutral EUR 150 million filter manufacturing facility at Blarney Business Park in Cork, Ireland. The site expands European capacity for bioprocess filtration components and supports customers aligning operations to Annex 1 contamination-control expectations, while emphasizing sustainability in manufacturing footprints.
- November 2024: Cytiva inaugurated a 6,100 m2 manufacturing facility in Incheon, South Korea focused on sterile filtration production. Adding capacity in Asia Pacific supports regional biomanufacturing expansion and provides supply redundancy for single-use and sterilizing filtration formats used in fill/finish and advanced-therapy workflows.


Research Methodology Framework and Report Scope
Market Definition and Coverage
This market covers revenues generated from sterile filtration used to remove microorganisms and particulates from liquids and gases to meet sterility needs in manufacturing and laboratory settings.
Scope exclusions: This sizing does not count sterilization equipment or services (such as autoclaves and irradiation) unless they are sold as part of sterile filtration products.
Segmentation Overview
- By Product
- Cartridge Filters
- Capsule Filters
- Syringe Filters
- Other Membrane Filters
- Accessories
- By Membrane Material
- PES
- PVDF
- PTFE
- Nylon & MCE
- Others (PP, RC, etc.)
- By Filtration Technique
- Microfiltration
- Ultrafiltration
- Nanofiltration & Reverse Osmosis
- By Application
- Final Fill / Finish
- Buffer & Media Preparation
- Water-for-Injection & Utilities
- Air & Gas Sterilization
- Others
- By End User
- Pharmaceutical & Biopharmaceutical Companies
- Contract Development & Manufacturing Organizations (CDMOs)
- Academic & Government Research Labs
- Food & Beverage Manufacturers
- Geography
- North America
- United States
- Canada
- Mexico
- Europe
- Germany
- United Kingdom
- France
- Italy
- Spain
- Rest of Europe
- Asia Pacific
- China
- Japan
- India
- South Korea
- Australia
- Rest of Asia Pacific
- Middle East & Africa
- GCC
- South Africa
- Rest of Middle East & Africa
- South America
- Brazil
- Argentina
- North America
Data Sources, Market Sizing, and Validation
Desk Research
Desk research starts with mapping where sterile filtration demand comes from and how it flows through regulated industries. We reviewed public health and production indicators that explain why sterile filtration is purchased, and how usage intensity changes with biologics, vaccines, and injectable drug output.
For grounding the model, we referenced non-paywalled sources such as US FDA guidance and inspection communications on sterile drug manufacturing, the European Medicines Agency quality guidelines, ISO standards that define sterile processing expectations, and USP chapters relevant to sterility and filtration practices. We also incorporated trade statistics from sources such as UN Comtrade. Company filings, investor presentations, regulatory news, peer reviewed articles, and selective paid subscriptions for company financials and patent databases were used to track product mix shifts and the pace of innovation. These are examples only, and many other sources were also used for data collection, validation, and research clarification.
Primary Interviews and Surveys
Primary work was used to test how demand is really purchased and priced across common use cases, including upstream and downstream bioprocessing, sterile fill finish, and lab filtration. We spoke with a mix of manufacturers, distributors, and end users, and then used their inputs to confirm assumptions on replacement cycles, qualification requirements, and typical price movement by filter format and membrane type across regions.
Distribution of primary research fieldwork respondents
| Company type | Respondent position | Region |
|---|---|---|
| Top tier: 25% | CXOs: 14% | APAC: 45% |
| Mid tier: 61% | Functional/Unit leaders: 27% | EMEA: 29% |
| Smaller Players: 14% | Managers: 59% | Americas: 26% |
Market-Sizing & Forecasting
Market sizing is built using a top down model where biopharma and lab activity indicators are converted into a sterile filtration demand pool, and then translated into value using realistic pricing bands. Once that total is formed, it is cross checked using selective bottom up approximations, such as sampled filter consumption per process step, channel checks on replacement volumes, and revenue ranges implied by public company disclosures.
To keep the model tied to observable signals, we used inputs such as biologics and vaccine manufacturing trends, sterile injectable production intensity, growth in single use processing adoption, typical filter change out frequency in critical steps, and the mix shift between membrane materials and filter formats (cartridge, capsule, syringe, and related assemblies). Where local data was thin, gaps were handled through proxy indicators like capacity additions, import patterns for filtration consumables, and expert confirmed ranges, which are then adjusted during reviews.
For forecasting, scenario analysis was used to reflect different ramp rates in biologics capacity, quality related revalidation cycles, and regional manufacturing expansion. Assumption paths for volume growth and price progression were aligned with what respondents expected for the next few years, and then applied consistently across regions to avoid overstating momentum.
Data Validation & Update Cycle
Outputs are validated by comparing the market total against independent signals, including investment cycles in biomanufacturing, regulatory driven quality upgrades, and visible trade and capacity movements. If a segment grows too quickly or drops without a clear driver, the underlying volumes, prices, and conversion assumptions are revisited, and follow up calls are triggered to clarify the variance.
Before sign off, the model goes through multi step analyst reviews where assumptions are challenged and recalculated in a consistent template. The report is refreshed annually, and interim updates are made when material events occur, such as major capacity announcements or major regulatory shifts. Right before delivery, a final pass is completed so clients receive the most current view available.
Mordor Intelligence's Sterile Filtration Market Size Versus Other Published Estimates
Published market values for sterile filtration can look far apart because the scope line is not drawn the same way, and because pricing and volume assumptions are refreshed at different times. In practice, the biggest shifts come from whether lab filtration is fully counted, how single use assemblies are treated, and if adjacent filtration categories are blended into the total.
By tracking qualification driven replacement cycles and end user purchasing patterns, Mordor Intelligence keeps the sterile filtration total focused on filtration products used for sterility assurance, instead of folding in broader filtration or sterilization spend that follows different demand drivers.
Benchmark comparison
| Source | Market Size | Gaps in Research Methodology |
|---|---|---|
| Mordor Intelligence | USD 9.95 B (2026) | |
| Global Consultancy A | USD 8.81 B (2024) | Uses an earlier base year and a faster growth track, and the scope appears to combine multiple filtration product buckets with limited visibility on replacement frequency assumptions. |
| Industry Publisher B | USD 8.65 B (2025) | Centers the estimate on a single reference year and applies a broad CAGR, with less detail on how single use assemblies, lab filtration, and regional price differences are separated. |
The spread in values is mostly explained by year selection and what gets counted inside the sterile filtration boundary, especially lab usage and single use related components. Our approach stays traceable because the main inputs are linked to manufacturing activity, replacement behavior, and price bands that can be rechecked during updates.


Key Questions Answered in the Report
What is the current size of the sterile filtration market?
The sterile filtration market is valued at USD 9.95 billion in 2026 and is projected to grow to USD 15.58 billion by 2031.
Which product type leads the sterile filtration market?
Cartridge filters lead with 31.45% share in 2025, while capsule filters are growing fastest at a 10.22% CAGR.
Why is Asia Pacific the fastest-growing region?
Large-scale investments by Samsung Biologics, Cytiva, and others are boosting biopharmaceutical capacity and driving filtration demand.
How are Annex 1 revisions affecting filtration suppliers?
The new guidelines increase integrity-testing frequency and validation documentation, favoring suppliers with advanced monitoring and compliance services.
Which end-user group is expanding the quickest?
CDMOs are forecast to rise at 12.64% CAGR as pharmaceutical companies outsource more manufacturing activities.
Page last updated on:


 Your data is secure and never sold or shared.


